Printed in the Republic of Korea DOI 10.5012/jkcs.2010.54.3.300
요약. 대상 수용액으로부터 상업용 염료인 메틸렌 블루(MB)와 말라카이트 그린 옥살레이트(MG)의 제거를 위한 소듐-교환 된 점토 입자의 흡착능을 다양한 실험조건에서 조사하였다. 용액의 pH, 교반 시간, 흡착물 농도, 흡착제 투여량 등의 효과를 조 사하였다. pH 7, 298 K 조건에서 0.03 그람 점토를 사용한 경우 수용액으로부터 최대 > 90%의 염료가 제거되었다. 흡착과정은 빨랐으며 5분 내에 평형에 도달하였다. 사용된 염료들의 흡착반응에 대해 반응속도론 실험에서 유사 2차반응이 관찰되었고 실험 데이터와 잘 일치하였다. 흡착평형은 높은 회귀계수 R2 > 0.98로 Langmuir 와 Dubini-Radushkevich (D-R) 등온에 따랐 다. 이 D-R 모델로부터 평균자유에너지 Ea 는 MB와 MG 염료에 대해 각기 3.779와 2.564가 이었으며, 이것은 물리적 흡착과 정에 해당된다.
주제어: 소듐-교환 점토, 염료, 흡착, 등온, Langmuir, Freundlich, D-R
ABSTRACT. The ability of sodium-exchanged clay particles as an adsorbent for the removal of commercial dyes, Methylene blue (MB) and Malachite green oxalate (MG) from aqueous solutions has been investigated under various experimental con- ditions. The effect of the experimental parameters, such as pH solution, agitation time, adsorbate concentration and adsorbent dose were examined. Maximum adsorption of dyes, i.e. >90% has been achieved in aqueous solutions using 0.03 g of clay at a pH of 7 and 298 K for both dyes. The adsorption process was a fast and the equilibrium was obtained within the first 5 min. For the adsorption of both MB and MG dyes, the pseudo-second-order reaction kinetics provides the best correlation of the experi- mental data. The adsorption equilibrium results follow Langmuir and Dubini-Radushkevich (D-R) isotherms with high regression coefficients R2 > 0.98. The mean free energies Ea of adsorption from D-R model were 3.779 and 2.564 kj/mol for MB and MG respectively, which corresponds to a physisorption process.
Keywords: Sodium-exchanged clay, Dye, Adsorption, Isotherm, Langmuir, Freundlich, D-R
Maghnia 산 Montmorillonite 수용액으로부터 양이온 염료의 제거 비교연구
A. Elaziouti* and N. Laouedj†
LCPCE Laboratory, Faculty of sciences, Department of industrial Chemistry,
University of the Science and the technology of Oran (USTO M.B). BP 1505 El M’naouar 31000 Oran, Algeria
†DR. Moulay Tahar University, Saida, Algeria (접수 2010. 3. 29; 수정 2010. 3. 30; 게재확정 2010. 4. 5)
Comparison Study on the Removal of Cationic Dyes from Aqueous Suspension of Maghnia Montmorillonite
A. Elaziouti* and N. Laouedj†
LCPCE Laboratory, Faculty of sciences, Department of industrial Chemistry,
University of the Science and the technology of Oran (USTO M.B). BP 1505 El M’naouar 31000 Oran, Algeria
*E-mail: [email protected]
†DR. Moulay Tahar University, Saida, Algeria. E-mail: [email protected] (Received March 29, 2010; Revised March 30, 2010; Accepted April 5, 2010)
INTRODUCTION
Clay minerals, the most available, low cost and chemically active surface minerals world, are of great interest, practically because of their extensive uses in many scientific areas such as soil science (stoppage for fertilisers,1 photostabilizers of pesticides2), industrial technology (heterogenrous cataly- sis),3 colloidal science (decontamination of water,4 pharma-
ceutical and paint industries5) and photochemistry (guide for photo-redox reactions).6
The adsorption of cationic dyes in aqueous solutions of smectite-type clay is studied. This clay is a dioctahedral smec- tite with isomorphic substitutions of Al+3 by Mg+2 with struc- tural formula unit:
(Si8)IV (Al 4-x Mg x)VI O 20 (OH) 4 where x = 0.5 - 0.9.
(a)
(b)
(H3C)2N N(CH3)2
N
S+ Cl‒
CH3
CH3
CH3
Cl‒
H3C
C
N
+N
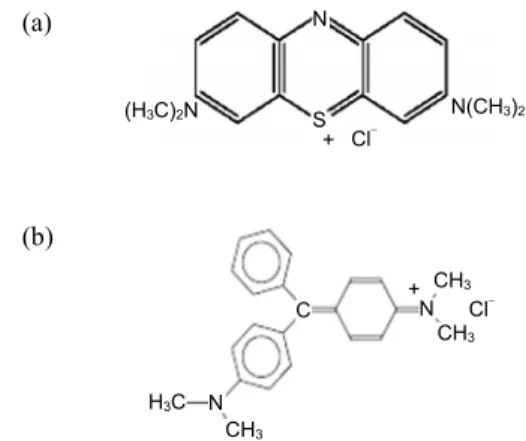
Fig. 1. Molecular structures of basic dyes: (a) Methylene blue (MB); (b) Malachite green oxalates (MG).
However for Maghnia montmorillonite, part of the nega- tive charge around 15 - 50% is due to tetrahedral substi- tutions of Si+4 by Al+3. This clay has an appreciable content of iron.
The interest of clay minerals for wastewater treatment in recent decade owing to their catalytic properties and high capacity in the removal pollutants too stable and resistant for conventional methods such as the oxydo-reduction and the exchanging resins of ions,7 coagulation/flocculation,8 membrane separation,9 adsorption,10 the biological me- thods,11 and more recently the advanced processes of oxi- dation.12
The adsorption of cationic dyes is not exclusively due to the ionic exchange mechanism but other interactions, such a hydrophobic effect between guest molecules on the clay surface13 and/or H-bonding14 can contribute to the adsorp- tion of organic dye on clay surface, favouring the dye agglo- meration.
In this work, Maghnia montmorillonite is used as an adsorbent for removal of cationic dyes, Methylene blue and Malachite green oxalate, from aqueous solutions onto clay is investigated. The effect of the optical properties of dyes in aqueous solutions and adsorbed onto montmorillonite was assessed in terms of the absorption bands maxima as a function of pH. The equilibrium and kinetics adsorption of dyes onto clay were studied. The experimental data were evaluated by applying the pseudo-first- and second-order.
The Langmuir, Freundlich and Dubini-Radushkevich (D-R) isotherm models were used to the isotherm data for their applicability.
MATERIALS AND METHODS
A thiazin group cation, Methylene blue (MB) (MW = 319,5 g.mol-1, λmax = 665 nm, ε = 95000 cm-1 mole-1dm3) and triphenylemethane dye, Malachite green oxalate (MW = 507. 51 g.mol-1, λmax = 617 nm, ε = 42000 cm-1 mole-1dm3), fromAcross product for microbiological analysis and were used without any further purification. Molecular structures of Methylene blue and Malachite green oxalate dyes were shown in Figure 1.
Aqueous dye solution stock was prepared by dissolving accurately weighed neat dye in distilled water to the con- centration of 1 g/L. Experimental solutions were obtained by successive dilutions.
Natural clay was supplied by the Ceramics Society of Maghnia (west of Algeria). The sodium form of clay with a particle size < 0.2 µm was prepared in order to obtain good clay colloidal dispersions, as follows: clay was saturated
with Na+ by repeated exchange with NaCl (1 M) aqueous solution. The < 0.2 particle size fraction was separated by centrifugation and it was washed several times with distilled water until free Cl‒ was not detected in the suspension (AgNO3 test). The < 0.2 fraction was collected by centrifu- gation and freeze dried at 60 oC for 24 h and is crushed. The material resulting from different treatmentswill be indicated by clay-Na.
Adsorption experiments were carried out as a single-stage batch test using a magnetically stirrer. A suspension con- taining 0.03 g of adsorbent sample was mixed with a 100 mL aqueous solution of dye at a known initial concentration and initial pH in a flask at constant temperature of 298 K. The initial pH values of the solutions were previous adjusted with 0.1 M HCl or NaOH using pH meter. Aliquot of the solution were withdrawn at a predetermined time intervals and were centrifuged at 4000 rpm for 10 min to remove any adsorbent particles. Dye concentrations in the supernatant solutions were subsequently estimated by measuring adsor- bance at maximum wavelengths of dyes. The adsorption tests were continued until the equilibrium concentration was reached. The experiments were done by varying the initial pH from 3 to 13), amount of adsorbent doses from 0.07 to 0.7 g/L and concentration of dyes solutions from 20 to 200 mg/L at different time intervals.
The data obtained from the adsorption experiments were then used to calculate the adsorption capacity, Qe (mg/g), of the adsorbent by a mass-balance relationship, which re- presents the amount of adsorbed dye per the amount of dry adsorbent Eq. (1):
Q (mg/g ) = {(Co - Ce) V}/m (1) where Co and Ce are the initial and equilibrium solution
Table 1. XRF analysis of the of the clay-Na sample.
Element Percentage by weight/unit
SiO2 60.75
Al2O3 24.15
Fe2O3 2.51
CaO 1.56
MgO 2.54
Na2O 3.63
K2O 0.65
SiO2/Al2O3 2.52
LIO 5.21
LOI: Loss on ignition
3 4 5 6 7 8 9 10 11 12 13 14
Initial pH
700
650
600
550
500
450
(MB)λmax (t = 0) (MB)λmax (t = 60 min) (MG)λmax (t = 0) (MG)λmax (t = 60 min)
Fig. 2. The position of absorption bands maxima of dyes in aque- ous solution and adsorbed onto clay-Na as a function of pH for [MB] = [MG] = 50 mg/L, [Clay-Na] = 0.3 g/L , T = 298 K and con- tact time = 60 min.
concentrations (mg/L) respectively. V is volume of the solu- tion (L), and m is the weight of the dry adsorbent used (g).
The removal rate A (%) of adsorbed dye was calculated based on following equation Eq. (2):
A(%) ={(Co - Ce) 100}/Co (2) The initial pH of the dye aqueous solution was recorded using (WTN: WISSENSCHAFLLICH TECHNISECHE WERKSTÄTTEN; weilehein Allemagne pH-330) digital pH-meter X-ray fluorescence was performed on a spectro- meter of mark (Oxford). The sample is powder tiny room and prepared (pearl borated) is subjected to a source of X-radiation of fluorescence characteristic of its chemical composition.
Vis-absorption spectra of the dye in aqueous solution and adsorbed on incinerated sludge were obtained by Model:
UV ‒ 2401 (PC) SHIMADZU ‒ corporation spectrometer in the range 350 - 800 nm, using 1 cm optical pathway cells.
RESULTS AND DISCUSSION
Table 1 displays the results of chemical composition in the clay-Na sample. The major elements of the clay-Na, expressed in terms of oxide, are primarily of silica, and alumina with appreciable iron content. The CaO and Na2O (K2O) reflect the contents of interlayer cationic in clay. The other oxides present in traces amounts such. In the perfect montmorillonite, the total theoretical content of SiO2 and Al2O3 is 92% 15 and the content ratio of SiO2 to Al2O3 is 2.6.
In the Maghnia clay, the total content of SiO2 and Al2O3 is 84.90% and the corresponding ratio of SiO2 to Al2O3 is 2.52, so this type of clay belongs to the Na-montmorillonite category. The cation capacity of exchange and total specific surface of the clay-Na sample were estimated by the me- thylene blue (MB) method16 are of 101.72 meq/100 gr of
clay-Na and 673.93 m2/g respectively.
Figure 2 illustrates the evolution of absorption bands maxima of dyes in aqueous solution and adsorbed onto clay-Na at various pH values. The location of the absorption bans maxima of dyes are collected in Table 1.
The visible spectra of dyes in aqueous solution show that MB exhibits a main band at 668 nm assigned to the absorp- tion of monomers and associated with a shoulder attributed to the 0 - 1 vibronic transition of monomers MB+ at about 605 nm. However, MG shows two absorption bands in the visible region. The intense absorption band at 617 nm. The second band is in the shorter-wavelength part of the spec- trum at 425 nm and is significantly weaker. The main band is attributed to the absorption of cations monomers (MG+), whereas the second band is assigned to the protonated cations (MG2+H).
The MB monomers have nearly constant absorption bands and absorbance intensities over the pH values in the range of pH between 3 and 13, while the shoulder is most sensitive to the pH solution. The absorbance of the vibronic shoulder at about 605 nm increases and shifts slightly to 624 nm (pH 7), 621 nm (pH 11), and 610 nm (pH 13), whereas no change is observed in 605 nm-shoulder at pH 3, 5 and 9. The in- crease and the bathochromic shift in 605 nm-shoulder are attributed to the partially self-association of MB monomers as cationic dimmers in face-to-face arrangement to minimize their hydrophobic interaction with water.17
For MG dye, the pH has no effect on the absorption band of the both forms of MG dye (MG+ andMG2+H), thus affirm- ing their high stability over the pH range of 3 - 9. In addition, as the pH values increase from 3 to 9, the absorbance inten- sities of MG+ decrease, while those of MG2+H show a dis-
3 3 4 5 6 7 8 9 10 11 12 13
Initial pH
100
90
80
70
60
50
MB
Adsorption percentage (%) MG
Fig. 3. Adsorption percentage of dyes onto clay-Na as a function of pH [MB] = [MG] = 50 mg/L, [Clay-Na] = 0.3 g/L, T = 298 K and contact time of 60 min.
Table 2. The position absorption bands and adsorption percentage of dyes in aqueous solution and adsorbed onto clay-Na as a function of pH for [MB] = [MG] = 50 mg/L, [Clay-Na] = 0.3 g/L , T = 298 K and contact time = 60 min.
Initial pH
MB MG In aqueous solution Adsorbed on clay-Na
Percentage Adsorption
(%)
In aqueous solution Adsorbed on clay-Na
Percentage adsorption
(%)
Species (nm) Species (nm) Species (nm) Species (nm)
MB+ (MB+) 2 MB+ (MB+)2 (MB+) n MG+ MG2+H MG+ MG2+H
3 648 - 658 608 658 81.47 617 424 621 426 95.15
5 668 624 - - 585 89.19 617 425 619 - 97.52
7 647 - - - 588 90.53 617 424 617 426 93.56
9 668 - - - 584 90.81 617 423 631 / 596 - 89.46
11 668 621 - - 567 80.23 Col. Col. Col. Col. -
13 653 610 - - 566 80.46 Col. Col. Col. Col. -
MB+: monomer cation, (MB+)2: dimer including 0-1 vibronic transition of the monomer and (MB+)n: agglomerates, n > 3.
MG+: monomer cation and MG2+H: protonated cation.
Col.: colorless
crepancy. At high alkaline medium (pH > 9) the colorless carbinol base is formed. Such an effect was observed for the similar malachite green,18 methyl green19 and crystal violet.20
On the other hand, the behavior of the bands maxima of MB adsorbed onto clay-Na with the pH is characterized by a hyoschromic shift of the main absorption of MB+ with respect to those in aqueous solutions. The maxima appear at 588 nm (pH 5), 584 nm (pH 7), 567 nm (pH 11) and 566 nm (pH 13). In the most case, this change consists of a sub- stitution of the main absorption bands, which correspond to the absorption of monomers, MB+, by new absorption bands placed at shorter wavelengths,the so-called methachromatic effect. The methachromasy observed in several clay/dye sys- tems been attributed to different phenomena:
(i) an intermolecular interaction between the electro- natic π-system of the dye with the electron lone-pairs of the oxygen atoms at the clay surface
(ii) the self-association of dye molecules when they are adsorbed on the clay surface.
The π-interaction is proposed for clays with partial tetra- hedral substitution of Si+4 by Al+3. Since Clay-Na has this type of substitution, methachromatic effect has to be related to the π-interaction.21
However, the main band of MB+ at pH 3, gradually shifts from 648 nm (in aqueous solution) to longer wavelengths, almost reaching 658 nm (in clay-Na suspension) and the relative intensity of vibronic shoulder (around 605 nm) in- creases. These results are consistent with internally adsorbed MB+ cations and dimerisation, shifting the monomer-dimer equilibrium, when the MB molecules are adsorbed on both in external and in the internal surfaces of the clay-Na.
The results (Table 1) show the slight stability of the main absorption maxima of both forms (MG+ andMG2+H) of MG dye in clay-Na suspension under pH values in the range of 3 - 7. However, the absorption maximum of monomers shift- ed to 631 nm at pH 9 to longer wavelengths with respect to that in aqueous solution. The shift did not exceed 10 nm in the range of pH between 3 and 7, but is significantly higher at pH 9, being 14 nm.
Shift to higher wavelengths of ≈ 10 nm are always ob- served for dye monomers adsorbed at the clay surface. The observed shift can be attributed to the change in the environ- mental polarity/acidity of negatively-charged clay surface with respect to water surrounding, suggesting that the ad- sorption process is instantaneous.22
In addition, this change is accompanied by the appearance of new band at 596 nm placed in shorter wavelengths assigned to an influence on π-orbital. Such influence might
0.00 0.20 0.40 0.60 0.8
m/v (g/L)
100
75
50
Adsorption percentage (%) 25
MB MG
Fig. 4. Adsorption percentage of dyes onto clay-Na onto clay-Na as a function of adsorbent dose on for [MB] = [MG] = 50 mg/L, pH = 7 (MB and MG), T = 298 K and contact time of 60 min.
0 25 50 75 100 125 150
Co (mg/L)
MB MG 100
75
50
Adsorption percentage (%) 25
Fig. 5. Adsorption percentage of dyes onto clay-Na as a function of the initial concentration for [Clay-Na] = 0.3 g/L, pH = 7 (MB and MG), T = 298 K and contact time of 60 min.
Table 3. The adsorption percentages and the amounts of adsorbed dyes onto clay-Na as function of adsorbent doses and initial concentrations for [MB] = [MG] = 20 - 200 mg/L, [Clay-Na] = 0.07 - 0.7 g/L , pH = 7 (MB and MG), T = 298 K and contact time of 60 min.
Experimental parameters
MB MG
Ce
(mg/L)
Qe
(mg/g)
Adsorption percentage (%)
Ce
(mg/L)
Qe
(mg/g)
Adsorption percentage (%)
Adsorbent dose [Clay-Na]
(g/L)
0.07 20.45 340.58 59.55 2.89 244.39 85.54
0.10 13.80 361.97 73.50 1.69 183.08 91.54
0.30 1.38 160.77 98.29 1.38 62.07 93.10
0.50 0.25 99.36 99.63 2.92 34.16 85.39
0.70 0.52 70.48 98.97 5.22 21.12 73.91
Initial concentration
[Dye]
(mg/L)
20 1.37 95.44 97.81 1.43 185.72 92.86
50 1.33 228.90 97.46 1.77 482.32 96.46
70 1.38 162.06 98.29 2.46 675.42 96.49
100 1.42 228.60 97.97 6.42 935.81 93.58
150 5.02 316.61 94.98 23.95 1260.53 84.04
200 18.72 437.61 87.52 24.69 1753.06 87.65
R2: Regression coefficient
be caused by an adjacent platelet, indication flocculation or by the formation of dimers on the surface of the clay-Na.23,24
The effects of initial pH solution on the adsorption rate of dyes onto clay-Na studied over a range of pH values of 3 to 13. The pH significantly affected the adsorption capa- cities of both dyes. As shown in Figure 3, for MB, the dye adsorption increases from 81.47% to 90. 81% with an increase in pH from 3 to 7 and then decreases to 80. 46% at pH = 13, whereas, for MG, the dye adsorption remains almost constant in the range of pH between 3 and 7, and then decreases to 89.46 % at pH 13. The maximum dye ad- sorption of MB (90.81%) and MG (93.55%) are achieved at pH 7. For this reason, for both dyes, the pH 7 is selected for subsequent experiments.
The effect of adsorbent dose on the adsorption percentage of dyes is conducted over a range of adsorbent doses of 0.07 to 0.7 g/L. As elucidated in Figure 4, the percentage of dyes adsorbed increases from 53.55 to 98.28% in MB and from 85.55 to 93.09 % in MG when the adsorbent dose increases from 0.07 to 0.3 g/L for both byes. The adsorption percentage of dyes adsorbed decreases from 93.09 to 73.91%
in MG, while it remains nearly constant in MB with the same adsorbent doses. Increase in adsorption with the sorbent dose can be assigned to increased surface are and the avail- ability of more adsorption sites. In the range of adsorbent doses between 0.3 and 0.7 g/L, the adsorption of MB is con- stant, whereas that of MG decreases. This may be attributed to overlapping of adsorption sites as a result of overcrowding of adsorbent.25 The adsorbent dose of 0.3 g/L for both dyes was used in all other parameter experiments.
Figure 5 illustrates the effect of initial dye concentration
0 10 20 30 40 50 60
Time (min)
175 150
125 100 75
50 25 0
Qe (mg/g)
pH T (oC) Qe (mg/g)
Fig. 6. Adsorption kinetic of MG onto clay-Na for [MG] = 50 mg/L, [Clay-Na] = 0.3 g/L, pH = 7 and 298 k.
0 10 20 30 40 50 60
Time (min)
Qe (mg/g)
175
150 125 100
75 50 25
0
pH T (oC) Qe (mg/g)
Fig. 7. Adsorption kinetic of MB onto clay-Na for [MB] = 50 mg/L, [Clay-Na] = 0.3 g/L, pH = 7 and 298 K.
Table 4. Kinetic parameters of dyes adsorbed onto clay-Na for [MB] = [MG] = 50 mg/L, [Clay-Na] = 0.3 g/L, pH = 7 (MB and MG) and T = 298 K.
Experimental results Pseudo-first order model Pseudo-second order model
System Qmax
(mg/g)
Qe
(mg/g)
K1
(min-1)
R2 (%)
Qe
(mg/g)
K2
(g/mg.min)
R2 (%)
MB/Clay-Na 163.810 6.622 0.055 0.355 166.667 0.001 0.999
MG/Clay-Na 163.011 1.919 0.055 0.36 166.667 0.601 0.999
R2: Regression coefficient
on the percentage of dyes. The percentages of dyes adsorbed are basically unaffected by the dye concentration in the range of 20 to 50 mg/L, and fluctuated between 97.89 and 98.29%
in MB and between 98.43 and 97.81 % in MG. However, when dye concentration increases from 50 to 150 mg/L, the percentages of dyes adsorbed decrease from 98.29 to 87.52%
in MG and from 97.81 to 84.04 % in MG. Decrease in ad- sorption with initial concentration of dyes in due to the dyes agglomeration and the reduction of the thermal mobility of the adsorbed aggregates. So, for both dyes, the initial dye
concentration of 50 mg/L was chosen for the other experi- ments.
The adsorption kinetics of dyes is measured in the range of 0 to 60 min by varying the equilibrium time between adsorbate and adsorbent. The amount of dyes adsorbed, tem- perature and initial pH solution at equilibrium as a function of contact time are illustrated in Figures 6 and 7. The results show that the equilibrium time required for the dyes adsorp- tion onto clay-Na is almost 5 min for both dyes. These results also indicate that the temperature decreases with the amount of adsorbed MB, whereas the pH solution remain practically constant, which can be explained by an endothermic adsorp- tion as a consequence of an exchange phenomenon between organic cations and clay-Na surface.26 However the pH solu- tion and the temperature are unaffected by the amount of adsorbed MG, which deduce the phenomenon of physis- orption.27 The kinetic adsorption data illustrated in Figures 5 and 7 were treated with a pseudo-first order and pseudo- second order model.
The pseudo-first order equation of Lagergren28 is gene- rally expressed as follows Eq. (3):
dQt/dt = k1(Qe - Qt) (3)
where Qe and Qt are the amount of malachite green adsorbed per unit weight of adsorbent at equilibrium and at any time t (mg/g) respectively and K1 is the rate constant for adsorp- tion of dye (1/min). At given boundary conditions for t = 0, Qt = 0, the equation Eq. (3) can be integrated to give Eq. (4):
log10 (Qe - Qt) = log10 Qe - (K1/2.303) t (4) The values of k1 were calculated from the slopes of the respective linear plots of log (Qe - Qt) versus t (Figure 8).
The regression coefficients, R2, (given in Table 4) for the pseudo-first-order model did not exceed the values of 0.36 for both dyes respectively. The calculated Qe values obtained from pseudo-first-order kinetic model were much different compared with experimental Qexp values. These results su-
0 10 20 30 40 50 60
Time (min)
t/Qe (min, g/mg)
0.400 0.350 0.300 0.250 0.200 0.150 0.100 0.050 0.000
MB MG
Fig. 8. Pseudo-second order plots of the kinetics of dyes onto clay-Na for [MB] = [MG] = 50 mg/L, [Clay-Na] = 0.3 g/L, pH = 7 (MB and MG), T = 298 K and contact time of 60 min.
0 3 6 9 12 15 18 21 24
Ce (mg/L)
Qe (mg/g)
450
375
300
225
150
75
0
MB MG
Fig. 9. Adsorption isotherm of dyes onto clay-Na for [MB] = [MG] = 5 - 150 mg/L, [Clay-Na] = 0.3 g/L, pH = 7 (MB and MG), T = 298 K and contact time of 60 min.
ggest that the adsorption processes of MB as well as MG do not follow the pseudo-first-order adsorption rate equation of Lagergren.
The sorption kinetics following pseudo-second order model given by Ho29 is represented in the form Eq. (5):
dQ/dt = K2 (Qe - Q)2 (5)
where Q and Qe represent the amount of dye adsorbed (mg/g) at any time t; K2 is the rate of sorption (g/mg.min) and Qe
the amount of dye adsorbed onto clay-Na at equilibrium (mg/g). Separating Eq. (6), gives:
dQ/(Qe - Q)2 = K2 dt (6)
Integrating Eq. (5) with respect to the boundary condi- tions Q = 0 at t = 0 and Q = Q at t = t, the linearised form of pseudo second order expression can be obtained as Eq. (7):
1/(Qe - Q) = 1/Qe + K2t (7)
Equation (7) can be further linearised to Eq. (8) :
t/Qt = 1/K2Qe2 + t/Qe (8)
The straight lines for all initial concentrations of the plots of t/Qt versus t (Figure 8 and Table 4) with extremely high regression coefficients (0.999) for the pseudo-second-order kinetic model compared to those for the pseudo-first-order strongly suggest that all the adsorption systems are a pseudo- second-order model, based on the statement that the rate- limiting step may be chemisorptions involving valency forces through sharing or exchange of electrons between the hydro- philic edge sites of clay-Na and polar dye ions.30 The mea- sured Qe values obtained from pseudo-second-order kinetic model were close to the experimental Qexp data.
Figure 9 displays the results of the adsorption isotherms of dyes. The adsorption of both dyes forms a typical Lang- muir-type isotherm according to Giles classification sys- tem.31 The maximum adsorption capacities of dyes were 437.61 and 420.18 mg/g for MB and MG respectively. It indicates that the adsorption seems to favor the dye MB slightly than MG. This behavior of preferential adsorption can be explained in point of view of structures and mole- cular weight of the dyes (MB = 319.5 g/mole and MG = 507.51 g/mole). The MB with one weaker size and molecular weight will compete with faster for the actives sites than MG.
Langmuir32 and Freundlich33 and Dubini-Radushkevich34
(D-R)isotherms were applied to assess the performance of the adsorption process of MB and MG dyes onto clay-Na.
The Langmuir adsorption isotherm assumes that adsorp- tion takes place at specific homogenious sites within the adsorbent and has found successful application in many ad- sorption processes of monolayer adsorption. The linear form of the Langmuir isotherm equation is represented by the following equation Eq. (9):
Ce/Qe = 1/(KLQmax) + Ce/Qmax (9) where Qmax (mg/g) is the maximum amount of the dye per unit weight of clay-Na to form a complete monolayer co- verage on the surface bound at high equilibrium dye con- centration Ce, and KL is the Langmuir constant related to the free energy of adsorption (L/g). The plots of Ce/Qe versus Ce for the adsorption of MB and MG onto clay-Na (Figure 10) give a straight line of slope of 1/Qmax and intercept 1/QmaxKL.
0 5 10 15 20 25
Ce (mg/L)
BM VM 0.06
0.05
0.04
0.03
0.02
0.01
0.00
Ce/Qe (g/L)
Fig. 10. Langmuir isotherm of dyes onto clay-Na for for [MB] = [MG] = 5 - 150 mg/L, [Clay-Na] = 0.3 g/L, pH = 7 (MB and MG), T = 298 K and contact time of 60 min.
-0.2 0 0.2 0.4 0.6 0.8 1 1.2 1.4
Log (Ce)
3.00
2.50
BM VM
Log (Qe)
1.50
1.00
0.50
0.00
Fig. 11. Freundlich isotherm of dyes onto clay-Na for for [MB] = [MG] = 5 - 150 mg/L, [Clay-Na] = 0.3 g/L, pH = 7 (MB and MG), T = 298 K and contact time of 60 min.
ε2
-2
-3
-4
-5
-6
-7
MB MG 0 20 40 60 80 100 120
ln (Qe)
Fig. 12. D-R isotherm of dyes onto clay-Na for for [MB] = [MG] = 5 - 150 mg/L, [Clay-Na] = 0.3 g/L, pH = 7 (MB and MG), T = 298 K and contact time of 60 min.
The essential features of the Langmuir isotherm35 can be expressed by means of KR, a dimensionless constant referred to as separation factor or equilibrium parameter which is calculated by relationship Eq. (10):
KR = 1/(1 + KL Co) (10)
where KL is the Langmuir constant (L/mg) and Co is the highest initial dye concentration (mg/L). The value of KR
indicates the type of the isotherm to be either unfavorable (KR > 1), linear (KR = 1), irreversible (KR = 0) or favorable (0 < KR < 1).
The Freundlich isotherm is an empiric equation employed to describe heterogeneous systems. The logarithmic form of the Freundlich equation Eq. (11) is:
lnQe = lnKF + (1/n) lnCe (11) where KFe and n are Freundlich adsorption isotherm con- stants (L/mg), being indicative of the extent of the adsorption and the degree of nonlinearity between solution concentra- tion and adsorption, respectively. The values of Freundlich constants (KF and n) were calculated from the plots (Figure 11) of lnQe against lnCe.
The Dubini-Radushkevich (D-R) isotherm is more general than the Langmuir isotherm because it does not assume a homogenous surface or constant adsorption potential. It was applied to distinguish between the physical and chemical adsorption of dye. The linear D-R isotherm can be repre- sented in the form Eq. (12):
lnQe = lnQm - KDR ε2 (12)
where KDR is related to the mean free energy of adsorption per mole of the adsorbate (mol2/kj2), Qm is the theoretical saturation capacity (mg/g), and ε is the Polanyi potential, which is defined by Eq. (13):
ε = RTln (Co/Ce) (13)
where R is the gas constant (j/mol.k) and T is the absolute temperature (K). Hence the D-R plots (Figure 12) lnQe
against ε2 indicates a straight line with a regression coeffi- cient (R2) of > 0.98. The values of KDR and Qm evaluated from the slopes and intercepts of these plots are listed in Table 5.
The constant KR gives an idea about the mean free energy of adsorption (Ea) when one mole of the ion is transferred to the surface of the adsorbent from the infinity in the solu-
Table 5. Isotherm parameters of dyes adsorbed onto clay-Na for [MB] = [MG] = 5 - 70 mg/L, [Clay-Na] = 0.3 g/L, pH = 7 (MB and MG), T = 298 K and contact time of 60 min.
Experimental results
Langmuir model Ce/Qe = 1/(KLQmax) + Ce/Qmax
Freundlich model Ln(Qe) = Ln(KF)+1/n)Ln(Ce)
Dubini-Radushkevich model lnQe = lnXm-KDR ε2 System Qexp.
(mg/g) Qmax
(mg/g) KL
(L/g) KR R2
(%)
KF
(L/g) 1/n R2
(%)
Qm
(mg/g) KDR
(mol2/kj2) Ea (kj/mol)
R2 (%) MB/Clay-Na 437.612 500 0.500 0.013 0.994 147.908 0.422 0.856 4.388 0.035 3.779 0.985 MG/Clay-Na 420.176 500 0.333 0.019 0.991 119.949 0.467 0.855 38.939 0.076 2.564 0.982 R2: Regression coefficient
tion and it can be computed using the following relation- ship35 Eq. (14):
Ea = (-2KDR)-1/2 (14)
The mean energy provides information about adsorption mechanism is physical adsorption (0 < Ea < 8 kj/mol) or chemisorptions36 (20 < Ea < 40 kj/mol).
Parameters of Langmuir, Freundlich and D-R plots of dyes adsorption onto clay-Na were shown in Table 5. The Langmuir monolayer capacity Qmax was 500 mg/g for both dyes. The high values of regression coefficients, R2, (0.994 and 0.991 for MB and MG respectively), suggesting that the adsorption of MB as well as MG onto clay-Na closely follow a Langmuir isotherm. The high fit to the Langmuir model for both dyes suggests that the adsorption is limited with monolayer coverage. The values of RL obtained were 0.013 and 0.019 for MB and MG respectively. As the KR
values lie between 0 and 1, the on-going adsorption process is favorable.
The numerical value of the apparent free energies Ea
from D-R model resulted as 3.779 and 2.564 kj/mol for MB and MG respectively, indicates that the adsorption process is physisorption.
CONCLUSION
In the present study, Maghnia clay deposits was selected as a local, cheaper and readily available adsorbent for the removal of Methylene blue and Malachite green oxalate dyes from the aqueous solutions. Adsorption of the dyes was investigated under various experimental conditions by batch technique. The optimal pH for favorable adsorption of MB and MG dyes was 7. The percentages of dyes adsorbed increased then reached maximum values as the sorbent dose was increased, while the ratios of dyes adsorbed decreased as the initial concentration was increased. The maximum adsorption of both dyes (> 90%) in aqueous solutions were
achieved within 60 min by using 0.03 g of clay-Na. For the adsorption of both MB and MG dyes, chemical reaction seems significant in the rate-controlling step and the pseudo- second-order chemical reaction kinetics provide the best correlation for the experimental data .The isothermal data fitted the Langmuir and D-R models. The numerical value of the mean free energies Ea from D-R model (3.779 and 2.564 kj/mol for MB and MG respectively), corresponds to physisorption process.
Acknowledgment. The authors thank U. S. T. MB Uni- versity and the University DR T. M. for materially supporting this research.
REFFERENCES
1. Then, B. K. G. Adam. Higle. London, 1974.
2. Margulies, L.; Rozen, H.; Cohen, E. Nature. 1985, 315, 658.
3. Dale Ortego, J.; Kowalska, M.; Coke, D. L. Chemosphere.
22, 1991; pp 769-798.
4. Srinivasan, K. R.; Fogler, H. S. Clays minerals. 1990a, 38, 277.
5. Murray, H. H. Overview. Clay minerals application. Appl. Clay.
Sci. 1991, 5, 379.
6. Rabek, J. F., Ed.; CRC Press: Florida, Vols. I and III, 1990.
7. Dusart, O.; Serpaud, B. La tribune de l’eau. 1991, 44, 554; pp 15-22.
8. Linsheng, Z.; Dobias, B. Water Treatment. 1992, 7, 221-232.
9. Ciardelli, G.; Corsi, L.; Marucci, M. Resour. Conserv. Recy.
2000, 31, 189-197.
10. Paprowicz, J.; Slodezyk, S. Env. Tech. Let. 9 1988; pp 271-280.
11. Milano, J. C.; Loste-Berdot, P.; Vernet, J. L. Environ. Techn.
1994, 16, 329-341.
12. YENER, J.; KOPAC, T.; DOGU, Dogu, T. Journal Mortland M. M. adv. Agr. 1970; pp 22-75.
13. Schoonheydt, R. A. Mineral surfaces. D. J. Vanghen and R.
A. D Pattrick, Eds.; Chpman-hall: London, 303, 1995.
14. Meifang, H.; Beiyan, M.; Fangbai, L. et al. Geology-Geoche- mistry 2003, 30(1), 70-73.
15. Pavan, P. C.; Crepaldi, E. L.; Valim, J. B. Journal of Colloid and Interface Science 2000, 229, 346-352.
16. Bergman, K.; O’Konski, C. T. J. phys. Chem. 1963, 67, 2169.
17. Rytwo, G.; Nir, S.; Crespin, M.;. Margulies, L. Journal of Col-
loid and Interface Science 2000, 222, 12-19.
18. Yariv, S. Personal Communication 1998.
19. Keusch, P. Crystal Violet - a pH Indicator 2009.
20. Yariv, S. Int. Rev. Phys. Chem. 1992, 11, 345.
21. Coine, A. P. P.; Neumann, M. G.; Gessner, F. Journal of Col- loid and Interface Science 1998, 198, 106-112.
22. Yariv, S.; Ghosh, D. K.; Heple, L. G. J. Chem. Soc. Faraday Trans. 1991, 87, 1201.
23. Dobrovska, C.; Hepler, L. G.; Ghosh, D. K.; Yariv, S. J. Ther- mal Ana. 1991, 37, 1347.
24. Namasivayam, C.; Prabba, D.; Kumutha, M. Bioresour. Tech- nol. 1998, 48, 79-81.
25. Bouabdesselam, H. Asian Journal of Chemistry. Vol. 17, No.
4, 2005; pp 2289-2290.
26. Bouabdesselam, H.; Meddah, S.; Bouzidi, Y.; Bourg, D. Asian
Journal of Chemistry. Vol.17, No 4, 2005; pp 2291-2299.
27. Lagergren, S. Kungl. Sv. Vetensk. Handl. 1898, 24, 1-39.
28. Ho, Y. S.; Mckay, G. A. Resources, Conservation and Recycling Vol. 25, No. 3, March 1999; pp 171-193.
29. Ho, Y. S.; Mckay, G. Process biochem. 1999, 34, 451-565.
30. Giles, C. H.; Mac Ewan, T. H.; Nakhwa S. N.; Smith, D. J.
Chem. Soc. 1960, 3973.
31. Langmuir, I. J. Phys. Chem. 1918, 40, 1.
32. Freundlich, H. F. M. J. Phys. Chem. 1906, 57, 385-470.
33. Dubinin, M. M.; Radushkevich, L. V. 55. Physical Chemestry Section, USSR 1947; pp 331-333.
34. Hall, K. R.; Eagleton, L. C.; Acrivos, A.; Vermeulen, T. Ind.
Eng. Chem. Fundam. 1966, 5, 212-223.
35. Hobson, J. P. J. Phys. Chem. 1969, 73, 2720.
36. Helferrich, F. McGraw Hill, New York, NY, 1962.
![Fig. 2. The position of absorption bands maxima of dyes in aque- aque-ous solution and adsorbed onto clay-Na as a function of pH for [MB] = [MG] = 50 mg/L, [Clay-Na] = 0.3 g/L , T = 298 K and con-tact time = 60 min.](https://thumb-ap.123doks.com/thumbv2/123dokinfo/5299633.154715/3.892.84.432.172.360/position-absorption-bands-maxima-solution-adsorbed-function-clay.webp)
![Table 2. The position absorption bands and adsorption percentage of dyes in aqueous solution and adsorbed onto clay-Na as a function of pH for [MB] = [MG] = 50 mg/L, [Clay-Na] = 0.3 g/L , T = 298 K and contact time = 60 min.](https://thumb-ap.123doks.com/thumbv2/123dokinfo/5299633.154715/4.892.86.809.854.1065/position-absorption-adsorption-percentage-solution-adsorbed-function-contact.webp)
![Table 3. The adsorption percentages and the amounts of adsorbed dyes onto clay-Na as function of adsorbent doses and initial concentrations for [MB] = [MG] = 20 - 200 mg/L, [Clay-Na] = 0.07 - 0.7 g/L , pH = 7 (MB and MG), T = 298 K and contact time of 60](https://thumb-ap.123doks.com/thumbv2/123dokinfo/5299633.154715/5.892.91.809.828.1091/adsorption-percentages-amounts-adsorbed-function-adsorbent-concentrations-contact.webp)
![Fig. 6. Adsorption kinetic of MG onto clay-Na for [MG] = 50 mg/L, [Clay-Na] = 0.3 g/L, pH = 7 and 298 k](https://thumb-ap.123doks.com/thumbv2/123dokinfo/5299633.154715/6.892.99.409.366.576/fig-adsorption-kinetic-mg-clay-na-mg-clay.webp)
![Fig. 9. Adsorption isotherm of dyes onto clay-Na for [MB] = [MG] = 5 - 150 mg/L, [Clay-Na] = 0.3 g/L, pH = 7 (MB and MG), T = 298 K and contact time of 60 min.](https://thumb-ap.123doks.com/thumbv2/123dokinfo/5299633.154715/7.892.468.782.453.668/fig-adsorption-isotherm-dyes-clay-clay-contact-time.webp)
![Fig. 12. D-R isotherm of dyes onto clay-Na for for [MB] = [MG] = 5 - 150 mg/L, [Clay-Na] = 0.3 g/L, pH = 7 (MB and MG), T = 298 K and contact time of 60 min.](https://thumb-ap.123doks.com/thumbv2/123dokinfo/5299633.154715/8.892.103.410.804.1028/fig-isotherm-dyes-clay-clay-contact-time-min.webp)
![Table 5. Isotherm parameters of dyes adsorbed onto clay-Na for [MB] = [MG] = 5 - 70 mg/L, [Clay-Na] = 0.3 g/L, pH = 7 (MB and MG), T = 298 K and contact time of 60 min.](https://thumb-ap.123doks.com/thumbv2/123dokinfo/5299633.154715/9.892.85.808.189.314/table-isotherm-parameters-dyes-adsorbed-clay-clay-contact.webp)
