Printed in the Republic of Korea DOI 10.5012/jkcs.2010.54.01.043
요약. p-페닐렌 디아민과 maleic anhydride, 아세틸 아세톤과 커플된 O-아미노 페놀의 아조화합물으로 부터 폴리이미드가 만들 어졌다. 합성된 폴리이미드(PA)는 DMF용매 속에 다른 몰비율로 녹아있는 Co+2, Cr+2, Ni+2, Cu+2, Zn+2, Cd+2 and Fe+3 를 포함하는 전이금속이온들의 금속염들과 함께 환류되었다. 이 complex들은 원소분석과 열분석, IR, 1H NMR으로 구조분석, 특성 연구되었다.
주제어: 고분자 complex, 전이금속, 검출, 분리
ABSTRACT. Polyamide derived from azo compound of o-amino phenol coupled with acetyl acetone, maleic anhydride acid and p-phenylene diamine were prepared. The prepared polyamide (PA) was refluxed with metal salts of transition metal ions include, Co+2, Cr+2, Ni+2, Cu+2, Zn+2, Cd+2 and Fe+3 in dimethyl formamide (DMF) in different molar ratios. These complexes were characterized and identified by elemental and thermal analysis, IR, 1H NMR spectra. The data showed that PA ligand coordinates with metal ions in abidentate manner through donating N=N and O-H groups. The metal ions are surrounded by coordinated water molecules and anions to establish the geometrical structure of the complexes. The thermal analysis degradation at different temperatures explained the weight loss of hydrated water and the decompositions of complexes until a constant weight loss of metal oxides is obtained.
Keywords: Polymer complex, Transition metal, Detection, Isolation
몇 개의 전이금속 이온과 고분자와 고분자 Complex의 합성과 특성연구
S. K. Badr* and T. Y. Mohamed
Chemistry Department, Faculty of Science , Benha University, Benha, Egypt (접수 2009. 8. 11; 수정 2009. 12. 7; 게재확정 2010. 1. 18)
Synthesis and Characterization of Polymer and Polymer Complex with Some Transition Metal Ions
S. K. Badr* and T. Y. Mohamed
Chemistry Department, Faculty of Science , Benha University, Benha, Egypt.
*E-mail: [email protected]
(Received August 11, 2009; Revised December 7, 2009; Accepted January 18, 2010)
INTRODUCTION
In recent years much emphasis have been given to the synthesis of polymers containing chromophoric groups. For example, the aromatic azo group which can form a part of the main chain.1 The aromatic azo group is of special interest because of the existence of cis-trans isomerism and its effect on the photochromic properties of the polymers.2-4 Therefore, polymers that contain the azo group have potential use in a variety of application.5-8 The chelate-forming polymeric ligands have been extensively studied by several authors.9,10 Such li- gands are characterized by the presence of reactive functional groups of O, N, S and P in the polymer matrix capable of co- ordinating to different metal ions. Moyers and Fritz11 condensed m-phenylenediamine tartaric acid with resorcinol and form- aldehyde to get a resin containing two imino-diacetic acid func- tional groups anchored to benzene ring and used the resin to separate Co(II) from Ni(II) in a gravity flow column.
Schiff bases having multidentate coordination sites are known to form complexes with transition metal ions readily.12-17 Present
in a polymeric matrix, they are expected to show affinity and selectivity towards these metal ions at an appropriate pH. This lead us to synthesize a number of phenolic Schiff bases by condensing several aliphatic and aromatic diamines with phe- nolic carbonyls, or conversely, dicarbonyls with aminophenols.
These Schiff bases were found to undergo condensation poly- merization readily with formaldehyde and furfuraldehyde. In the reaction conditions set for polycondensation, the C=N bond of the Schiff bases did not undergo hydrolytic cleavage.
The aim of the work to prepare a new chelating copolymers containing azo group units as ligating centers with different molar ratios of metal ions, the formed polymer complexes were examined by using IR, and thermal analysis and also by using the atomic absorption spectrophotometer to determine the metal ion content in the solution of the dissolved polymer complex, from these analysis the stability of complexes were identified.
Measurements
Reagent grade chemicals were used. Elemental analysis was determined by the analytical unit of Cairo University of Egypt.
NH2 OH
+ NaNO2 HCl -5 OC
N OH N Cl
N OH N Cl +
CH2 C CH3 O H3C C
O
+ NaOH - HCl
CH C
CH3 O H3C C
O
N OH N
-5 oC
Scheme 1. Preparation of acetyl acetone Azodye
NH2
H2N + C
HC CH C O O O
NH
H2N C
O CHC
HCOH
N H
N H
CH C CH3
O H3C C
O
N OH N
n +
NH
N C
O CHC
HC O
O Hn C
CH3
C CH H3C
N
N OH N NH
H
140 -160 oC (3hrs)
160-200 oC (3hrs)
Scheme 2. Polyamide Preparation
Atomic absorption spectrophotometry Perkin Elmer A. Analyst 100 was used to determine the metal ion content. IR-spectra and Jasco FT/IR 46 Plus 200 - 4000 cm-1 a Perkin Elmer spectro- photometer (400 - 4000 cm-1). Thermal analysis Shimadzu:
Thermogravimetric analyzer TGA sec. (DTA) and TGA) was carried out in the temperature rate 10 oC/min. in the range 27
oC - 700 oC. 1H NMR spectrum of polyamide was recorded in d6-DMSO using TMS as internal standard by avarian Gemini spectra photometer operating at 200 MHz.
All metal-complexes were dried in Vacuo oven at 40 oC.
MATERIAL AND METHODS
Acetyl acetone (BDH chemicals Ltd), sodium nitrite, o-amino phenol (Fluka), maleic anhydride (Oxford Lab. Mumbai), p-phe- nylene diamine (Fluka), chloride salt of ferric, cadmium, chro- mium, cobalt, and sulphate of nickel, zinc and lead acetate are in pure grade of national companies as aldrish, sigma and Fluca and are used as it received.
Experimental
Preparation of Azo dye. A mixture of O-amino phenol (0.02 mol) was dissolved in concentration hydrochloric acid 37%
(4.8 mL) then cooled to -5 oC. Sodium nitrite (1.8 gm, 0.022 mol) was dissolved in 20 mL distilled H2O and slowly added with continuous stirring over 15 min (Diazotization and coupl- ing methods according to the general methods).18 The diazo- nium salt was coupled with alkaline acetyl acetone (0.02 mol) solution and stirred in ice bath for 6 hrs. The prepared azo dye (Azo Ac) were filtered and washed several times with distilled water and dried in an vacuum oven at 60 oC for 4 hrs. and recrystalized from hot ethanol and then precipitated.
Preparation of polyamide. The polyamide was prepared by melt condensation of diamine p-phenylene diamine (0.1 mol) and maleic anhydride (0.05 mol) and a few drops of trimethyl amine as a basic catalysis19 in step (I) at temperature range 140 - 160 oC (3 hrs). In the step (II) azo acetate (0.05 mol) was added and temperature raised gradually 160 - 200 oC. The reaction was carried in three necked flask dipped in an oil bath (thermally controlled) provided with mechanical stirrer and deen stark trap to collect, the water produced. A pipette was inserted through a stopper down to the flask to introduce a slow stream of dry deoxygenated nitrogen gas in order to facilitate the removal of water produced. When the reaction is completed the polyamide (PA) was dissolved in DMF then precipitate into large amount of petroleum ether 40 - 60 then collected and dried in a vacuum oven at 40 oC for about 6 hrs.
Preparation of polyamide metal ion complexes. The poly- amide (PA) complexes were synthesized19 by refluxing a cal- culating amount of the polyamide (0.01 mol) and (0.01 mol) of lead acetate with (0.01 mol) of different metal ions Fe+3, Cr+3, Ni+2, Cd+2, Co+2, Cu+2, Zn+2 gradually in DMF for about 4 hrs. The solution is then allowed to cool and an excess distilled water acidified with HCl was added where the solid complexes were precipitated, filtered off and dried in a vacuum oven at 40 oC for 3 hrs.
Measurements
Characterization of polymer.
Determination of acid value (AV): The weighted sample of
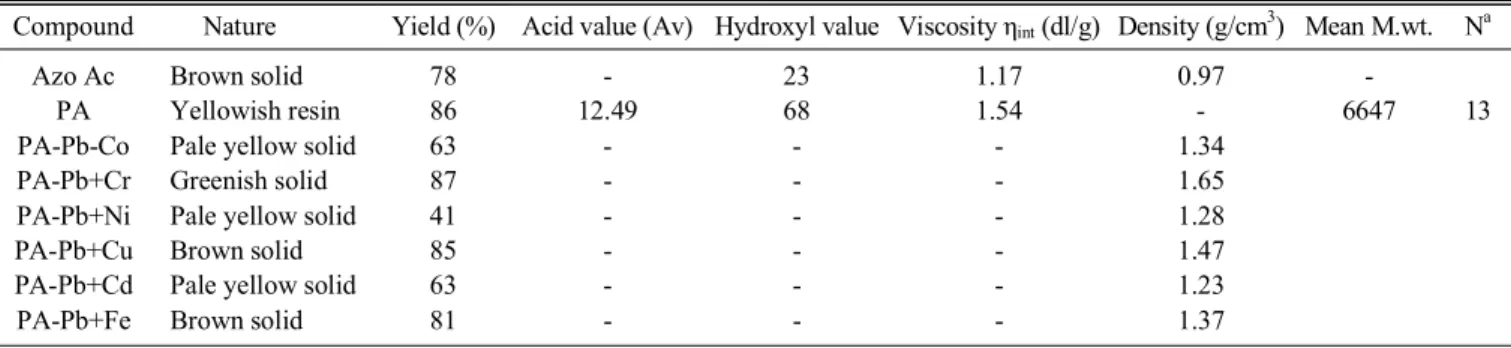
Table 1. Physical properties of polymer and polymer complex
Compound Nature Yield (%) Acid value (Av) Hydroxyl value Viscosity ηint (dl/g) Density (g/cm3) Mean M.wt. Na
Azo Ac Brown solid 78 - 23 1.17 0.97 -
PA Yellowish resin 86 12.49 68 1.54 - 6647 13
PA-Pb-Co Pale yellow solid 63 - - - 1.34
PA-Pb+Cr Greenish solid 87 - - - 1.65
PA-Pb+Ni Pale yellow solid 41 - - - 1.28
PA-Pb+Cu Brown solid 85 - - - 1.47
PA-Pb+Cd Pale yellow solid 63 - - - 1.23
PA-Pb+Fe Brown solid 81 - - - 1.37
aWhere N: Degree of polymerization.
copolymer is placed in conical flask dissolved in DMF and titrated with (0.05 N) alcoholic KOH using phenolphthaline indicator till the end point and calculate AV according to the equation:
AV = weightNxVxof56sample.11 (1)
where: N: The normality of KOH V: The volume of KOH
Determination of hydroxyl value: 3 gm of sample is placed in Erlenmeyer flask and exactly 20 mL of acetylating mixture (1 volume of acetic anhydride 3 volume of pyridine) were reflux- ed for 30 min. A blank determination is carried out at the same time. The flask was cooled by cold distilled water (50 mL) and the free acetic acid titrated with 1 N NaOH then the hydroxyl value calculated by the standard methods.20
Viscosity measurements: The viscosities were determined by Ostwald21 viscometer at six different concentrations ranged from 0.5 to 3.0% of the copolymer in DMF at 33 oC. The intrinsic viscosity (η) was calculated using Huggins equation [eq. (1)]22 and Krammer equation [eq. (2)].23
ηSp/C = [η] + k1[η]2C (2)
Ln ηrel/C = [η] – k2 [η]2C (3) where C is the concentration (g/100 mL), η rel is the ratio of the viscosity of the solution (η) to the viscosity of the solvent (η o) (η rel = η / η o) and η sp is a function derived from η rel. The rela- tive viscosity (η sp = η - η o/ η o = η / η o-1 = (η rel)-1]. k1 and k2 are constants for a given polymer/solvent temperature system.
RESULTS AND DISCUSSION Physical properties of prepared polyamide
The physical properties of the prepared polyamide (PA)
and polyamide complex with different metal ions were listed in Table 1. The data indicate that the prepared polyamide (PA) yellowish and mean molecular weight (M.wt.) 6647 and degree of polymerization (N) about 13 unit. This mean that the prepared polyamide (PA) have medium molecular weight with repeating unit have functional group used to form chelating polymer with different metal ions with different ratios and repeating unit have degree of conjugation help to form stable polyamide complex.
The data also indicate the measurement of density which range between 0.97 - 1.65 gm/cm3. From Table 1 the measurement of hydroxyl value (OH value) of Azo Ac and polyamide (PA) were found to be 23, 68 respectively.
Viscometric measurements were carried out in a DMF at 33
oC with Ostwaled viscometer.21 The reduced viscosity (η rel) versus the concentration (0.5 - 3.0%) was plotted for the set of data. (η) was determined from corresponding linear plots. Equ- ations (1) and (2) were used to determine the Huggin22 and Krammer23 constants, respectively. As η rel is dependent on the concentration of the polymer sample, it is necessary to extra- polate a plot of η rel against the polymer concentration (C) to the zero concentration to get [η], which is characteristic para- meter of a polymer. Hence [η] is given in equations (5) and (6) as follows:
[η] = (η sp/C)C → 0 (4)
or
[η] = (ln η rel/c)C → 0 (5)
According to this relation, the plots of η SP/C and Ln η rel/C against C were linear with slops of K1 and K2, respectively.
The intercept on the viscosity function axis gave the [η] value in both plots. The calculated values of constants k1 and k2
satisfy the relation k1 + k2 = 0.5 favorably,31 and this indicates that the solvent used or the viscosity measurement was of good quality; [η] for the polyamide were show in Table 1. The data of viscosity measurements show relative increase in polymer than monomer which related to the increase of hydrogen bond and also to use of aromatic amine.
Table 2. Elemental analysis of complexes by using AAS Complex
PA-Pb-Co
Complex PA-Pb-Cr
Complex PA-Pb-Ni
Complex PA-Pb-Cu
Complex PA-Pb-Cd
Complex PA-Pb-Fe
%Co %Pb %Cr %Pb %Ni %Pb %Cu %Pb %Cd %Pb %Fe %Pb
Calc.
(found)
Calc.
(found)
Calc.
(found)
Calc.
(found)
Calc.
(found)
Calc.
(found)
Calc.
(found)
Calc.
(found)
Calc.
(found)
Calc.
(found)
Calc.
(found)
Calc.
(found) 8.75
(9.0)
29.48 (28.6)
7.48 (7.2)
29.78 (28.1)
7.48 (6.87)
29.7 (27.3)
8.48 (8.2)
29.29 (27.6)
14.8 (14.3)
27.4 (26.9)
8.1 (8.8)
29.6 (29.2)
Table 3. C, H, N analysis of the complexes
Complex % C % N % H
Calc. Found Calc. Found Calc. Found PA [Pb-Co] 30.77 31.88 11.90 10.80 3.41 3.76 PA [Pb-Fe] 30.90 29.80 12.00 11.20 3.43 3.00 PA [Pb-Ni] 30.77 31.06 11.90 11.10 3.41 3.25
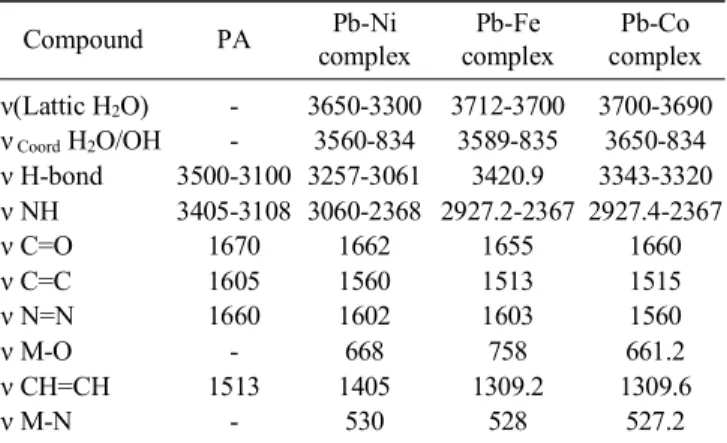
Table 4. IR spectra (assignments) of azo PA and its metal complexes
Compound PA Pb-Ni
complex
Pb-Fe complex
Pb-Co complex ν(Lattic H2O) - 3650-3300 3712-3700 3700-3690 ν Coord H2O/OH - 3560-834 3589-835 3650-834 ν H-bond 3500-3100 3257-3061 3420.9 3343-3320 ν NH 3405-3108 3060-2368 2927.2-2367 2927.4-2367
ν C=O 1670 1662 1655 1660
ν C=C 1605 1560 1513 1515
ν N=N 1660 1602 1603 1560
ν M-O - 668 758 661.2
ν CH=CH 1513 1405 1309.2 1309.6
ν M-N - 530 528 527.2
4000 3500 3000 2500 2000 1500 1000 500
Wavenumber (cm-1)
Transmittance
Fig. 1. (a) IR Spectra of PA. (b) IR Spectra of PA (Pb + Fe) Complex.
Elemental analysis of the complexes
By dissolving 0.1 gm of the complex in diluted HCl and com- pleted the solution till 50 mL measuring flask by distilled water.
The metal content was recorded in Table 2. Also, the micro analysis of C, H, N of the complexes were recorded in Table 3 it was found that the amount of metals which are introduced to forming a complex was in molar ratio 2:1 metal:ligand (M:L) or 1:1:1 (M:L:M), these metals could bonded to the ligand to form a complex and the results indicated the presence of the two metals which are bonded to the center of chelation as shown in Table 2.
Also, the results in Table 3 confirmed the composition of the complex and its molecular formula due to the presence of the two metals coordinated in the center of chelation by the chemical bonds.
IR Spectra. The bonding of the ligand to the metal has been deduced from IR spectra. The characteristic bands of the ligand and metal complexes were presented in Table 4. The IR
spectra of the ligand shows abroad medium bands in the 3505 - 3200 cm-1 ranges, attributed to intramolecular hydrogen bonding between OH and C=O groups in the same molecule and also NH groups24 Fig. 1.
The bands at 3407 - 3110 and 1605 cm-1 are assigned to secon- dary ν(NH), νC=O, bands at 1513 and 1326 cm-1 correspond to ν(CH=CH)AL and νC-O respectively.25
The complexes show broad band from lattice water at 3650 - 3300 for (Pb-Ni) complex. Coordinated water appears at 3960 cm-1. While for (Pb-Fe) complex coordinated water appears at 3589 cm-1 which for (Pb-Co) complex appeared at 3650 cm-1. The complexes show bands between 3060 - 2368, 2927 - 237 and 2927.4 - 2367 cm-1 which are attributed to ν (NH), Table 4.
Also, bands appeared at 1662, 1655 and 1660 cm-1 assigned to (Pb-Ni)-PA, (Pb-Fe)-PA, (Pb-Co)-PA complexes these bands shows a shift than the bands of the ligand only.
Also, bands appeared at 1602, 1603, 1560 cm-1 for complexes in the same order due to νN=N group, Table 4, bands appeared at 1405, 1309 and 1310 for νCH=CH of the complexes, while bands appeared at 668, 758 and 667.2 cm-1 due to frequencies of M-O bond, νO-H groups appeared at the range of 850 - 833 cm-1, due to bridging H-bonds in the molecule.
The 1H NMR of ligand PA polymer show bands (3H-CO-
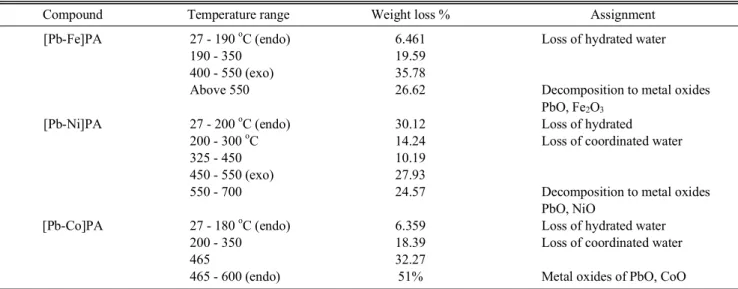
Table 5. Thermal data for the metal complexes
Compound Temperature range Weight loss % Assignment
[Pb-Fe]PA 27 - 190 oC (endo) 6.461 Loss of hydrated water
190 - 350 19.59
400 - 550 (exo) 35.78
Above 550 26.62 Decomposition to metal oxides
PbO, Fe2O3
[Pb-Ni]PA 27 - 200 oC (endo) 30.12 Loss of hydrated
200 - 300 oC 14.24 Loss of coordinated water
325 - 450 10.19
450 - 550 (exo) 27.93
550 - 700 24.57 Decomposition to metal oxides
PbO, NiO
[Pb-Co]PA 27 - 180 oC (endo) 6.359 Loss of hydrated water
200 - 350 18.39 Loss of coordinated water
465 32.27
465 - 600 (endo) 51% Metal oxides of PbO, CoO
CH3) at δ 2.5, 1H (CH-N=N) δ 2.1, 2H (CH2-CO) at δ 2.5, 1H (CH-N=N) δ 3.6, 2H (CH2-CH-) δ 3.4, 2H (CH=CH) at δ 5.2, δ 6.6, 1H (OH-Ar) at δ 4.9, (11H) with interference aromatic protons at δ 7.4-7.7, 3H (NH) band at δ 9.8-10.4, 1H (COOH), δ 11.4.
From the previous data, the suggested structure of the pre- pared complexes as follows:
CH C CH3 C O
H3C N
N O
N Co
Pb H2O
Cl Cl OH2
)
NH H(
Structure of PA (Pb-Co) - complex
Thermal analysis. Thermal analysis curves DTA, TGA, show an endothermic peaks within the temperature range 27 - 190 oC corresponding to the complexes26 firstly for (Pb-Fe) complex an endothermic peaks are appeared with weight loss (6 - 41%) due to the elimination of hydrated water. Also, for (Pb-Ni) com- plex, decomposition occurred at the range of (27 - 200 oC) with weight loss (3.072%) due to the elimination of the hydrated water for (Pb-Co) complex the elimination at the range (27 - 180 oC) with weight loss (6.35%) due to the hydrated water continuous decomposition at the range of (19 - 350 oC) for (Pb-Fe) complex with weight loss (19.52%), and at the range of 200 - 300 oC with weight loss (14.024%) for (Pb-Ni)-PAC complex and at the range 200 - 350 with weight loss (18.39%) for Pb-Co complex, these decomposition due to the elimination of chlorine atoms and coordinated water. After that an exother-
mic peaks are appeared above 300 oC for Pb-Fe showed decom- position at the range of 305 - 400 oC with a weight loss of (35.78%), continuous decomposition of the complex from 550 - 700 oC with weight loss of (26.62%) due to the change to metal oxides of Pb or Fe oxide (Pb-Ni) complex showed exothermic peaks at the ranges of 325 - 450 with a weight loss (10.19%) corresponding to the change of metal carbonate which will decomposed at the range of (550 - 700) with weight loss of (24.57%) to metal oxides.
Pb-Co complex showed a decomposition at the same ranges of 350 - 465 with weight loss of 32.27%, due the formation of metal carbonate and decomposition to metal oxides of Pb and Co oxides occurred at the ranges of 475 - 600 with an endo- thermic peak of weight loss 51%, as shown in Table 5.
Finally, the stability of the complexes will be obeyed the following range order:
[Pb-Ni] complex > [Pb-Fe] complex > [Pb-Co] complex the stability of [Pb-Ni] complex due to its decomposition in thermal analysis till metal oxides at higher temperature ranges.
CONCLUSIONS
A new chelating copolymers containing azo group units as ligating centers with different molar ratios of metal ions were synthesized and examined by using IR, 1H NMR spectra and also the polymer complexes were examined by thermal analysis technique. Elemental analysis were elucidated by atomic absorp- tion spectrophotometer and IR-spectra. →→ The thermal study of these polymer complexes was used to elucidated the suppos- ed structure of the polymer complex and explained the coordi- nated water in the structure, also explained that the stability of
the complexes in the range order [Pb-Ni] complex > [Pb-Fe]
complex > [Pb-Co] complex.
REFERENCES
1. Bach, H. C.; InMark, H. F.; Gaylrod, N. G.; Bikalo, M. M. Editors Encyclopedia of polymer science and technology, New York, Interscience. 1969, 671.
2. Agolini, F.; Gay, F. P. Macromolecules 1970, 3, 349.
3. David, TLC; Movawetz, H. H. Macomolecules 1976, 9, 463.
4. Blair, H. S.; Pague, V. I.; Riordan, J. F. Polymer 1980, 21, 1195.
5. Morgan, P. W. US Patent. 1974, 3, 791.
6. Balasubramannian, M.; Nanjan, M. J.; Santappa, M. Macromol.
Chem. 1979, 180, 2517.
7. Balasubramainnan, M.; Nanjan, M. J.; Santappa, M. Macromol.
Chem. 1981, 182, 853.
8. Srinivasan, P. R.; Srinivasan, M.; Mahadevanv, J. Polym. Sci. 1982, 20, 1145.
9. Blasius, E.; Brozio, B.; Flaschka, H. A.; Bamad, A. J. Jr. (Eds) Chelates in Analytical Chemistry 1967, 1, 49.
10. Kantipuly, C.; Katragadda, S.; Chow, A.; Gesser, H. D. Talanta.
1990, 37, 491.
11. Moyers, E. M.; Fritz, J. S. Anal. Chem. 1977, 49(3), 418.
12. Ueno, K.; Martell, A. J. Phys. Chem. 1955, 59, 998.
13. Ueno, K.; Martell, A. E. J. Phys. Chem. 1956, 60, 1270.
14. Okawa, H. et. al. J. Chem. Soc. 1985, 59.
15. Sinn, E. et. al. Inorg. Chem. 1985, 24, 127.
16. Collins, T. J. et. al. J. Am. Chem. Soc. 1986, 108, 6593.
17. Che, C. M.; Cheng, W. K. J. Chem. Soc. Chem. Commun. 1986, 1443.
18. Rangnekar, D. W.; Parekh, R. R. Dyes Pigments 1987, 8, 475.
19. Radwan, M. A.; Badr, S. K. J. Appl. Sci 1999, 6, 14.
20. Haslam, J. Introduction to the chemical analysis of plastics, English Translation, London, Ilife Books Ltd. 1969.
21. Patel, J. R.; Sutaria, D. H.; Patel, M. N. React. Polym. 1995, 25, 17.
22. Huggins, M. L. J. Am. Chem. Soc. 1942, 74, 2715.
23. Kraemer, E. O. Ind. Eng. Chem. 1938, 30, 1200.
24. Cukurovali, A.; Yilmas, I. Trans Met. Chem. 2006, 31, 207.
25. El-Boraey, H. A.; El-Tabl, A. S. Polish J. Chem. 2003, 77, 1759.
26. El-Tabl, A. S.; Imam, S. M. Trans. Met. Chem. 1997, 22, 259.