Printed in the Republic of Korea
분광광도 검출법으로 간단하고 선택적인 흐름주입촉매법에 의한 루테늄 정량
Behzad Rezaei* and Najmeh Majidi
Department of Chemistry, Isfahan University of Technology, Isfahan 84156 Iran (2006. 9. 29 접수)
Simple and Selective Flow Injection Catalytic Determination of Ruthenium with Spectrophotometric Detection
Behzad Rezaei* and Najmeh Majidi
Department of Chemistry, Isfahan University of Technology, Isfahan 84156 Iran (Received September 29, 2006)
요 약. 간단하고선택적인흐름주입촉매법으로 pH 1.0에서고황산염(periodate)에의한 pyronin B의산화의촉매 효과를근간으로루테늄정량에대해논하였다. 반응속도는 555 nm에서의흡수를분광광도법으로조절하였다. 루테늄 정량의최적화된조건으로검출한계는 0.04 ng/mL로측정범위로 0.1-10.0 ng/mL(r2=0.9982)와 10.0-50.0 ng/mL (r2=0.9934), 그리고시료속도는 30±5 samples/h를얻었다. 5번측정의상대표준편차는 1.44%를넘지않았다. 제안된 본방법은성공적으로환경및생물학적시료중에서루테늄의초미량정량에성공적으로적용되었다.
주제어:루테늄, FIA, 분광광도법, Pyronin B, 촉매적정량
ABSTRACT. A simple, selective and highly sensitive flow injection catalytic method was presented for determination of ruthenium based on its catalytic effect on the oxidation of pyronin B by periodate in pH=1.0. The reaction rate is con- trolled specrophotometricaly by monitoring the dye absorbance at 555 nm. The optimized conditions make it possible to determine ruthenium in the ranges of 0.1-10.0 ng/mL (r2=0.9982) and 10.0-50.0 ng/mL (r2=0.9934) with a detection limit of 0.04 ng/mL and a sample rate of 30±5 samples/h. Relative standard deviation for the results of five replicate mea- surements does not exceed 1.44%. The proposed method has been successfully applied for quantitation of ultra trace amounts of ruthenium in some environmental and biological samples.
Keywords: Ruthenium, FIA, Spectrophotometry, Pyronin B, Catalytic Determination
INTRODUCTION
Different studies have been carried out regarding the application of materials containing Ru compounds.
Due to their electrochemical and thermoelectric properties, such types of materials have shown potential catalytic,1,2 pharmaceutical, analytical and theoretical applications.Ruthenium Redis an inor- ganic dye used in microscopy for differential stain- ing and as a diagnostic reagent.3,4 This compound is
used to study changes in cytoplasmic concentrations of calcium. Ruthenium red inhibits calcium trans- port through membrane channels. The success of cisplatin as an anticancer agent has stimulated the search for other organometallic cytotoxic compounds with more acceptable toxicity profile and, if possi- ble, an increase of antitumor activity. In the last three decades, a wide range of ruthenium agents has been synthesized and tested for antitumor properties.
Despite their low cytotoxic potential in vitro, many
the other side, for its specific antimetastatic activity rather than for the generic reduction of growth in the tumors themselves.5,6
There are three main properties that make ruthe- nium complexes well suited for medicinal applica- tions: (i) rate of ligand exchange (ii) the ability of ruthenium to mimic iron in binding to certain bio- logical molecules, (iii) the range of accessible oxi- dation states. Ruthenium antitumor complexes probably function in a manner different from cisplatin, which appears to bind DNA by cross-linking adjacent gua- nine, thereby causing a class of DNA- binding pro- teins to adhere to the site. So, ruthenium complexes can be used as anti tumor and anti cancer drugs.5-9 But all ruthenium compounds should be consid- ered as highly toxic and carcinogenic. Compounds of ruthenium stain the skin very strongly and can damage lung and eyes. It seems that ingested ruthe- nium is retained bones. The use of these kinds of catalysts in industrial and pharmaceutical processes could cause ruthenium contamination in environ- mental systems, which necessitates the development of reliable and practical procedures for determining this metal in biological and environmental samples.
A number of methods have been proposed for determination of ruthenium using spectrophotome- try,10-12 voltammetry,13 atomic absorption spectroscopy,14 fluorimetry15 and flow injection analysis.16-21 Among these determination methods the availability of spectrophotometric instruments and the simplicity of analytical procedure make the procedure very attractive for a wide range of applications, while in other mentioned determination techniques, such as voltammetry and atomic absorption spectroscopy, instruments are highly expensive, day-to-day main- tenance is high, and the methods are not free from various types of inherent interferences. A variety of chromogenic agents have served as the basis for the sensitive spectrophotometric quantitation of ruthe-
simple instruments, low cost, high reproducibility, high selectivity and sensitivity that seem promising to determine trace levels of ruthenium in real samples.
In this paper a new selective, sensitive and rapid method is reported for determination of ruthenium (III), based on its catalytic effect on the oxidation of pyronin B by periodate. The variance in the absor- bance of the reagent, at λmax=555 nm, is propor- tional to the concentration of ruthenium. Using flow injection analysis increases reproducibility and the speed of reaction, also it decreases interferences.
The influence of variables has been studied, and the developed procedure has been employed for the determination of ruthenium in the real samples with satisfactory results.
EXPERIMENTAL Reagents
A 100.0 µg/mL stock solution of Ru(III) was pre- pared by dissolving 0.2052 g, of RuCl3, in ethanol in a 100 mL volumetric flask. All working solutions of Ru(III) were prepared by dilution of this stock solution.
Solution of 1.0×10⁻³ M, pyronin B was prepared by dissolving appropriate amounts of pyronin B in a 100 ml volumetric flask.
Sodium periodate stock solution (1.0×10⁻²M) was prepared by dissolving 0.5582 g, of NaIO4, in water and diluting to 100 ml with doubled distilled water.
A 100 µg/ml solution of Ruthenium Red was pre- pared by dissolving 0.026 g of Ruthenium Red (Sigma, lot 126H1196) in water in a 100 ml volumetric flask.
Buffer solution of pH=1 (Glycine/HCl) was pur- chased from Merck and universal buffer solutions in the range from 2 to 10 were prepared with ace- tate, citrate and phosphate.23
Flow injection system
Fig. 1 shows the schematic diagram of the flow
system. Silicon rubber tube with 1.0 mm i.d was used for delivery of the solutions. The 12-channal peristaltic pump (Desaga, PLG, 220 V, 70W) was fit- ted for pumping solutions. A mixed solution of periodate, buffer, pyronin B and water as a carrier stream was delivered through silicon rubber tubing.
The standard solution of Ru(III) was injected into a carrier stream with a sample injector (Rheodyne, Model 9125). An UV-Visible spectrophotometer (Shi- madzu, Model 6AV) equipped with a flow through cell with 10-mm path length connected to recorder (Shimadzu C-R4AX Chromatopac) was used for monitoring the variation in the absorbance spectrum.
Determination of ruthenium in human serum Mineralization of 2.0 ml of the samples was carried out for 1.0 h at 100oC with the addition of 4 ml of concen- trated nitric acid.24 Then samples were analyzed directly after dilution with water to a suitable volume.
Determination of ruthenium in ruthenium red and rock samples
A 5.0 ml sample solution was digested and then was treated and subjected to ion exchange separa- tion to eliminate the base metals from ruthenium.15 After chloride removal by evaporation with H2SO4
the solution was diluted with water to 25 ml. Ali- quots of the solution were taken for ruthenium anal- ysis according to the proposed procedure.
RESULTS AND DISCUSSION
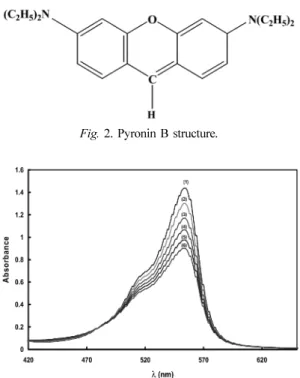
Pyronin B (Fig. 2) can be oxidized by periodate.
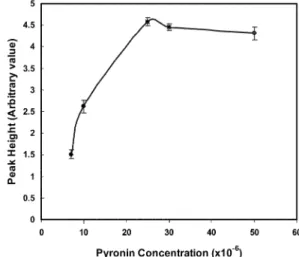
But this slow reaction rate can be increased by addi- tion of the ultra trace amounts of ruthenium. This reaction is followed spectrophotometrically (Fig. 3) by controlling absorbance change (DA) of the dye at 555 nm. DA is proportional to Ru(III) concentra- tion (Eq. 2).
The rate equation of the catalyzed reaction is:
Rate=-d [py]/dt=k [Ru(III)] [py] m [IO4-]n (1) Where k is the rate constant and m and n are the order for pyronin B and periodate, respectively.
Because reagents concentration is much more than ruthenium concentration, so we will have:
Rate=∆A=k'[Ru(III)] (2) In order to measure ∆A, the reagent mixture (car- rier stream) was passed through flow cell in the absence of Ru(III), until a constant and stable base- line was obtained. Then the sample of ruthenium
Fig. 1. Schematic diagram of the flow system. (flow rate of 44 ml/h for each channel, sample loop volume of 118 µL, reaction coil length of 115 cm, absorbance wavelengths:
λmax=555 nm); S, injection valve; RC, reaction coil; D, spectrophotometer; PP, peristaltic pump.
Fig. 2. Pyronin B structure.
Fig. 3. Variation of absorbance for the pyronin B - periodate system with time. Conditions: Pyronin B, 1.0×10⁻⁵ M; pH, 1.0; Ru(III), 10 ng/mL; Periodate, 2.0×10⁻⁴ M; Time interval for each scan, 60 sec.
was injected and the change in the absorbance was monitored. The height of the peaks was measured as signal (∆A).
To have more favorite sensitivity the effect of reagent concentrations and manifold variables on the sensitivity was studied.
Effect of pH
Experiment was done at acidic pH values. Fig. 4 shows the effect of pH on the peak height. The maximum peak height with the best baseline is at pH 1.0. While higher pH values cause decreasing in the signal. This phenomenon can be due to the fact that at higher pH values (pH>1.0), the ability of periodate to oxidize pyronin increases with increas- ing hydroxide ions, thus, decreases the catalytic role of Ru(III). The effect of higher acidic conditions was tested by using concentrated HCl solutions.
But the results show that the signal become poor at stronger acidic conditions. Therefore, a pH of 1.0 was selected as the optimum pH value.
Effect of reagents concentration
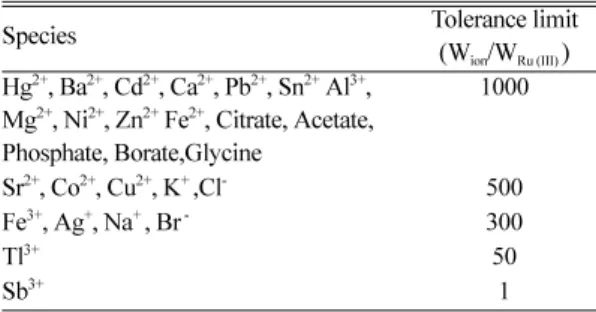
The effect of pyronin B concentration on the sen- sitivity was studied at Ru(III) concentration of 5.0 ng/mL and the optimum pH. Fig. 5 shows that by
increasing pyronin B concentration up to 2.5 × 10⁻⁵ M, the reaction rate increases, whereas greater amounts of pyronin B concentration causes decrease in sen- sitivity. This may be due to the aggregation of the dye at higher concentrations. Thus pyronin B con- centration of 2.5 × 10⁻⁵ M was selected.
The influence of periodate concentration in the presence of 5.0 ng/mL Ru(III), 2.5×10⁻⁵ M pyronin,
Fig. 4. Effect of pH on the sensitivity. Conditions: Pyronin B, 1.0×10⁻⁵ M; Ru(III), 5.0 ng/mL; Periodate, 1×10⁻⁴; Flow rate 17.6 ml/h; Reaction Coil, 115 cm; Injection loop volume, 40 µL.
Fig. 5. Effect of pyronin concentration on the sensitivity.
Conditions: pH, 1.0; Ru(III), 5.0 ng/mL; Periodate, 1.0×10⁻⁴ M;
Flow rate 17.6 ml/h; Reaction Coil, 115 cm; Injection loop volume, 40 µL.
Fig. 6. Effect of periodate concentration on the sensitivity.
Conditions: pH, 1.0; Ru(III), 5.0 ng/mL; Pyronin B, 2.5×10⁻⁵ M;
Flow rate 17.6 ml/h; Reaction Coil, 115 cm; Injection loop volume, 40 µL.
at pH 1.0 is shown in Fig. 6. The results indicate that the best concentration for periodate is 7.0 ×10⁻⁵ M.
By increasing the periodate concentration more than this level the rate of the uncatalyzed reaction increases to a greater extent than the catalyzed reac- tion and the difference between catalyzed and uncatalyzed reaction (peak height) diminished at higher periodate concentration. Therefore the opti- mum periodate concentration was selected to be 7.0
×10-5 M.
The effect of ionic strength was studied on the sensitivity. The sensitivity was slightly changed with increasing ionic strength of the reaction mixture.
Effect of manifold variables
The influence of variables such as flow rate, reac- tion coil and injected volume on the sensitivity was studied.
The peak height depends on the residence time of the sample in the system that is affected by flow rate and reaction coil length. The effect of flow rate was tested under optimum chemical conditions.
The results show the best pump flow rate (the max- imum peak height and minimum dispersion) will be obtained in 44.0 ml/h for each channel. At lower flow rates the dispersion will be high whereas at greater flow rates the reaction may be incomplete.
The results of investigating the effect of reaction coil length shows that by increasing the reaction coil length up to 115 cm, the sensitivity increases.
Above this reactor length, increased dispersion will decrease the peak height.
The influence of sample volume was tested with the optimum conditions; in the range of 19.0 to 200 µl.
The results represent that sensitivity raised by increasing the volume of sample loop volume, but the injection of a large amount of sample results in peak broadening and tailing. Thus, a sample vol- ume of 118 µL was selected.
Analytical characteristics of the method Under above mentioned conditions ruthenium concentration can be determined in the ranges of 0.1-10.0 ng/mL and 10.0-50 ng/mL, with regres- sion coefficients of r=0.9982 and 0.9934, respec-
tively. The experimental limit of detection is 0.04 ng/mL (S/N=3). The relative standard deviation (RSD %) for ten replicate measurements of 0.7, 7.0 and 15.0 ng/mL of Ru(III) were 1.44, 0.43 and 0.59%, respectively.
Influence of foreign ions
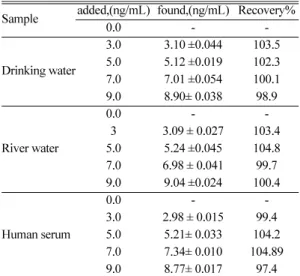
In order to assess the possible analytical applica- tions of the flow injection procedure described above, the influence of contaminant species pre- sented in various samples on the determination of Ru(III), 5.0 ng/mL, was investigated. The tolerance limit was defined as the concentration of added ions causing a relative error less than 3 %.(Table 1). The most of substances did not have any interference on the determination. Therefore the developed method is very selective.
Response characteristics
In Table 2, response characteristics of the pro- posed method are compared with recently reported methods.8-17,22 As is quite obvious from Table 3, proposed method has a good linear dynamic range and an excellent detection limit. Though, the method is simple, fast and relatively cheap, sensitivity is better than the methods listed in Table 3.
The described method has a good reproducibility (RSD<1.5%) and its selectivity is much better than other mentioned methods.
ANALYTICAL APPLICATION On the basis of the results obtained from the Ru(III) standards, the recommended method has been suc-
Table 1. Interferences effect on the determination of 5.0 ng/mL, Ru(III)
Species Tolerance limit
(Wion/WRu (III) ) Hg2+, Ba2+, Cd2+, Ca2+, Pb2+, Sn2+ Al3+,
Mg2+, Ni2+, Zn2+ Fe2+, Citrate, Acetate, Phosphate, Borate,Glycine
1000 Sr2+, Co2+, Cu2+, K+ ,Cl- 500
Fe3+, Ag+, Na+ , Br - 300
Tl3+ 50
Sb3+ 1
cessfully applied for the determination of Ru(III) in the river water, drinking water, and human serum samples. The analysis was performed by using the standard addition technique. The results are sum- marized in the Table 3, as can be seen; good recov- eries in all samples were obtained. The results of Ruthenium Red and rock analysis by the proposed
method were compared with those obtained with inductively coupled plasma atomic emission spec- trometry (Table 4).
CONCLUSION
A simple, sensitive, rapid, lower cost and very selec- tive flow injection catalytic procedure is reported for the determination of Ru(III) with spectrophoto- metric detection.
The proposed method can be used for the deter- mination of Ru(III) at ultra trace levels as low as micro amounts of ruthenium without use of any preconcentration steps and with a sample rate of 30±5samples/h. The main advantages of the method are its simplicity and its large dynamic range which provide suitable conditions for rapid and accurate determination of ruthenium in a variety of real sam- ples with satisfactory results.
Acknowledgments. We wish to express our grati- tude to the Research Affairs Division Isfahan Univer- sity of Technology (IUT), Isfahan, for financial support.
15 1.0-400 0.6 Fluorimetry
14 Up to 500 6 Atomic absorption
1819 1716
5-200 40-600
1-100 5-500
2.130 0.72
Flow injection
25 10-100 4 ICP-MS
26 10-500 5 ICP-AES
- 0.1-100 0.04 Proposed Method
Table 3. Determination of Ru(III) in the real samples Sample added,(ng/mL) found,(ng/mL) Recovery%
0.0 - -
Drinking water
3.0 3.10 ±0.044 103.5
5.0 5.12 ±0.019 102.3
7.0 7.01 ±0.054 100.1
9.0 8.90± 0.038 98.9
River water
0.0 - -
3 3.09 ± 0.027 103.4
5.0 5.24 ±0.045 104.8
7.0 6.98 ± 0.041 99.7
9.0 9.04 ±0.024 100.4
Human serum
0.0 - -
3.0 2.98 ± 0.015 99.4
5.0 5.21± 0.033 104.2
7.0 7.34± 0.010 104.89
9.0 8.77± 0.017 97.4
Table 4. Analysis of Ruthenium in rock and Ruthenium Red samples
Sample Ruthenium(µgmlI.C.P.AES method-1) Proposed method
Rock 1 (sulphide ore of copper and nickel) 1.32±0.02 1.36±0.05
Rock 2 (chromate ore) 4.75±0.03 4.67±0.06
Ruthenium Red 5.12±0.02 5.09±0.04
REFRENCES
1. Petrovic , S.; Rakic´ ´ , V.; Jovanovic´ , D.; Bari evic , A.,´
Applied Catalysis B: Environmental.2006, 66, 249.
2. Tominaga, K.; Catalysis Today. 2006, 115, 70.
3. Garza-Ortiz, A.; King-Dl´ az, B.; Sosa-Torres, M.E., Journal of Photochemistry and Photobiology B: Biol- ogy.2004, 76, 85.
4. Waller, L. N.; Fox, N.; Fox, K. F.; Price, R. L., Journal of Microbiological Methods. 2004, 58, 23.
5. Sava, G.; Capozzi, I.; Clerici, K.; Gagliardi, R.; Alessio, E.; Mestroni, G., Clin Exp Metastasis. 1998, 16, 371.
6. Sava, G.; Clerici, K.; Capozzi, I., Anti-Cancer Drugs.
1999, 10, 129.
7. Mazumder, U.; Gupta, M.; Karki, S.; Bhattacharya, S.;
Rathinasamy, S.; Sivakumar, T., Bioorganic & Medic- inal Chemistry. 2005, 13, 5766.
8. Chatterjee, D.; Sengupta, A.; Mitra, A.; Basak, S., Inor- ganica Chimica Acta. 2005, 358, 2954.
9. Turel, I.; Pe_canac, M.; Golobi, A.; Alessio, E.; Serli, B.; Bergamo, A.; Sava, G., Journal of Inorganic Bio- chemistry. 2004, 98, 393.
10. Keyvanfard, M.; Rezaei, B., Canadian journal of Ana- lytical sciences and Spectroscopy. 2005, 50,311.
11. Toral, M.; Papia, C.; Narvaez, J.; Richter, P., Micro- chem. J. 2002, 73, 317.
12. Amin, A., Spetro. Chim .Acta Part A. 2002, 58, 1831.
13. Dubey, R.; Bhalotra, A.; Gupta, M.; Puri, B., Micro- chem. J. 1998, 58, 117.
14. Minamisawa, H.; Kuroki, H.; Arai, N.; Okutani T., Anal. Chim. Acta. 1999, 398, 289.
15. Pal, B.; Shahedur Rahman, M., Talanta.1999, 48, 1075.
16. Ensafi, A.A.; Chamjangali, M.; Rahimi Mansour, H., Talanta. 2001, 55, 715.
17. Ensafi, A. A.; Chamjangali, M., Spectro.Chim. Acta Part A. 2000, 56, 1583.
18. Ensafi, A.; Zarei. K.; Khayamian, T., Microchem. J. 1999, 63, 235.
19. Almuaibed, A.; Townshend, A., Microchem. J. 1993, 48, 210.
20. Wang. H.; Zhoa, Y.; Zhao. Y.; Li, Q.; Chen, X.; Hu, Z., Anal. Chim. Acta. 2001, 429, 207.
21. Zeng, Y.; Xu, H.; Liu, H.; Wang, K.; Chen, X.; Hu, Z.;
Fan., B, Talanta. 2001, 54, 603.
22. Baret, M.; Massart, D.; Fabry, P.; Conesa, F.; Eichner, C.; Menardo, C., Talanta. 2000, 51, 863.
23. Lurie, Ju., “Handbook of Analytical Chemistry”, pp 263., Moscow, MIR Publishers.
24. Jamaluddin Ahmad, M.; Mamun M., Talanta. 2001, 55, 25. Krystek, P.; Heumann, K. G.,43. Fresenius Journal of Ana-
lytical Chemistry. 1999, 364, 87.
26. Adachi, T.; Takeishi, H.; Sasaki, Y.; Motojima, K., Anal.
Chim. Acta, 1989,218, 77.
c