202
Sexual behavior and sexually transmitted
infection in the elderly population of South Korea
Hee Youn Kim, Hyun-Sop Choe, Dong Sup Lee, Je Mo Yoo, Seung-Ju Lee
Department of Urology, St. Vincent’s Hospital, College of Medicine, The Catholic University of Korea, Seoul, Korea
Purpose: To study the sexual behavior and status of sexually transmitted urethritis (STU) in the elderly population of South Korea.
Materials and Methods: Congregating places for elderly population, which were selected on the expected risk of sexually trans- mitted infections, were visited to study their sexual behavior, awareness on sexually transmitted diseases (STDs), and STU status using a specially developed survey and urine polymerase chain reaction (PCR) test. In addition, analysis of the Health Insurance Re- view & Assessment Service (HIRA) database was done to study the nationwide status and trends of STU of the elderly population.
Results: The study found that approximately 42% of elderly South Koreans were sexually active. Elderlies in the high-risk group showed a higher percentage of multiple sexual partners and prostitution than elderlies in the low-risk group. Only 3% and 14% in the low-risk group and high-risk group used condoms, showing a very low rate of condom use. Both the urine PCR results and HIRA database analysis showed that the prevalence of STU was not high and it remained stable in recent years, implying that currently, STU is not a significant burden on public health in the elderly population of South Korea.
Conclusions: The current study presented the sexual behavior in the elderly population of South Korea, as well as the recent prev- alence and trend of STU in the elderly population. These results may be used as baseline data for future study, education, preven- tion and public campaign plan for STDs in the elderly population.
Keywords: Aged; Sexual behavior; Sexually transmitted diseases
This is an Open Access article distributed under the terms of the Creative Commons Attribution Non-Commercial License (http://creativecommons.org/licenses/by-nc/4.0) which permits unrestricted non-commercial use, distribution, and reproduction in any medium, provided the original work is properly cited.
Original Article - Infection/Inflammation
Received: 13 December, 2018 • Accepted: 17 February, 2019 Corresponding Author: Seung-Ju Lee
Department of Urology, St. Vincent’s Hospital, College of Medicine, The Catholic University of Korea, 93 Jungbu-daero, Paldal-gu, Suwon 16247, Korea TEL: +82-31-249-7473, FAX: +82-31-253-0949, E-mail: seungju@catholic.ac.kr
ORCID: https://orcid.org/0000-0003-0072-8010
ⓒ The Korean Urological Association
www.icurology.org
Investig Clin Urol 2019;60:202-209.
https://doi.org/10.4111/icu.2019.60.3.202 pISSN 2466-0493 • eISSN 2466-054X
INTRODUCTION
The World Health Organization and the United Nations classified population aging into three categories according to the percentage of population aged over 65 years: aging society when the proportion is over 7%, aged society when the proportion is over 14%, and super-aged society when the proportion is over 20% [1]. South Korea is one of the fastest aging countries in the world. It has become an aging society in 2000, aged society in 2017, and is expected to
become a super-aged society in 2026 [2,3]. Medical science has undoubtedly contributed to this population aging, and as a result, the number and proportion of elderly people who maintain sexual activity is thought to be higher than in the past and is expected to rise continually in the future.
However, despite this rapid change, social recognition of sexual needs and realities of its elderly population tends to be slow [4]. It is even a taboo subject in many Asian countries including South Korea. As a result, sexual activity in the elderly tends to take place in the shade. In the
203
Investig Clin Urol 2019;60:202-209. www.icurology.org
Sexual behavior and STD in elderly South Korean absence of a spouse, which is common in the elderly, many
may resort to prostitution to fulfill their sexual needs and recently this has been a social issue in the form of “Bacchus ladies” in South Korea [5,6]. “Bacchus ladies” is a term for poor elderly women selling sex to elderly men for a living, generally at urban public parks where elderlies congregate.
This naturally raises concerns for sexually transmitted diseases (STDs) in the elderly population.
STDs in the elderly population is a subject that has been neglected from public campaign for prevention and education of STDs, STDs-related researches, and even healthcare professionals because the incidence is consi- derably low compared to that of the younger population [7-10].
As population aging progresses and proportion of elderlies maintaining sexual activity grows, STDs can be a potential healthcare problem for the elderly population, especially for those exposed to unprotected sex and prostitution as in the cases of “Bacchus ladies.” Also, elderlies are more susceptible to STDs because of low use of condoms and decreased immunity [4,9,11].
In light of these findings, there is a growing need for an accurate assessment of the current status of STDs in the elderly population. Sexual behavior of the elderly population should also be assessed in conjunction with the status of STDs, because knowledge of social dynamics, rituals, and sexual practices of the elderly are necessary to delineate obstacles to change and to determine the most effective way to reach this group [12]. The current study attempted to assess these problems to provide basic data for establishing STDs prevention, education and public campaign plan for the elderly population.
MATERIALS AND METHODS
This study was conducted on two fronts. First, congre- gating places for elderly population were selected and visited by our researchers to study their sexual behavior, awareness on STDs, and sexually transmitted urethritis (STU) status. Second, Analysis of the Health Insurance Review
& Assessment Service (HIRA) database was done to study the nationwide status and trends of STU of the elderly population. The Institutional Review Board of The Catholic University of Korea, St. Vincent’s Hospital approved the study protocol (approval number: VC15QCSI0131).
1. Visits to congregating places for the elderly population
We hypothesized that sexual behavior and risk of STDs infection in the elderly population would be different
depending on congregating places. As such, congregating places for the elderlies were selected on the basis of risk of STDs infection. Senior welfare centers were selected as places where risk of STDs infection is expected to be low, and urban public parks were selected as places where risk of STDs infection is expected be high. To find out the nationwide status, multiple places were selected around the country. For the study of the elderlies with low risk of STDs, senior welfare center in the city of Incheon and Ulsan were selected, and for the study of the elderlies with high risk of STDs, Jongmyo Park in the city of Seoul and Dalseong Park in the city of Daegu were selected. Visits were made between July 2015 and December 2015. Informed consent was received from all elderlies who volunteered for the study. They were first asked to fill out a survey on sexual behavior and STDs awareness, developed for the purpose of the current study (Supplementary material).
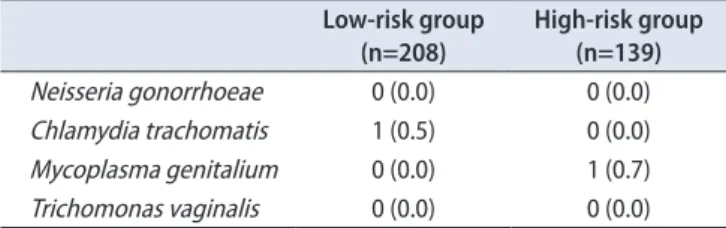
Then, first-void urine sample was obtained for urine polymerase chain reaction (PCR) test (Seegene Medical Foundation, Seoul, Korea) to test for Neisseria gonorrhoeae, Chlamydia trachomatis, Mycoplasma genitalium and Trichomonas vaginalis. The survey contained components on socioeconomic status, sexual behavior, awareness regarding STDs, STDs status and sexual health education.
The results of the survey and urine PCR test of the two groups were compared.
2. Analysis of the Health Insurance Review &
Assessment Service database
HIRA database contains all health insurance claims issued by health institutions in South Korea. Since all Koreans are required to enroll in the National Health Insurance Service by law, the HIRA database is a representative data of the whole country. Data on insurance claims with the disease codes containing N. gonorrhoeae and C. trachomatis between 2010 and 2016, was analyzed. The actual number and proportion of patients over 65 years of age were investigated and the annual trend was analyzed.
RESULTS
1. Survey
Table 1 describes the baseline demographics and socioeconomic status of the elderlies who completed the survey. There were a total of 337 participants aged over 60, 204 in the low-risk group and 133 in the high-risk group.
The distribution of age group was similar between the two groups. The distribution of sex was different; male to female ratio was 47.5:52.5 in the low-risk group, whereas in the high-
204 www.icurology.org
Kim et al
https://doi.org/10.4111/icu.2019.60.3.202 risk group, it was 88.0:12.0, showing male predominance in
the high-risk group. The education level and income level was generally higher in the low-risk group.
The rest of the survey components are described in the supplementary tables. Supplementary Tables 1 to 7 describe questions regarding sexual behavior, Supplementary Tables 8 to 11 describe questions regarding STDs awareness and
Supplementary Tables 12 to 14 describe questions regarding sexual health education.
Supplementary Table 1 describes the frequency of sexual intercourse. The overall frequency of sexual intercourse did not show significant difference between the two groups.
Respondents who had sexual intercourse over 1 to 2 times per 3 months was 36% and 32% in the low-risk and high-risk Table 1. Baseline information
Total Low-risk group High-risk group
Total 337 (100.0) 204 (60.5) 133 (39.5)
Age (y)
60–64 16 (4.7) 15 (7.4) 1 (0.8)
65–70 77 (22.8) 56 (27.5) 21 (15.8)
71–80 185 (54.9) 105 (51.5) 80 (60.2)
81–90 52 (15.4) 24 (11.8) 28 (21.1)
≥91 7 (2.1) 4 (2.0) 3 (2.3)
Sex
Male 214 (63.5) 97 (47.5) 117 (88.0)
Female 123 (36.5) 107 (52.5) 16 (12.0)
Education
None 31 (9.2) 15 (7.4) 16 (12.0)
Elementary school 111 (32.9) 52 (25.5) 59 (44.4)
Middle school 76 (22.6) 54 (26.5) 22 (16.5)
High school 92 (27.3) 68 (33.3) 24 (18.0)
College 25 (7.4) 13 (6.4) 12 (9.0)
Marital status
Married 242 (71.8) 148 (72.5) 94 (70.7)
Bereaved 82 (24.3) 49 (24.0) 33 (24.8)
Divorced 11 (3.3) 7 (3.4) 4 (3.0)
Not married 1 (0.3) 0 (0.0) 1 (0.8)
Etc. 1 (0.3) 0 (0.0) 1 (0.8)
Employment
Employed 30 (8.9) 23 (11.3) 7 (5.3)
Not employed 304 (90.2) 179 (87.7) 125 (94.0)
Past occupation
None or housewife 36 (10.7) 35 (17.2) 1 (0.8)
Private company 78 (23.1) 54 (26.5) 24 (18.0)
Government 18 (5.3) 14 (6.9) 4 (3.0)
Professional 17 (5.0) 14 (6.9) 3 (2.3)
Education 10 (3.0) 6 (2.9) 4 (3.0)
Self-employed 82 (24.3) 38 (18.6) 44 (33.1)
Agriculture/forestry/fishing 30 (8.9) 14 (6.9) 16 (12.0)
Etc. 64 (19.0) 27 (13.2) 37 (27.8)
Income level
Low 131 (38.9) 61 (29.9) 70 (52.6)
Middle-low 42 (12.5) 34 (16.7) 8 (6.0)
Middle 130 (38.6) 84 (41.2) 46 (34.6)
Middle-high 22 (6.5) 18 (8.8) 4 (3.0)
High 11 (3.3) 6 (2.9) 5 (3.8)
Values are presented as number (%).
205
Investig Clin Urol 2019;60:202-209. www.icurology.org
Sexual behavior and STD in elderly South Korean group, respectively. However when stratified by sex, 54% of
males maintained sexual life whereas the number was 31%
for females, implying that males play a more dominant role in sexual life in the elderly population. Supplementary Table 2 describes the number of sexual partners. In the low-risk group, 97.5% of the respondents had 1 or no sexual partners and only 0.5% had 3 or more partners. In the high-risk group, 94% of the respondents had 1 or no sexual partners and 5%
had 3 or more partners. The percentage of respondents who had multiple partners was 3 times higher in the high-risk group. Also, respondents who had multiple partners were all males. Supplementary Table 3 describes the types of sexual partners. In the low-risk group, over 90% were spouse and only 1% was prostitutes. In the high-risk group, 70% were spouse and 7% was prostitutes, showing a significantly higher percentage of prostitution. Supplementary Table 4 describes condom use during sexual intercourse. The percentage of condom use was 3% and 14% in the low- risk and high-risk group, respectively. Only 1% in the low- risk group and 10% in the high-risk-risk group responded that they used condoms almost always. This result shows that condom use is very low among sexually active elderly population. Supplementary Table 5 describes presence of erectile dysfunction among male respondents. The percentage of moderate to severe erectile dysfunction was 77% and 80% in the low-risk and high-risk group, respectively. This result shows that majority of males in both groups suffered from some degree of erectile dysfunction. Supplementary Table 6 describes use of phosphodiesterase-5 inhibitors. The percentage of respondents that used phosphodiesterase-5 inhibitors was 24% and 28% in the low-risk and high-risk group, respectively, showing a similar percentage of use for both groups. Supplementary Table 7 describes contribution of phosphodiesterase-5 inhibitors to sexual life. The percentage of respondents who thought phosphodiesterase-5 inhibitors helped their sexual life was 31% and 30% in the low-risk and high-risk group respectively, showing similar results.
Supplementary Table 8 describes history of STDs infec- tion and time of the infection. The percentage of respondents with history of previous STDs infection was 17% and 27%
in the low-risk and high-risk group, respectively. In the low- risk group, none of the past STDs infection occurred within 10 years, whereas in the high-risk group, 9% of the STDs infection occurred within 10 years. Supplementary Table 9 describes type of STDs. In the low-risk group, urethritis was 6%, gonorrhea 66%, syphilis 6% and genital herpes 6%. In the high-risk group, urethritis was 17%, gonorrhea 75% and genital herpes 3%. Gonorrhea was the predominant STD for
both groups. Supplementary Table 10 describes type of sexual partner from whom STDs was infected. In both groups, prostitute was the most common sexual partner from whom STDs was infected. It constituted 53% in the low-risk group and 55% in the high-risk group, without showing significant difference. Supplementary Table 11 describes places where STDs were treated. In both groups, hospitals were the most common place respondents received treatment for STDs. 86%
of the respondents for both groups received treatment in hospitals.
Supplementary Table 12 describes experience with and intention to receive sexual health education. Approximately 47% in the low-risk group and 41% in the high-risk group answered they were willing to receive sexual health education, showing similar response. However, past experience with sexual health education showed significant difference. Approximately 29% in the low-risk group answered they had experience with sexual health education, whereas only 10% in the high-risk group experienced sexual health education. This implies that elderlies congregating in senior welfare centers had more opportunities than elderlies congregating in public parks in receiving sexual health education. Supplementary Table 13 describes preferred institution to receive sexual health education for low-risk group and high-risk group, respectively. In the low-risk group 39% answered they preferred senior welfare centers, and 18% answered public health centers. In the high-risk group, 51% answered they preferred public health centers, 16% answered senior welfare centers and 4% answered counseling centers. This difference is thought to be due to convenience in approachability depending on their congregating places. Supplementary Table 14 describes preferred person to receive sexual health education. In the low-risk group, 34% answered they preferred doctor/nurse and 34% preferred counselor. In the high-risk group, 56%
answered they preferred doctor/nurse and 27% preferred counselor.
Table 2 describes the urine PCR results of the elderlies who completed the survey. There was one case of C.
trachomatis in the low-risk group and one case of M.
Table 2. Urine polymerase chain reaction results Low-risk group
(n=208)
High-risk group (n=139)
Neisseria gonorrhoeae 0 (0.0) 0 (0.0)
Chlamydia trachomatis 1 (0.5) 0 (0.0)
Mycoplasma genitalium 0 (0.0) 1 (0.7)
Trichomonas vaginalis 0 (0.0) 0 (0.0)
Values are presented as number (%).
206 www.icurology.org
Kim et al
https://doi.org/10.4111/icu.2019.60.3.202 genitalium in the high-risk group.
2. Analysis of the Health Insurance Review &
Assessment Service database
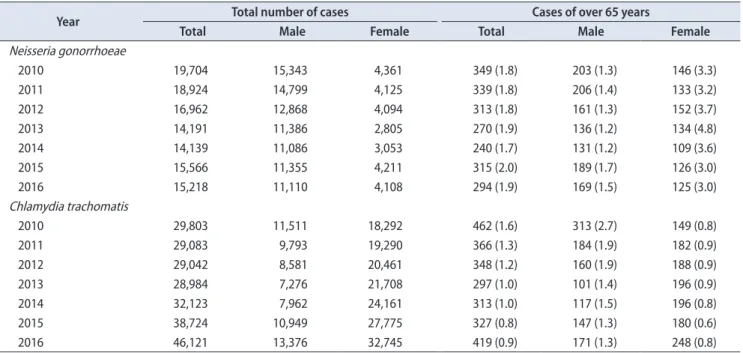
Table 3 describes the actual number and percentage of N. gonorrhoeae and of C. trachomatis infection in population over 65 years of age between 2010 and 2016 from the HIRA database. The overall percentage of N. gonorrhoeae infection in population over 65 years of age did not change much between 2010 and 2016. It was 1.8% in 2010 and 1.9% in 2016.
When stratified by sex, the percentage of male ranged
between 1.3% to 1.7% and the percentage of female ranged between 3.0% to 4.8%. The percentage of C. trachomatis infection in population over 65 years of age steadily declined.
It was 1.6% in 2010 and 0.9% in 2016. When stratified by sex, the percentage of male declined from 2.7% in 2010 to 1.3% in 2016, whereas the percentage of female was stable around 0.8%. Fig. 1 graphically describes this trend.
DISCUSSION
STDs in the elderly population is a subject that is
Table 3. Number and percentage of Neisseria gonorrhoeae and Chlamydia trachomatis infection in population over 65 years of age between 2010 and 2016 from the Health Insurance Review & Assessment Service database
Year Total number of cases Cases of over 65 years
Total Male Female Total Male Female
Neisseria gonorrhoeae
2010 19,704 15,343 4,361 349 (1.8) 203 (1.3) 146 (3.3)
2011 18,924 14,799 4,125 339 (1.8) 206 (1.4) 133 (3.2)
2012 16,962 12,868 4,094 313 (1.8) 161 (1.3) 152 (3.7)
2013 14,191 11,386 2,805 270 (1.9) 136 (1.2) 134 (4.8)
2014 14,139 11,086 3,053 240 (1.7) 131 (1.2) 109 (3.6)
2015 15,566 11,355 4,211 315 (2.0) 189 (1.7) 126 (3.0)
2016 15,218 11,110 4,108 294 (1.9) 169 (1.5) 125 (3.0)
Chlamydia trachomatis
2010 29,803 11,511 18,292 462 (1.6) 313 (2.7) 149 (0.8)
2011 29,083 9,793 19,290 366 (1.3) 184 (1.9) 182 (0.9)
2012 29,042 8,581 20,461 348 (1.2) 160 (1.9) 188 (0.9)
2013 28,984 7,276 21,708 297 (1.0) 101 (1.4) 196 (0.9)
2014 32,123 7,962 24,161 313 (1.0) 117 (1.5) 196 (0.8)
2015 38,724 10,949 27,775 327 (0.8) 147 (1.3) 180 (0.6)
2016 46,121 13,376 32,745 419 (0.9) 171 (1.3) 248 (0.8)
Values are presented as number only or number (%).
Fig. 1. Trend of (A) Neisseria gonorrhoeae and (B) Chlamydia trachomatis infection in population over 65 years of age between 2010 and 2016 from the Health Insurance Review & Assessment Service database.
2010 6.0 5.0 4.0 3.0 2.0 1.0 0.0
%
Year
2011 2012 2013 2014 2015 2016 2010
3.0
2.0
1.0
0.0
%
Year
2011 2012 2013 2014 2015 2016 2.5
1.5
0.5 Total
Male Female
Total Male Female
A B
207
Investig Clin Urol 2019;60:202-209. www.icurology.org
Sexual behavior and STD in elderly South Korean far from social, academic and clinical interest. There is a
general assumption that old people do not have sex and therefore are irrelevant from STDs. This may seem true, as the reported incidence of STDs in the elderly population is considerably lower than that of the sexually active younger population.
However, STDs in the elderly population may pose as a public health issue in the near future, if not for now, for several reasons. First, the elderly are more sexually active than common belief. A study reported that 40% to 60% of older adults between ages 60 and 71 was sexually active [13].
Another study also found that 47% of individuals aged 55 to 75 were sexually active [14]. Sexual activity extends into advanced stage of life, irrespective of sex [9,15]. With rapid aging of the society, the number and proportion of elderlies maintaining sexual activity is expected to increase. Second, with increased sexual activity in the elderly population, the risk of STDs infection may increase. Numerous studies have found the growing incidence of STDs among the elderly population [9,10,16]. Third, the actual incidence of STDs in the elderly population may be higher than reported figures because of underreporting, missed diagnosis and non- inclusion of asymptomatic carrier [11,12]. Fourth, the rate of condom use is generally very low among elderly population, usually because elderlies are past their reproductive age [7]. Lastly, elderlies are more susceptible to STDs because of physiologic changes related to aging, such as thinning of the vaginal mucosa, friability of cervical tissue due to estrogen deficiencies, and decline in immune function [4,9].
For these reasons, this study was conducted to assess the current status of STDs and sexual behavior in the elderly population and to provide basic data for establishing STDs prevention, education and public campaign plan for the elderly population.
The current study was able to find out several important findings with regard to the sexual behavior of the elderly population in South Korea. The overall frequency of sexual intercourse was 43% and 41% in the low-risk group and high risk group respectively, showing similar results with other studies [13-15]. The elderlies in the high-risk group showed a higher percentage of multiple sexual partners and prostitution than the elderlies in the low-risk group.
Only 3% and 14% in the low-risk group and high-risk group used condoms, showing a very low rate of condom use. With regard to sexual health education, senior welfare centers and public health centers were the preferred institution, and doctor/nurse and counselor was the preferred person for sexual health education.
The current study also looked at the recent prevalence
and trend of STU in the elderly population of South Korea.
Both the urine PCR results and HIRA database analysis showed that the prevalence was not high and it remained stable in recent years, implying that at least currently, STU is not a significant burden on public health in the elderly population of South Korea, unlike results from other countries. The Centers for Disease Control and Prevention reported that between 2012 and 2016, there was a 56%, 148%
and 127% increase of reported cases of chlamydia, gonorrhea and syphilis respectively in the 65 year or older population in the United States [17]. The result of the current study however, does not mean that we can entirely ignore the issue of STDs in the elderly population of South Korea. As described earlier, there is always the issue of underreporting and missed diagnosis, especially when sexual activity and STDs in the elderly population is a taboo subject. Also, several sexual health behaviors found in the current study such as very low rate of condom use and high rate of multiple partners and prostitution especially in the high-risk group, may increase the incidence of STDs in the elderly population of South Korea in the near future, if not for now.
Together with rapid population aging, these factors call for a continued monitoring of STDs in the elderly population.
There were several limitations in the current study.
First, the number of respondents of the survey was lower than our expectation. Many elderlies showed objection and indifference to the detailed questions on sexual activity, resulting in many unanswered surveys. Second, the PCR and HIRA database study only included STU for practical reasons. Because the study was conducted at open congregating places of elderly population, STDs that require blood sampling such as acquired immune deficiency syndrome and syphilis, were excluded. The same limitation also made us exclude condyloma and genital herpes because these diseases required detailed physical examination in a closed room. Third, although the HIRA database is a representative data of the whole country, it lacks information on uninsured medical claims and it also lacks clinical information such as laboratory tests, height, body weight, past history, etc. Also, there is the issue of inaccurate entry of diagnosis, which is not possible to acknowledge during analysis.
In summary, the current study was able to recognize the current prevalence and trend of STU as well as the sexual behaviors in the elderly population of South Korea.
These results may be used as baseline data for future study, education, prevention and public campaign plan for STDs in the elderly population. It can help policy-makers to develop an effective management or surveillance system for
208 www.icurology.org
Kim et al
https://doi.org/10.4111/icu.2019.60.3.202 prevention of STDs in the elderly population, and it can also
be used to help produce sexual health education specialists.
CONCLUSIONS
The current study presented the sexual behavior in the elderly population of South Korea, as well as the recent prevalence and trend of STU in the elderly population. Both the urine PCR study and analysis of the HIRA database showed that the prevalence of STU in the elderly population was low, implying that currently, STU is not a significant public health issue in South Korea. However, several sexual health behaviors found in the current study such as very low rate of condom use, multiple sexual partners and prostitution, together with rapid population aging, call for a continued monitoring of STDs in the elderly population.
These results may be used as baseline data for future study, education, prevention and public campaign plan for STDs in the elderly population.
CONFLICTS OF INTEREST
The authors have nothing to disclose.
ACKNOWLEDGMENTS
This study was supported by the Foundation for the Korean Urological Association in 2015 (FKUA-2015-001). We would like to thank Inae Park for her contribution to this study.
SUPPLEMENTARY MATERIALS
Scan this QR code to see the supplementary materials, or visit https://www.icurology.org/src/sm/icurology-60-202-s001.pdf.
REFERENCES
1. United Nations Department of Economic and Social Affairs, Population Division. World Population (ST/ESA/SER.A/408) ageing 2017 [Internet]. New York: United Nations Department of Economic and Social Affairs, Population Division; 2017 [cited 2018 Sep 12]. Available from: https://population.un.org/
ProfilesOfAgeing2017/index.html.
2. The Organisation for Economic Co-operation and Develop- ment. OECD statistics [Internet]. Paris: The Organisation for Economic Co-operation and Development [cited 2018 Sep 12].
Available from: http://stats.oecd.org/.
3. Statistics Korea. 2017 Statistics on the aged [Internet]. Daejeon:
Statistics Korea; 2017 Sep 26 [cited 2018 Sep 12]. Available from: http://kostat.go.kr/portal/eng/pressReleases/11/3/index.
board?bmode=read&bSeq=&aSeq=363974&pageNo=1&rowN um=10&navCount=10&currPg=&sTarget=title&sTxt=.
4. Letvak S, Schoder D. Sexually transmitted diseases in the el- derly: what you need to know. Geriatr Nurs 1996;17:156-60.
5. Ng D. Granny prostitutes reflect South Korea's problem of el- derly poverty [Internet]. Singapore: Channel NewsAsia; 2017 Jan 29 [cited 2018 Oct 19]. Available from: https://www.chan- nelnewsasia.com/news/asia/granny-prostitutes-reflect-south- korea-sproblem-of-elderly-pove-7562324.
6. Williamson L. The Korean grandmothers who sell sex [Inter- net]. Seoul: BBC News; 2014 Jun 10 [cited 2018 Oct 19]. Avail- able from: http://www.bbc.com/news/magazine-27189951.
7. Stall R, Catania J. AIDS risk behaviors among late middle-aged and elderly Americans. The National AIDS Behavioral Sur- veys. Arch Intern Med 1994;154:57-63.
8. Goodroad BK. HIV and AIDS in people older than 50. A con- tinuing concern. J Gerontol Nurs 2003;29:18-24.
9. Patel D, Gillespie B, Foxman B. Sexual behavior of older wom- en: results of a random-digit-dialing survey of 2,000 women in the United States. Sex Transm Dis 2003;30:216-20.
10. Karlovsky M, Lebed B, Mydlo JH. Increasing incidence and importance of HIV/AIDS and gonorrhea among men aged >/=
50 years in the US in the era of erectile dysfunction therapy.
Scand J Urol Nephrol 2004;38:247-52.
11. Szirony TA. Infection with HIV in the elderly population. J Gerontol Nurs 1999;25:25-31.
12. Talashek ML, Tichy AM, Epping H. Sexually transmitted dis- eases in the elderly--issues and recommendations. J Gerontol Nurs 1990;16:33-40.
13. Whipple B, Scura KW. The overlooked epidemic: HIV in older adults. Am J Nurs 1996;96:22-8; quiz 29.
14. Allison-Ottey S, Weston C, Hennawi G, Nichols M, Eldred L, Ferguson RP. Sexual practices of older adults in a high HIV prevalence environment. Md Med J 1999;48:287-91.
15. Laumann EO, Glasser DB, Neves RC, Moreira ED Jr; GSSAB Investigators' Group. A population-based survey of sexual activity, sexual problems and associated help-seeking behavior patterns in mature adults in the United States of America. Int J Impot Res 2009;21:171-8.
16. Liu H, Lin X, Xu Y, Chen S, Shi J, Morisky D. Emerging HIV
209
Investig Clin Urol 2019;60:202-209. www.icurology.org
Sexual behavior and STD in elderly South Korean
epidemic among older adults in Nanning, China. AIDS Patient Care STDS 2012;26:565-7.
17. Centers for Disease Control and Prevention. Sexually trans-
mitted disease surveillance 2017. Atlanta: U.S. Department of Health and Human Services; 2018.
Kim et al.
Investig Clin Urol 2019;60:202-209. May 2019. https://doi.org/10.4111/icu.2019.60.3.202
Supplementary material. Survey on sexual behavior and awareness on sexually transmitted disease A. Questions regarding sexual behavior
1. How frequent did you have sexual intercourse during the last year?
1) 1–2 times per 1 month 2) 1–2 times per 3 months 3) 1–2 times per 6 months 4) 1–2 times per 1 year 5) None
2. What was the number of sexual partner during the last year?
1) 1 2) 2
3) More than 3 4) None
3. What was the type of sexual partner during the last year? Pick all.
1) Spouse 2) Couple 3) Prostitution 4) Etc.
4. Did you use condoms during sexual intercourse during the last year?
1) Almost always 2) More than half times 3) Less than half times 4) Never used
For men only
5. Do you think that you have decreased sexual function such as erectile dysfunction?
1) Severe 2) Moderate 3) Little 4) None
6. Do you use phosphodiesterase inhibitors (like Viagra) when you have sexual intercourse?
1) Yes 2) No
7. How much do you think phosphodiesterase inhibitors (like Viagra) contribute to your sexual life?
1) Very much 2) Moderate 3) Little 4) None
B. Questions regarding sexually transmitted diseases (STDs) 8. Were you ever infected with sexually transmitted diseases?
1) Yes 2) No
If yes, when were you infected?
1) Over 10 years ago 2) Under 10 years ago 3) Not sure
9. What type of sexually transmitted diseases were you infected?
1) Urethritis 2) Gonorrhea 3) Syphilis 4) Herpes 5) Don’t know
10. What type of sexual partner were you infected from?
1) Spouse 2) Friend 3) Prostitute 4) Not sure
11. Where did you get treatment for sexually transmitted diseases?
1) Untreated 2) Hospital
3) Community health center 4) Etc.
C. Questions regarding sexual health education 12. Did you have any experience with sexual health education?
1) Yes 2) No
Are you willing to receive sexual health education for elderlies?
1) Yes 2) No
13. What type of institution do you prefer to receive sexual health education?
1) District office 2) Welfare center 3) Counseling center 4) Religious institution 5) Public health center 6) Professional organization 7) Etc.
14. What type of personnel do you prefer to receive sexual health education?
1) Doctor/nurse 2) Counselor 3) Family 4) Friend 5) Etc.
Supplementary Table 1. Frequency of sexual intercourse
Low-risk group (n=204) High-risk group (n=133)
1–2 times
/1 mo 1–2 times
/3 mo 1–2 times
/6 mo 1–2 times
/1 y None 1–2 times
/1 mo 1–2 times
/3 mo 1–2 times
/6 mo 1–2 times
/1 y None
Age (y)
60–64 10 (4.9) 1 (0.5) 0 (0.0) 0 (0.0) 4 (2.0) 1 (0.8) 0 (0.0) 0 (0.0) 0 (0.0) 0 (0.0)
65–70 23 (11.3) 6 (2.9) 3 (1.5) 5 (2.5) 19 (9.3) 7 (5.3) 2 (1.5) 0 (0.0) 2 (1.5) 10 (7.5)
71–80 27 (13.2) 6 (2.9) 2 (1.0) 2 (1.0) 68 (33.3) 21 (15.8) 5 (3.8) 4 (3.0) 5 (3.8) 45 (33.8)
81–90 1 (0.5) 0 (0.0) 0 (0.0) 0 (0.0) 23 (11.3) 6 (4.5) 1 (0.8) 0 (0.0) 0 (0.0) 21 (15.8)
≥91 0 (0.0) 0 (0.0) 0 (0.0) 0 (0.0) 4 (2.0) 0 (0.0) 0 (0.0) 0 (0.0) 0 (0.0) 3 (2.3)
Sex
Male 35 (17.2) 11 (5.4) 2 (1.0) 5 (2.5) 44 (21.6) 34 (25.6) 8 (6.0) 4 (3.0) 6 (4.5) 65 (48.9) Female 26 (12.7) 2 (1.0) 3 (1.5) 2 (1.0) 74 (36.3) 1 (0.8) 0 (0.0) 0 (0.0) 1 (0.8) 14 (10.5) Values are presented as number (%).
Supplementary Table 2. Number of sexual partners
Low-risk group (n=204) High-risk group (n=133)
1 2 Over 3 None 1 2 Over 3 None
Age (y)
60–64 10 (4.9) 1 (0.5) 0 (0.0) 4 (2.0) 1 (0.8) 0 (0.0) 0 (0.0) 0 (0.0)
65–70 36 (17.6) 1 (0.5) 0 (0.0) 19 (9.3) 9 (6.8) 0 (0.0) 2 (1.5) 10 (7.5)
71–80 35 (17.2) 2 (1.0) 1 (0.5) 67 (32.8) 29 (21.8) 2 (1.5) 3 (2.3) 46 (34.6)
81–90 0 (0.0) 0 (0.0) 0 (0.0) 24 (11.8) 6 (4.5) 0 (0.0) 1 (0.8) 21 (15.8)
≥91 0 (0.0) 0 (0.0) 0 (0.0) 4 (2.0) 0 (0.0) 0 (0.0) 0 (0.0) 3 (2.3)
Sex
Male 48 (23.5) 4 (2.0) 1 (0.5) 44 (21.6) 42 (31.6) 2 (1.5) 6 (4.5) 66 (49.6)
Female 33 (16.2) 0 (0.0) 0 (0.0) 70 (34.3) 2 (1.5) 0 (0.0) 0 (0.0) 14 (10.5)
Values are presented as number (%).
Supplementary Table 3. Types of sexual partner
Low-risk group (n=88) High-risk group (n=58)
Spouse Couple Prostitution Etc. Spouse Couple Prostitution Etc.
Age (y)
60–64 10 (11.4) 1 (1.1) 0 (0.0) 0 (0.0) 1 (1.7) 0 (0.0) 0 (0.0) 0 (0.0)
65–70 34 (38.6) 3 (3.4) 0 (0.0) 0 (0.0) 8 (13.8) 4 (6.9) 1 (1.7) 0 (0.0)
71–80 36 (40.9) 3 (3.4) 1 (1.1) 0 (0.0) 28 (48.3) 5 (8.6) 3 (5.2) 1 (1.7)
81–90 0 (0.0) 0 (0.0) 0 (0.0) 0 (0.0) 3 (5.2) 4 (6.9) 0 (0.0) 0 (0.0)
≥91 0 (0.0) 0 (0.0) 0 (0.0) 0 (0.0) 0 (0.0) 0 (0.0) 0 (0.0) 0 (0.0)
Sex
Male 47 (53.4) 7 (8.0) 1 (1.1) 0 (0.0) 39 (67.2) 12 (20.7) 4 (6.9) 1 (1.7)
Female 33 (37.5) 0 (0.0) 0 (0.0) 0 (0.0) 1 (1.7) 1 (1.7) 0 (0.0) 0 (0.0)
Values are presented as number (%).
Supplementary Table 4. Condom use during sexual intercourse
Low-risk group (n=85) High-risk group (n=54)
Almost
always More than
half times Less than
half times Never
used Almost
always More than
half times Less than
half times Never used Age (y)
60–64 0 (0.0) 0 (0.0) 2 (2.4) 10 (11.8) 0 (0.0) 0 (0.0) 0 (0.0) 1 (1.9)
65–70 0 (0.0) 0 (0.0) 0 (0.0) 35 (41.2) 1 (1.9) 0 (0.0) 1 (1.9) 9 (16.7)
71–80 1 (1.2) 0 (0.0) 0 (0.0) 33 (38.8) 2 (3.7) 0 (0.0) 1 (1.9) 32 (59.3)
81–90 0 (0.0) 0 (0.0) 0 (0.0) 1 (1.2) 2 (3.7) 0 (0.0) 0 (0.0) 5 (9.3)
≥91 0 (0.0) 0 (0.0) 0 (0.0) 0 (0.0) 0 (0.0) 0 (0.0) 0 (0.0) 0 (0.0)
Sex
Male 1 (1.2) 0 (0.0) 1 (1.2) 50 (58.8) 5 (9.3) 0 (0.0) 2 (3.7) 45 (83.3)
Female 0 (0.0) 0 (0.0) 0 (0.0) 29 (34.1) 0 (0.0) 0 (0.0) 0 (0.0) 2 (3.7)
Values are presented as number (%).
Supplementary Table 5. Presence of erectile dysfunction
Low-risk group (n=97) High-risk group (n=111)
Severe Moderate Little None Severe Moderate Little None
Age (y)
60–64 1 (1.0) 2 (2.1) 0 (0.0) 0 (0.0) 0 (0.0) 0 (0.0) 0 (0.0) 0 (0.0)
65–70 19 (19.6) 18 (18.6) 4 (4.1) 2 (2.1) 4 (3.6) 5 (4.5) 7 (6.3) 0 (0.0)
71–80 4 (4.1) 22 (22.7) 10 (10.3) 4 (4.1) 31 (27.9) 25 (22.5) 11 (9.9) 1 (0.9)
81–90 5 (5.2) 2 (2.1) 1 (1.0) 1 (1.0) 15 (13.5) 3 (2.7) 3 (2.7) 1 (0.9)
≥91 1 (1.0) 1 (1.0) 0 (0.0) 0 (0.0) 3 (2.7) 0 (0.0) 0 (0.0) 0 (0.0)
Sex
Male 30 (30.9) 45 (46.4) 15 (15.5) 7 (7.2) 53 (47.7) 33 (29.7) 21 (18.9) 2 (1.8)
Values are presented as number (%).
Supplementary Table 6. Use of phosphodiesterase-5 inhibitors
Low-risk group (n=97) High-risk group (n=117)
Yes No Yes No
Age (y)
60–64 1 (1.0) 2 (2.1) 0 (0.0) 0 (0.0)
65–70 9 (9.3) 16 (16.5) 23 (19.7) 13 (11.1)
71–80 15 (15.5) 42 (43.3) 6 (5.1) 44 (37.6)
81–90 1 (1.0) 9 (9.3) 2 (1.7) 19 (16.2)
≥91 0 (0.0) 2 (2.1) 0 (0.0) 2 (1.7)
Sex
Male 23 (23.7) 71 (73.2) 32 (27.4) 78 (66.7)
Values are presented as number (%).
Supplementary Table 7. Contribution of phosphodiesterase-5 inhibitors to sexual life
Low-risk group (n=97) High-risk group (n=117)
Very much Moderate Little None Very much Moderate Little None
Age (y)
60–64 1 (1.0) 0 (0.0) 2 (2.1) 0 (0.0) 0 (0.0) 0 (0.0) 0 (0.0) 0 (0.0)
65–70 3 (3.1) 8 (8.2) 9 (9.3) 4 (4.1) 1 (0.9) 6 (5.1) 4 (3.4) 0 (0.0)
71–80 6 (6.2) 11 (11.3) 24 (24.7) 13 (13.4) 3 (2.6) 19 (16.2) 17 (14.5) 2 (1.7)
81–90 0 (0.0) 1 (1.0) 2 (2.1) 5 (5.2) 0 (0.0) 5 (4.3) 3 (2.6) 1 (0.9)
≥91 0 (0.0) 0 (0.0) 1 (1.0) 1 (1.0) 0 (0.0) 1 (0.9) 1 (0.9) 0 (0.0)
Sex
Male 10 (10.3) 20 (20.6) 38 (39.2) 23 (23.7) 4 (3.4) 31 (26.5) 25 (21.4) 3 (2.6)
Values are presented as number (%).
Supplementary Table 8. History of infection with sexually transmitted disease and time of infection
Low-risk group (n=204) High-risk group (n=133)
Infected Time of infection
Infected Time of infection
>10 y ≤10 y Not sure >10 y ≤10 y Not sure
Age (y)
60–64 0 (0.0) 0 (0.0) 0 (0.0) 0 (0.0) 0 (0.0) 0 (0.0) 0 (0.0) 0 (0.0)
65–70 7 (3.4) 7 (19.4) 0 (0.0) 0 (0.0) 8 (6.0) 7 (19.4) 0 (0.0) 1 (2.8)
71–80 24 (11.8) 24 (66.7) 0 (0.0) 0 (0.0) 21 (15.8) 18 (50.0) 2 (5.6) 0 (0.0)
81–90 5 (2.5) 5 (13.9) 0 (0.0) 0 (0.0) 7 (5.3) 6 (16.7) 1 (2.8) 1 (2.8)
≥91 0 (0.0) 0 (0.0) 0 (0.0) 0 (0.0) 0 (0.0) 0 (0.0) 0 (0.0) 0 (0.0)
Sex
Male 30 (14.7) 30 (83.3) 0 (0.0) 0 (0.0) 32 (24.1) 27 (75.0) 3 (8.3) 2 (5.6)
Female 6 (2.9) 6 (16.7) 0 (0.0) 0 (0.0) 4 (3.0) 4 (11.1) 0 (0.0) 0 (0.0)
Values are presented as number (%).
Supplementary Table 9. Type of sexually transmitted disease
Low-risk group (n=36) High-risk group (n=36)
Urethritis Gonorrhea Syphilis Herpes Urethritis Gonorrhea Syphilis Herpes Age (y)
60–64 0 (0.0) 0 (0.0) 0 (0.0) 0 (0.0) 0 (0.0) 0 (0.0) 0 (0.0) 0 (0.0)
65–70 1 (2.8) 5 (13.9) 0 (0.0) 1 (2.8) 1 (2.8) 5 (13.9) 0 (0.0) 1 (2.8)
71–80 1 (2.8) 16 (44.4) 2 (5.6) 1 (2.8) 3 (8.3) 16 (44.4) 0 (0.0) 0 (0.0)
81–90 0 (0.0) 3 (8.3) 0 (0.0) 0 (0.0) 2 (5.6) 4 (11.1) 0 (0.0) 0 (0.0)
≥91 0 (0.0) 0 (0.0) 0 (0.0) 0 (0.0) 0 (0.0) 0 (0.0) 0 (0.0) 0 (0.0)
Sex
Male 2 (5.6) 21 (58.3) 2 (5.6) 2 (5.6) 5 (13.9) 26 (72.2) 0 (0.0) 0 (0.0)
Female 0 (0.0) 3 (8.3) 0 (0.0) 0 (0.0) 1 (2.8) 1 (2.8) 0 (0.0) 1 (2.8)
Values are presented as number (%).
Supplementary Table 10. Types of sexual partner that sexually transmitted disease was infected
Low-risk group (n=36) High-risk group (n=36)
Spouse Friend Prostitution Not sure Spouse Friend Prostitution Not sure
Age (y)
60–64 0 (0.0) 0 (0.0) 0 (0.0) 0 (0.0) 0 (0.0) 0 (0.0) 0 (0.0) 0 (0.0)
65–70 1 (2.8) 1 (2.8) 3 (8.3) 2 (5.6) 2 (5.6) 2 (5.6) 4 (11.1) 0 (0.0)
71–80 3 (8.3) 5 (13.9) 14 (38.9) 1 (2.8) 0 (0.0) 4 (11.1) 13 (36.1) 4 (11.1)
81–90 2 (5.6) 0 (0.0) 2 (5.6) 0 (0.0) 0 (0.0) 2 (5.6) 3 (8.3) 1 (2.8)
≥91 0 (0.0) 0 (0.0) 0 (0.0) 0 (0.0) 0 (0.0) 0 (0.0) 0 (0.0) 0 (0.0)
Sex
Male 2 (5.6) 6 (16.7) 19 (52.8) 3 (8.3) 0 (0.0) 6 (16.7) 20 (55.6) 5 (13.9)
Female 4 (11.1) 0 (0.0) 0 (0.0) 1 (2.8) 2 (5.6) 2 (5.6) 0 (0.0) 0 (0.0)
Values are presented as number (%).
Supplementary Table 11. Place where sexually transmitted disease was treated
Low-risk group (n=36) High-risk group (n=36)
Untreated Hospital Community
health center Etc. Untreated Hospital Community
health center Etc Age (y)
60–64 0 (0.0) 0 (0.0) 0 (0.0) 0 (0.0) 0 (0.0) 0 (0.0) 0 (0.0) 0 (0.0)
65–70 1 (2.8) 6 (16.7) 0 (0.0) 0 (0.0) 1 (2.8) 7 (19.4) 0 (0.0) 0 (0.0)
71–80 0 (0.0) 21 (58.3) 1 (2.8) 2 (5.6) 1 (2.8) 18 (50.0) 1 (2.8) 1 (2.8)
81–90 1 (2.8) 4 (11.1) 0 (0.0) 0 (0.0) 0 (0.0) 6 (16.7) 0 (0.0) 0 (0.0)
≥91 0 (0.0) 0 (0.0) 0 (0.0) 0 (0.0) 0 (0.0) 0 (0.0) 0 (0.0) 0 (0.0)
Sex
Male 1 (2.8) 26 (72.2) 1 (2.8) 2 (5.6) 1 (2.8) 28 (77.8) 1 (2.8) 1 (2.8)
Female 1 (2.8) 5 (13.9) 0 (0.0) 0 (0.0) 1 (2.8) 3 (8.3) 0 (0.0) 0 (0.0)
Values are presented as number (%).
Supplementary Table 12. Experience with and intention to receive sexual health education
Low-risk group (n=204) High-risk group (n=133)
Experience with
sexual health education Intention to receive
sexual health education Experience with
sexual health education Intention to receive sexual health education
Yes No Yes No Yes No Yes no
Age (y)
60–64 7 (3.4) 8 (3.9) 11 (5.4) 5 (2.5) 0 (0.0) 1 (0.8) 0 (0.0) 0 (0.0)
65–70 22 (10.8) 34 (16.7) 35 (17.2) 20 (9.8) 1 (0.8) 20 (15.0) 17 (12.8) 5 (3.8)
71–80 29 (14.2) 76 (37.3) 44 (21.6) 61 (29.9) 9 (6.8) 67 (50.4) 30 (22.6) 44 (33.1)
81–90 2 (1.0) 22 (10.8) 7 (3.4) 17 (8.3) 2 (1.5) 25 (18.8) 6 (4.5) 21 (15.8)
≥91 0 (0.0) 4 (2.0) 0 (0.0) 4 (2.0) 0 (0.0) 3 (2.3) 2 (1.5) 1 (0.8)
Sex
Male 23 (11.3) 74 (36.3) 50 (24.5) 47 (23.0) 12 (9.0) 100 (75.2) 48 (36.1) 62 (46.6)
Female 37 (18.1) 70 (34.3) 47 (23.0) 60 (29.4) 0 (0.0) 16 (12.0) 7 (5.3) 9 (6.8)
Values are presented as number (%).
Supplementary Table 13. Preferred institution to receive sexual health education for low-risk group and high-risk group Low-risk group (n=204)High-risk group (n=133) District officeWelfare centerCounseling centerReligious institutionPublic health centerProfessional organizationEtc.District officeWelfare centerCounseling centerReligious institutionPublic health centerProfessional organizationEtc. Age (y) 60–641 (0.5)10 (4.9)0 (0.0)0 (0.0)3 (1.5)0 (0.0)0 (0.0)0 (0.0)0 (0.0)0 (0.0)0 (0.0)1 (0.8)0 (0.0)0 (0.0) 65–705 (2.5)27 (13.2)3 (1.5)0 (0.0)12 (5.9)3 (1.5)4 (2.0)3 (2.3)2 (1.5)1 (0.8)0 (0.0)15 (11.3)0 (0.0)0 (0.0) 71–800 (0.0)38 (18.6)4 (2.0)0 (0.0)20 (9.8)8 (3.9)5 (2.5)6 (4.5)15 (11.3)2 (1.5)1 (0.8)36 (27.1)3 (2.3)7 (5.3) 81–900 (0.0)4 (2.0)0 (0.0)0 (0.0)2 (1.0)2 (1.0)2 (1.0)0 (0.0)3 (2.3)1 (0.8)0 (0.0)16 (12.0)0 (0.0)1 (0.8) ≥910 (0.0)0 (0.0)0 (0.0)0 (0.0)0 (0.0)0 (0.0)1 (0.5)0 (0.0)1 (0.8)1 (0.8)0 (0.0)0 (0.0)0 (0.0)0 (0.0) Sex Male2 (1.0)41 (20.1)4 (2.0)0 (0.0)19 (9.3)11 (5.4)4 (2.0)7 (5.3)19 (14.3)5 (3.8)1 (0.8)56 (42.1)3 (2.3)8 (6.0) Female4 (2.0)38 (18.6)3 (1.5)0 (0.0)18 (8.8)2 (1.0)8 (3.9)2 (1.5)2 (1.5)0 (0.0)0 (0.0)12 (9.0)0 (0.0)0 (0.0) Values are presented as number (%).
Supplementary Table 14. Preferred person to receive sexual health education for low-risk group and high-risk group
Low-risk group (n=204) High-risk group (n=133)
Doctor/
nurse Counseling
center Family Friend Etc. Doctor/
nurse Counseling
center Family Friend Etc.
Age (y)
60–64 7 (3.4) 7 (3.4) 0 (0.0) 1 (0.5) 0 (0.0) 1 (0.8) 0 (0.0) 0 (0.0) 0 (0.0) 0 (0.0)
65–70 21 (10.3) 24 (11.8) 0 (0.0) 1 (0.5) 1 (0.5) 14 (10.5) 7 (5.3) 0 (0.0) 0 (0.0) 0 (0.0) 71–80 39 (19.1) 32 (15.7) 1 (0.5) 1 (0.5) 4 (2.0) 40 (30.1) 22 (16.5) 0 (0.0) 2 (1.5) 6 (4.5)
81–90 5 (2.5) 6 (2.9) 0 (0.0) 0 (0.0) 2 (1.0) 17 (12.8) 5 (3.8) 0 (0.0) 2 (1.5) 1 (0.8)
≥91 0 (0.0) 0 (0.0) 0 (0.0) 0 (0.0) 1 (0.5) 1 (0.8) 1 (0.8) 0 (0.0) 0 (0.0) 0 (0.0)
Sex
Male 38 (18.6) 35 (17.2) 1 (0.5) 2 (1.0) 4 (2.0) 63 (47.4) 29 (21.8) 0 (0.0) 4 (3.0) 7 (5.3) Female 34 (16.7) 34 (16.7) 0 (0) 1 (0.5) 4 (2.0) 10 (7.5) 6 (4.5) 0 (0.0) 0 (0.0) 0 (0.0) Values are presented as number (%).