D I A B E T E S & M E T A B O L I S M J O U R N A L D I A B E T E S & M E T A B O L I S M J O U R N A L
This is an Open Access article distributed under the terms of the Creative Commons Attribution Non-Commercial License (http://creativecommons.org/licenses/by-nc/4.0/) which permits unrestricted non-commercial use, distribution, and reproduction in any medium, provided the original work is properly cited.
Progression to Gestational Diabetes Mellitus in Pregnant Women with One Abnormal Value in Repeated Oral Glucose Tolerance Tests
Sunyoung Kang1, Min Hyoung Kim2, Moon Young Kim2, Joon-Seok Hong3, Soo Heon Kwak1,4, Sung Hee Choi4,5, Soo Lim4,5, Kyong Soo Park1,4, Hak C. Jang4,5
1Department of Internal Medicine, Seoul National University Hospital, Seoul National University College of Medicine, Seoul,
2Department of Obstetrics and Gynecology, Cheil General Hospital & Women’s Healthcare Center, Dankook University College of Medicine, Seoul,
3Department of Obstetrics and Gynecology, Seoul National University Bundang Hospital, Seoul National University College of Medicine, Seongnam,
4Department of Internal Medicine, Seoul National University College of Medicine, Seoul,
5Department of Internal Medicine, Seoul National University Bundang Hospital, Seoul National University College of Medicine, Seongnam, Korea
Background: Women with one abnormal value (OAV) in a 100 g oral glucose tolerance test (OGTT) during pregnancy are re- ported to have an increased risk of adverse pregnancy outcomes. However, there is limited data about whether women with OAV will progress to gestational diabetes mellitus (GDM) when the OGTT is repeated.
Methods: To identify clinical and metabolic predictors for GDM in women with OAV, we conducted a retrospective study and identified women with OAV in the OGTT done at 24 to 30 weeks gestational age (GA) and repeated the second OGTT between 32 and 34 weeks of GA.
Results: Among 137 women with OAV in the initial OGTT, 58 (42.3%) had normal, 40 (29.2%) had OAV and 39 (28.5%) had GDM in the second OGTT. Maternal age, prepregnancy body mass index, weight gain from prepregnancy to the second OGTT, GA at the time of the OGTT, and parity were similar among normal, OAV, and GDM groups. Plasma glucose levels in screening tests were different (151.8±15.7, 155.8±14.6, 162.5±20.3 mg/dL, P<0.05), but fasting, 1-, 2-, and 3-hour glucose levels in the ini- tial OGTT were not. Compared to women with screen negative, women with untreated OAV had a higher frequency of macroso- mia.Conclusion: We demonstrated that women with OAV in the initial OGTT significantly progressed to GDM in the second OGTT.
Clinical parameters predicting progression to GDM were not found. Repeating the OGTT in women with OAV in the initial test may be helpful to detect GDM progression.
Keywords: Diabetes, gestational; Glucose tolerance test; Pregnancy outcome
Corresponding authors: Hak C. Jang https://orcid.org/0000-0002-4188-6536 Department of Internal Medicine, Seoul National University Bundang Hospital, Seoul National University College of Medicine, 82 Gumi-ro 173beon-gil, Bundang-gu, Seongnam 13620, Korea
E-mail: [email protected]
Moon Young Kim https://orcid.org/0000-0001-8881-2027
Department of Obstetrics and Gynecology, Cheil General Hospital & Women’s Healthcare Center, Dankook University College of Medicine, 17 Seoae-ro 1-gil, Jung-gu, Seoul 04619, Korea
INTRODUCTION
Gestational diabetes mellitus (GDM) is defined as any degree of glucose intolerance with the first recognition during preg-
nancy, regardless of whether the condition started before preg- nancy or not [1]. Because of the recent obesity epidemic and the increase in type 2 diabetes mellitus in general, there has been an increase in undiagnosed type 2 diabetes mellitus in https://doi.org/10.4093/dmj.2018.0159
pISSN 2233-6079 · eISSN 2233-6087
women of childbearing age [2]. Therefore, the International Association of the Diabetes and Pregnancy Study Groups (IADPSG) recommends that women diagnosed with diabetes, according to the diagnostic criteria in the first trimester, should be classified as having overt diabetes [3]. It has been reported that approximately 6% to 9% of pregnancies are complicated by GDM [4], and it is well-known that women with GDM have an increased risk of preeclampsia, Caesarean delivery, and pre- term delivery [5]. GDM also increases the risk of perinatal morbidities including macrosomia, large for gestational age (LGA), neonatal hypoglycemia, neonatal hyperbilirubinemia, and respiratory distress syndrome [6]. Tight control of blood sugar during pregnancy and labor significantly reduces these risks [7].
However, there is no consensus for the universal diagnostic tests and threshold values for GDM diagnosis. Currently, GDM is diagnosed by either a one-step or two-step approach [8]. The prevalence of GDM significantly changes according to the criteria used to diagnose it. Different diagnostic criteria may lead to different numbers of pregnant women identified as at risk and to different pregnancy outcomes.
A recent systematic review showed that women with one ab- normal value (OAV) in a 100 g oral glucose tolerance test (OGTT) had a significantly increased risk of adverse pregnan- cy outcomes, which is comparable to women with GDM [9].
The American College of Obstetricians and Gynecologists (ACOG) mentioned that OAV, as opposed to two abnormal values, might be used for the diagnosis of GDM [6]. Kim et al.
[10] reported that Korean women with a 1 hour OAV in a 100 g OGTT showed increased adverse pregnancy outcomes com- pared with women with normal OGTT, or 2 or 3 hours OAV.
Even though GDM is detected using different diagnostic cri- teria, we may still need another approach to identify patients with GDM who need appropriate treatment. Considering the low reproducibility of OGTTs [11,12] and the increase of insu- lin resistance during pregnancy, some women with OAV may progress to having GDM when re-tested.
In this study, we first evaluated the incidence of GDM when the OGTT was re-tested in pregnant women with OAV in the initial OGTT. Second, we evaluated potential clinical and met- abolic predictors for GDM development in women with OAV.
METHODS
This study is a retrospective observational study. This study
was approved by the Institutional Review Board (IRB) of Seoul National University Bundang Hospital (B-1808/486-105). In- formed consent was waived by the IRB. We collected patient data from Cheil General Hospital & Women’s Healthcare Cen- ter. Since 1991, pregnant women have been screened for GDM at 24 to 28 weeks, as recommended by the Third International Workshop-Conference on Gestational Diabetes Mellitus [13].
If the plasma glucose levels measured 1 hour after the 50 g oral glucose challenge tests (GCT) in pregnant women were greater than or equal to 130 mg/dL, they were scheduled for a 100 g OGTT before 30 weeks. Women who had OAV in the first OGTT were recommended for re-testing at 32 to 34 weeks.
From January 1996 to June 1997 we identified 149 women with OAV in the first OGTT. However, nine women performed the first OGTT after 30 weeks, and three women refused to do the second OGTT. Thus, 137 women were enrolled in this study.
All pregnant women scheduled for an OGTT were instruct- ed to consume a normal diet containing at least 150 g of carbo- hydrates per day for 3 days, and to perform usual physical ac- tivities. They were encouraged to sit quietly throughout the test, and they were not allowed to eat, drink, and smoke. Glu- cose tolerance tests were done between 8:00 AM to 9:00 AM, after overnight fasts of at least 8 hours, but no more than 14 hours. After fasting, blood samples were obtained, and the women were instructed to drink a 100 g glucose solution with- in 5 minutes. Blood samples were drawn 1, 2, and 3 hours after glucose intake. Plasma glucose levels were measured with a YSI 2300-STAT glucose analyzer (Yellow Springs Instrument Co., Yellow Springs, OH, USA). Plasma insulin concentrations were measured using a Human Specific Radioimmunoassay Kit (Linco Research Inc., St. Louis, MO, USA). The intra-assay variance of insulin was 4.5%, and the inter-assay variance of insulin was 8.9%.
Based on the results of the second OGTT (32 to 34 weeks), we classified pregnant women who had OAV in the first OGTT into three groups: normal, OAV, and GDM. The wom- en were considered to have OAV if one glucose value was great- er than or equal to the following values: fasting, 105 mg/dL; 1 hour, 190 mg/dL; 2 hours, 165 mg/dL; and 3 hours, 145 mg/dL.
A GDM diagnosis was made if two or more glucose levels met or exceeded the cutoff values [13]. Insulin secretion was as- sessed using the insulinogenic index at 60 minutes (IGI60) and the oral dispositional index (ODI). Insulin sensitivity was eval- uated using the Matsuda insulin sensitivity index (ISI). IGI60 was calculated as follows: [insulin (60 minutes)−insulin (0
minute)]/[glucose (60 minutes)−glucose (0 minute)] [14]. The Matsuda ISI was calculated as follows: 10,000/√(fasting glucose×fasting insulin×mean glucose×mean insulin) [15].
The ODI was calculated as follows: IGI60×ISI of Matsuda [16].
Neonatal and pregnancy outcomes were evaluated using the following parameters: gestational age (GA) at delivery, birth weight, Apgar score, and other perinatal complications. LGA was defined as a birth weight greater than or equal to the 90th percentile for that GA [17]. Macrosomia was defined as a new- born weighing more than 4,000 g at birth.
The women who developed GDM, as determined by the re- sults of the second OGTT, were managed with medical nutri- tional therapy and exercise [5]. If maternal hyperglycemia per- sisted after diet and exercise therapy, insulin therapy was add- ed. However, we did not provide any medical advice or treat- ment to women with the result of normal and OAV in the sec- ond OGTT.
We analyzed clinical characteristics, results of the first OGTT, and pregnancy outcomes using IBM SPSS Statistics version 22.0 (IBM Corp., Armonk, NY, USA). Continuous variables were analyzed with the analysis of variance (ANO-
VA) test (normally distributed data) and the Kruskal-Wallis test (non-normally distributed data). Normally distributed data were expressed as mean±SD, and Turkey’s method was used for post hoc analysis. Non-normally distributed data were expressed as median and a 95% confidence interval, and a Mann-Whitney test was used for post hoc analysis. Categorical data were compared using the chi-square test and expressed in percentages. To compare the pregnancy outcomes of the three groups (normal, OAV, and GDM) with those of the screen- negative group, which was characterized in our previous article [18], we used a two-sample t-test (R program version 3.4.0). P values less than 0.05% were considered significant.
RESULTS
Among 137 pregnant women with OAV in the first OGTT, 39 women (28.5%) progressed to being diagnosed with GDM in the second OGTT, done between 32 to 34 weeks. Still 29.2% of the women maintained their OAV status, and the rest (42.3%) recovered and exhibited a normal glucose tolerance status.
Clinical characteristics of the three groups, classified by the
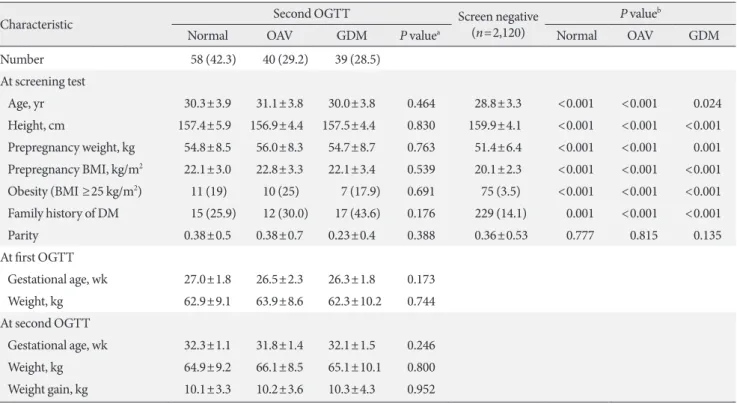
Table 1. Clinical characteristics of study subjects according to the results of the second oral glucose tolerance test
Characteristic Second OGTT Screen negative
(n=2,120)
P valueb
Normal OAV GDM P valuea Normal OAV GDM
Number 58 (42.3) 40 (29.2) 39 (28.5)
At screening test
Age, yr 30.3±3.9 31.1±3.8 30.0±3.8 0.464 28.8±3.3 <0.001 <0.001 0.024
Height, cm 157.4±5.9 156.9±4.4 157.5±4.4 0.830 159.9±4.1 <0.001 <0.001 <0.001 Prepregnancy weight, kg 54.8±8.5 56.0±8.3 54.7±8.7 0.763 51.4±6.4 <0.001 <0.001 0.001 Prepregnancy BMI, kg/m2 22.1±3.0 22.8±3.3 22.1±3.4 0.539 20.1±2.3 <0.001 <0.001 <0.001 Obesity (BMI ≥25 kg/m2) 11 (19) 10 (25) 7 (17.9) 0.691 75 (3.5) <0.001 <0.001 <0.001 Family history of DM 15 (25.9) 12 (30.0) 17 (43.6) 0.176 229 (14.1) 0.001 <0.001 <0.001
Parity 0.38±0.5 0.38±0.7 0.23±0.4 0.388 0.36±0.53 0.777 0.815 0.135
At first OGTT
Gestational age, wk 27.0±1.8 26.5±2.3 26.3±1.8 0.173
Weight, kg 62.9±9.1 63.9±8.6 62.3±10.2 0.744
At second OGTT
Gestational age, wk 32.3±1.1 31.8±1.4 32.1±1.5 0.246
Weight, kg 64.9±9.2 66.1±8.5 65.1±10.1 0.800
Weight gain, kg 10.1±3.3 10.2±3.6 10.3±4.3 0.952
Values are presented as number (%) or mean±standard deviation.
OGTT, oral glucose tolerance test; OAV, one abnormal value; GDM, gestational diabetes mellitus; BMI, body mass index; DM, diabetes mellitus.
aP for comparison among the three groups, bP for comparison between Screen negative group and each three group.
results of the second OGTT, were not statistically different at the time of the screening test, and the first and second OGTT.
As shown in Table 1, maternal age, height, weight, prepregnan- cy body mass index (BMI), and parity were very similar among the three groups. The frequencies of obese women, as defined by a BMI greater than or equal to 25 kg/m2, were 19% in the normal, 25% in the OAV, and 17.9% in the GDM group. Dif- ferences in obesity among the three groups were not signifi- cant. The frequencies of the first-degree family history of dia- betes mellitus were 43.6% in the GDM group, 30% in the OAV group, and 25.9% in the normal group, but these differences were not statistically significant. Compared with the screen- negative group, each of the three groups had significantly higher frequencies of obesity and family history of diabetes.
The maternal age, weight, and prepregnancy BMI of the three groups were also significantly higher than those of the screen- negative group. GA and maternal weight at the time of the first and second OGTTs were similar among the three groups.
There was also no difference in weight gain from prepregnancy
up until the time of the second OGTT.
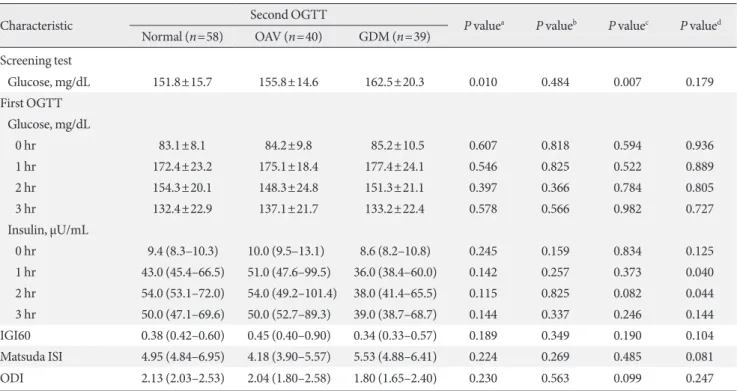
Table 2 denotes plasma glucose concentrations of the GCT and the first OGTT in the three groups, classified by the result of the second OGTT. Plasma glucose concentrations of the GCT were highest in the GDM, intermediate in the OAV, and lowest in the normal group. Fasting, 1, 2, and 3 hours glucose concentrations of the first OGTT were not significantly differ- ent among the three groups. However, the mean glucose levels at fasting and at 1 hour increased for each group in order from normal to OAV and GDM group.
We also compared the insulin response measured in the first OGTT among the three groups. Mean insulin concentrations 1 hour after glucose intake were highest in the OAV, interme- diate in the normal, and lowest in the GDM group, but they were not statistically different. Insulin concentrations 1 and 2 hours after glucose intake in the GDM group were significantly lower compared with those in the OAV group. The IGI60 and Matsuda ISI levels were not different among the three groups.
The ODI, a composite index of insulin secretion for insulin re- Table 2. Metabolic characteristics of study subjects according to the results of the second oral glucose tolerance test
Characteristic Second OGTT
P valuea P valueb P valuec P valued Normal (n=58) OAV (n=40) GDM (n=39)
Screening test
Glucose, mg/dL 151.8±15.7 155.8±14.6 162.5±20.3 0.010 0.484 0.007 0.179
First OGTT Glucose, mg/dL
0 hr 83.1±8.1 84.2±9.8 85.2±10.5 0.607 0.818 0.594 0.936
1 hr 172.4±23.2 175.1±18.4 177.4±24.1 0.546 0.825 0.522 0.889
2 hr 154.3±20.1 148.3±24.8 151.3±21.1 0.397 0.366 0.784 0.805
3 hr 132.4±22.9 137.1±21.7 133.2±22.4 0.578 0.566 0.982 0.727
Insulin, μU/mL
0 hr 9.4 (8.3–10.3) 10.0 (9.5–13.1) 8.6 (8.2–10.8) 0.245 0.159 0.834 0.125
1 hr 43.0 (45.4–66.5) 51.0 (47.6–99.5) 36.0 (38.4–60.0) 0.142 0.257 0.373 0.040
2 hr 54.0 (53.1–72.0) 54.0 (49.2–101.4) 38.0 (41.4–65.5) 0.115 0.825 0.082 0.044
3 hr 50.0 (47.1–69.6) 50.0 (52.7–89.3) 39.0 (38.7–68.7) 0.144 0.337 0.246 0.144
IGI60 0.38 (0.42–0.60) 0.45 (0.40–0.90) 0.34 (0.33–0.57) 0.189 0.349 0.190 0.104
Matsuda ISI 4.95 (4.84–6.95) 4.18 (3.90–5.57) 5.53 (4.88–6.41) 0.224 0.269 0.485 0.081
ODI 2.13 (2.03–2.53) 2.04 (1.80–2.58) 1.80 (1.65–2.40) 0.230 0.563 0.099 0.247
Values are presented as mean±standard deviation or median (95% confidence interval). In normally distributed data, Tukey’s method was used for post hoc analysis. In non-normally distributed data, Mann-Whitney test was used for post hoc analysis.
OGTT, oral glucose tolerance test; OAV, one abnormal value; GDM, gestational diabetes mellitus; IGI60, insulinogenic index at 60 minutes; ISI, insulin sensitivity index; ODI, oral dispositional index.
aP for analysis of variance (ANOVA) in normally distributed data, P for Kruskal-Wallis in non-normally distributed data, bNormal vs. OAV,
cNormal vs. GDM, dOAV vs. GDM.
sistance, was also not different among the three groups.
Finally, we compared pregnancy outcomes among the three groups, and we also compared these outcomes with those of the screen-negative group (Table 3). There were no differences in GA at delivery, Apgar scores, and birth weight among the three groups. The frequencies of LGA, macrosomia, preterm delivery, and other adverse pregnancy outcomes, such as pri- mary Caesarean section and preeclampsia, or pregnancy-in- duced hypertension, were comparable among the three groups.
When we compared the pregnancy outcomes of the three groups with those of the screen-negative group, the mean GA at delivery was earlier in the normal and GDM groups, but similar in the OAV group. Mean birth weight of the OAV group was higher than that of the screen-negative group. The mean Apgar score at 5 minutes from birth of the three groups was significantly lower than that of the screen-negative group. LGA frequencies in the normal, OAV, and GDM groups were about two times higher than those in the screen-negative group. Mac- rosomia frequency was 12.8% in the OAV group, which was significantly higher than in the screen-negative group. The fre- quency of preterm delivery in the normal group was higher than that in the screen-negative group, and the frequencies of total Caesarian section in each of the three groups were about
two times higher than those in the screen-negative group.
DISCUSSION
Of the 137 women who had OAV in the OGTT performed be- tween 24 to 30 weeks, 28.5% had developed GDM as detected by a second OGTT performed between 32 to 34 weeks. The GDM group showed higher glucose levels in the GCT com- pared with the normal group. The GDM group also had signif- icantly decreased insulin levels at the 1 and 2 hours of first OGTT compared to the levels in the OAV group. These results suggest that β-cell dysfunction might be associated with the development of GDM in women with OAV. Previous studies demonstrated that women who had limited β-cell capacity for compensating increased insulin resistance during pregnancy were likely to develop GDM [19,20]. In addition, we also found that Korean women with previous GDM, who showed normal glucose tolerance after delivery, had lower β-cell secretory ca- pacity compared with women without GDM [21].
However, there was no difference in the IGI60 and ODI lev- els among the three groups in this study. Although there is some controversy about the insulinogenic index at 30 minutes (IGI30) as a valid test method [14,22,23], IGI30 and ODI are Table 3. Pregnancy outcomes in study subjects according to the results of the second oral glucose tolerance test
Variable Second OGTT Screen negative
(n=2,120)
P valueb
Normal (n=58) OAV (n=40) GDM (n=39) P valuea Normal OAV GDM
GA at delivery, wk 39.0±1.7 39.6±1.5 39.0±1.5 0.154 39.5±1.5 0.012 0.676 0.039
Apgar score (1 min) 8.11±1.2 8.21±0.7 8.25±1.5 0.860 8.5±1.0 0.003 0.068 0.126
Apgar score (5 min) 9.25±0.9 9.28±0.7 9.41±0.8 0.687 9.7±0.7 <0.001 <0.001 0.011
Low Apgar score (1 min)c 1 (1.9) 0 1 (3.1) 0.570
Low Apgar score (5 min)c 1 (1.9) 0 0 0.509
Birth weight, g 3,402±554 3,494±406 3,420±450 0.657 3,301±450 0.093 <0.001 0.102
LGA 16 (27.6) 12 (30.0) 10 (25.6) 0.900 287 (13.5) 0.002 0.003 <0.001
Macrosomiad 5 (9.4) 5 (12.8) 3 (8.6) 0.808 106 (5.0) 0.148 0.028 0.338
Preterm delivery (<37 wk) 7 (12.7) 2 (5.1) 3 (8.3) 0.445 71 (3.3) <0.001 0.542 0.103
Preeclampsia or PIH 2 (3.6) 0 1 (2.8) 0.500 9 (0.4) <0.001 - 0.039
Total C-sectione 32 (58.2) 21 (53.8) 21 (58.3) 0.898 642 (30.3) <0.001 0.002 <0.001
Primary C-section 19 (34.5) 13 (33.3) 15 (41.7) 0.715
Values are presented as mean±standard deviation or number (%).
OGTT, oral glucose tolerance test; OAV, one abnormal value; GDM, gestational diabetes mellitus; GA, gestational age; LGA, large for gestational age; PIH, pregnancy induced hypertension.
aP for comparison among the three groups: normal, OAV, GDM classified by the results of second OGTT, bP for comparison between Screen negative group and each three group, cLow Apgar score, defined as Apgar score <7, dMacrosomia, defined as birth weight >4,000 g, eTotal C- section, the composite of primary and repeat Caesarian section.
widely used for clinical assessment of β-cell function. One study showed that IGI60 from the OGTT might be used as a surrogate for IGI30 [24], but further studies are needed to vali- date IGI60 as an assessment method for the β-cell function.
Currently, GDM is diagnosed with either a one-step or two- step approach [8]. The two-step approach is based on a screen- ing test using a 50 g GCT followed by a 3-hour, 100 g OGTT.
GDM is diagnosed when at least two abnormal glucose values are detected in the 3-hour OGTT. In 2010, the IADPSG rec- ommended the use of a one-step 75 g OGTT to diagnose GDM. The diagnostic threshold for GDM was based on glu- cose levels which increased the risk for adverse pregnancy out- come 1.75 times, as determined in the Hyperglycemia and Ad- verse Pregnancy Outcome (HAPO) study [3]. However, the one-step approach was expected to increase the incidence of GDM about three times (from 5%–6% to 15%–20%) [25]. In 2013, the National Institutes of Health (NIH) recommended the use of the two-step approach, since clinical data supporting the benefits and cost effectiveness of the one-step strategy were lacking [26]. The two-step approach has different cutoffs for the 3-hour OGTT. The diagnostic thresholds suggested by Carpenter and Coustan are lower than those suggested by the National Diabetes Data Group (NDDG), which results in an increase of GDM incidences by 50% compared with the for- mer threshold [27]. As different diagnostic criteria predict dif- ferent degrees of maternal and fetal risk, experts are still debat- ing about the appropriate diagnostic thresholds.
The ACOG has supported the two-step approach, but it re- cently mentioned that one elevated glucose value in the 100 g OGTT might be sufficient to diagnose GDM [6]. There are several previous studies about the significance of OAV, and some studies reported that women with OAV had a higher risk of adverse maternal and neonatal outcomes compared with women with normal OGTT [9,10,28]. However, if we followed the ACOG suggestion, the incidences of GDM would signifi- cantly increase, and some pregnant women may not actually need intensive GDM treatment.
Pregnancy is characterized by increased insulin resistance caused by placental hormones, such as progesterone, cortisol, placental lactogen, prolactin, and growth hormone [29]. Con- sidering that insulin resistance continuously increases from the second trimester to late pregnancy, performing a second OGTT on women with OAV in the first OGTT may help to detect women with GDM who need intensive treatment. How- ever, in this study, we could not find out clinical predictors for
progressing GDM in women with OAV, which makes repeat- ing the OGTT more necessary to diagnose GDM.
In this study, macrosomia frequency was significantly higher in the OAV group compared with the screen-negative group.
However, all three groups showed increased frequencies of LGA and total Caesarian section, and lower Apgar score at 5 minutes after birth compared with the screen-negative group.
There is no consensus as to whether women with OAV should be managed similarly to women with GDM or not. Berkus and Langer [30] and Langer et al. [31] compared perinatal out- comes of normal OGTT group, OAV group, and GDM group that received treatment. The OAV group showed a high inci- dence of large infants (macrosomia and LGA) and neonatal complications compared with the normal group and the GDM group with treatment [30,31]. Another study showed different results. Forest et al. [32] compared the perinatal outcomes be- tween four groups: normal, OAV women with treatment, OAV women without treatment, and the GDM group. There was no statistical difference in the perinatal outcomes among OAV women with treatment, OAV women without treatment, and women with a normal OGTT [32]. In our study, women with treated GDM diagnosed in the second OGTT had lower inci- dences of macrosomia compared with OAV group who had untreated. This result supports the premise that women with OAV may benefit from repeating the OGTT, which can diag- nose cases of GDM in women who need treatment to reduce maternal and perinatal complications.
This study has several limitations. First, it is a retrospective study, and the pregnancy outcomes of the screen-negative group were obtained from our previous study. Even though the data of pregnancy outcomes were obtained from the same hospital, there was a 3-year time difference between testing the women with OAV and the screen-negative group. Second, the number of women with OAV may not have been enough to compare pregnancy outcomes in a statistically significant manner.
In conclusion, this study showed that a significant propor- tion of women with OAV in the OGTT, done prior to 30 weeks of GA, developed GDM as diagnosed by a second OGTT, done between 32 to 34 weeks. Thus, repeating the OGTT can be helpful to determine GDM in women with OAV.
CONFLICTS OF INTEREST
No potential conflict of interest relevant to this article was re- ported.
AUTHOR CONTRIBUTIONS
Conception or design: M.Y.K., S.H.K., H.C.J.
Acquisition, analysis, or interpretation of data: S.K., M.H.K., J.S.H., S.H.K., S.H.C., S.L.
Drafting the work or revising: S.K., M.Y.K., S.H.K., K.S.P., H.C.J.
Final approval of the manuscript: S.K., M.H.K., M.Y.K., J.S.H., S.H.K., S.H.C., S.L., K.S.P., H.C.J.
ORCID
Sunyoung Kang https://orcid.org/0000-0002-7705-6614 Moon Young Kim https://orcid.org/0000-0001-8881-2027 Hak C. Jang https://orcid.org/0000-0002-4188-6536
ACKNOWLEDGMENTS
We really thank to obstetricians of Cheil General Hospital &
Women’s Healthcare Center for their contributions.
REFERENCES
1. Report of the expert committee on the diagnosis and classifica- tion of diabetes mellitus. Diabetes Care 1997;20:1183-97.
2. Lawrence JM, Contreras R, Chen W, Sacks DA. Trends in the prevalence of preexisting diabetes and gestational diabetes mellitus among a racially/ethnically diverse population of pregnant women, 1999-2005. Diabetes Care 2008;31:899-904.
3. International Association of Diabetes and Pregnancy Study Groups Consensus Panel, Metzger BE, Gabbe SG, Persson B, Buchanan TA, Catalano PA, Damm P, Dyer AR, Leiva Ad, Hod M, Kitzmiler JL, Lowe LP, McIntyre HD, Oats JJ, Omori Y, Schmidt MI. International association of diabetes and preg- nancy study groups recommendations on the diagnosis and classification of hyperglycemia in pregnancy. Diabetes Care 2010;33:676-82.
4. DeSisto CL, Kim SY, Sharma AJ. Prevalence estimates of gesta- tional diabetes mellitus in the United States, Pregnancy Risk Assessment Monitoring System (PRAMS), 2007-2010. Prev Chronic Dis 2014;11:E104.
5. Jang HC, Cho NH, Min YK, Han IK, Jung KB, Metzger BE. In- creased macrosomia and perinatal morbidity independent of maternal obesity and advanced age in Korean women with GDM. Diabetes Care 1997;20:1582-8.
6. Committee on Practice Bulletins Obstetrics. Practice Bulletin No. 180: gestational diabetes mellitus. Obstet Gynecol 2017;
130:e17-37.
7. Hartling L, Dryden DM, Guthrie A, Muise M, Vandermeer B, Donovan L. Benefits and harms of treating gestational diabetes mellitus: a systematic review and meta-analysis for the U.S.
Preventive Services Task Force and the National Institutes of Health Office of Medical Applications of Research. Ann Intern Med 2013;159:123-9.
8. American Diabetes Association. 2. Classification and diagnosis of diabetes: standards of medical care in diabetes-2018. Diabe- tes Care 2018;41:S13-27.
9. Roeckner JT, Sanchez-Ramos L, Jijon-Knupp R, Kaunitz AM.
Single abnormal value on 3-hour oral glucose tolerance test during pregnancy is associated with adverse maternal and neo- natal outcomes: a systematic review and metaanalysis. Am J Obstet Gynecol 2016;215:287-97.
10. Kim HS, Chang KH, Yang JI, Yang SC, Lee HJ, Ryu HS. Clinical outcomes of pregnancy with one elevated glucose tolerance test value. Int J Gynaecol Obstet 2002;78:131-8.
11. Catalano PM, Avallone DA, Drago NM, Amini SB. Reproduc- ibility of the oral glucose tolerance test in pregnant women.
Am J Obstet Gynecol 1993;169:874-81.
12. Munang YN, Noubiap JJ, Danwang C, Sama JD, Azabji-Ken- fack M, Mbanya JC, Sobngwi E. Reproducibility of the 75 g oral glucose tolerance test for the diagnosis of gestational dia- betes mellitus in a sub-Saharan African population. BMC Res Notes 2017;10:622.
13. Metzger BE. Summary and recommendations of the Third In- ternational Workshop-Conference on Gestational Diabetes Mellitus. Diabetes 1991;40 Suppl 2:197-201.
14. Stumvoll M, Mitrakou A, Pimenta W, Jenssen T, Yki-Jarvinen H, Van Haeften T, Renn W, Gerich J. Use of the oral glucose tolerance test to assess insulin release and insulin sensitivity.
Diabetes Care 2000;23:295-301.
15. Matsuda M, DeFronzo RA. Insulin sensitivity indices obtained from oral glucose tolerance testing: comparison with the eug- lycemic insulin clamp. Diabetes Care 1999;22:1462-70.
16. Abdul-Ghani MA, Williams K, DeFronzo RA, Stern M. What is the best predictor of future type 2 diabetes? Diabetes Care 2007;30:1544-8.
17. Korean Pediatric Society. Normal value of Korean children.
Seoul: Medical Culture History; 1992.
18. Jang HC, Cho YM, Park KS, Kim SY, Lee HK, Kim MY, Yang JH, Shin SM. Pregnancy outcome in Korean women with ges-
tational diabetes mellitus diagnosed by the Carpenter-Coustan criteria. J Korean Diabetes Assoc 2004;28:122-30.
19. Catalano PM, Huston L, Amini SB, Kalhan SC. Longitudinal changes in glucose metabolism during pregnancy in obese women with normal glucose tolerance and gestational diabetes mellitus. Am J Obstet Gynecol 1999;180:903-16.
20. Buchanan TA, Xiang AH. Gestational diabetes mellitus. J Clin Invest 2005;115:485-91.
21. Lim S, Choi SH, Park YJ, Park KS, Lee HK, Jang HC, Cho NH, Metzger BE. Visceral fatness and insulin sensitivity in women with a previous history of gestational diabetes mellitus. Diabe- tes Care 2007;30:348-53.
22. Phillips DI, Clark PM, Hales CN, Osmond C. Understanding oral glucose tolerance: comparison of glucose or insulin mea- surements during the oral glucose tolerance test with specific measurements of insulin resistance and insulin secretion. Dia- bet Med 1994;11:286-92.
23. Hanson RL, Pratley RE, Bogardus C, Narayan KM, Roumain JM, Imperatore G, Fagot-Campagna A, Pettitt DJ, Bennett PH, Knowler WC. Evaluation of simple indices of insulin sensitivity and insulin secretion for use in epidemiologic studies. Am J Epidemiol 2000;151:190-8.
24. Tura A, Kautzky-Willer A, Pacini G. Insulinogenic indices from insulin and C-peptide: comparison of beta-cell function from OGTT and IVGTT. Diabetes Res Clin Pract 2006;72:298-301.
25. Sacks DA, Hadden DR, Maresh M, Deerochanawong C, Dyer AR, Metzger BE, Lowe LP, Coustan DR, Hod M, Oats JJ, Pers- son B, Trimble ER; HAPO Study Cooperative Research Group.
Frequency of gestational diabetes mellitus at collaborating cen-
ters based on IADPSG consensus panel-recommended crite- ria: the Hyperglycemia and Adverse Pregnancy Outcome (HAPO) Study. Diabetes Care 2012;35:526-8.
26. Vandorsten JP, Dodson WC, Espeland MA, Grobman WA, Guise JM, Mercer BM, Minkoff HL, Poindexter B, Prosser LA, Sawaya GF, Scott JR, Silver RM, Smith L, Thomas A, Tita AT.
NIH consensus development conference: diagnosing gesta- tional diabetes mellitus. NIH Consens State Sci Statements 2013;29:1-31.
27. Ferrara A, Hedderson MM, Quesenberry CP, Selby JV. Preva- lence of gestational diabetes mellitus detected by the national diabetes data group or the Carpenter and Coustan plasma glu- cose thresholds. Diabetes Care 2002;25:1625-30.
28. Gruendhammer M, Brezinka C, Lechleitner M. The number of abnormal plasma glucose values in the oral glucose tolerance test and the feto-maternal outcome of pregnancy. Eur J Obstet Gynecol Reprod Biol 2003;108:131-6.
29. Buchanan TA, Xiang AH, Page KA. Gestational diabetes melli- tus: risks and management during and after pregnancy. Nat Rev Endocrinol 2012;8:639-49.
30. Berkus MD, Langer O. Glucose tolerance test: degree of glucose abnormality correlates with neonatal outcome. Obstet Gynecol 1993;81:344-8.
31. Langer O, Brustman L, Anyaegbunam A, Mazze R. The signifi- cance of one abnormal glucose tolerance test value on adverse outcome in pregnancy. Am J Obstet Gynecol 1987;157:758-63.
32. Forest JC, Masse J, Garrido-Russo M. Glucose tolerance test during pregnancy: the significance of one abnormal value. Clin Biochem 1994;27:299-304.