• 검색 결과가 없습니다.

The Neurocognitive Function and Neuroimaging Characteristics between Age-Associated Memory Impairment and Mild Cognitive Impairment

N/A
N/A
Protected

Academic year: 2021

Share "The Neurocognitive Function and Neuroimaging Characteristics between Age-Associated Memory Impairment and Mild Cognitive Impairment"

Copied!
8
0
0

로드 중.... (전체 텍스트 보기)

전체 글

(1)

Received February 1, 2019; revised March 19, 2019; accepted April 4, 2019.

Corresponding author: Ji-Won Lee, Department of Family Medicine, Gangnam Severance Hospital, Yonsei University College of Medicine, 211 Eonju-ro, Gangnam-gu, Seoul 06273, Korea. E-mail: [email protected]

Copyright Ⓒ 2019 The Korean Academy of Clinical Geriatrics

This is an open access article distributed under the term s of the Creative Com m ons Attribution Non-Com m ercial License (http://creativecom m ons.org/licenses/by-nc/4.0) which perm its unrestricted non-com m ercial use, distribution, and reproduction in any m edium , provided the original work is properly cited.

The Neurocognitive Function and Neuroimaging Characteristics between Age-Associated Memory Impairment and Mild Cognitive Impairment

Ji-Hye Kim

1,2

, Ji-Won Lee

3

1

Department of Family Medicine, Yonsei University College of Medicine, Seoul, Korea;

2

Department of Health promotion, Severance Check-up, Seoul, Korea;

3

Department of Family Medicine, Gangnam Severance Hospital, Yonsei University College of Medicine, Seoul, Korea

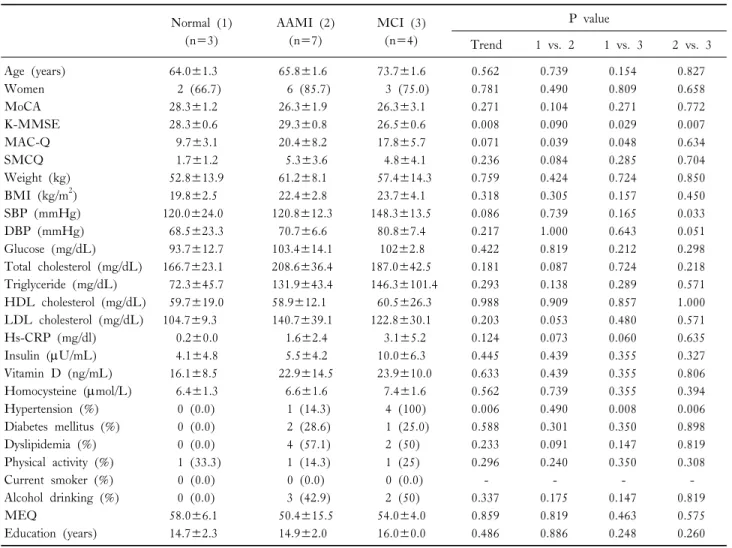
Background: Age-associated memory impairment (AAMI) and mild cognitive impairment (MCI) were considered to have a positive correlation with early dementia status, reflecting the decline in objective cognitive function. Studies results exploring the character- istics of AAMI and MCI remain mixed. We investigated the characteristics of AAMI and MCI using neuroimaging and neurocognitive function in healthy Korean adults.

Methods: This cross-sectional study analyzed a total of 14 participants who visited single health promotion center. AAMI and MCI was defined via questionnaires. Participants were classified into three groups based on neurocognitive status: normal, AAMI, MCI. We conducted either Kruskal-Wallis or chi-square test to compare the neuroimaging characteristics between three groups;

Mann-Whitney U test was applied for the within-group analysis. Kruskal-Wallis test was used to investigate the neurocognitive function between three groups.

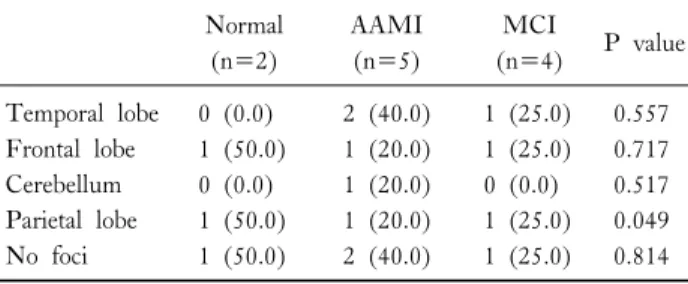
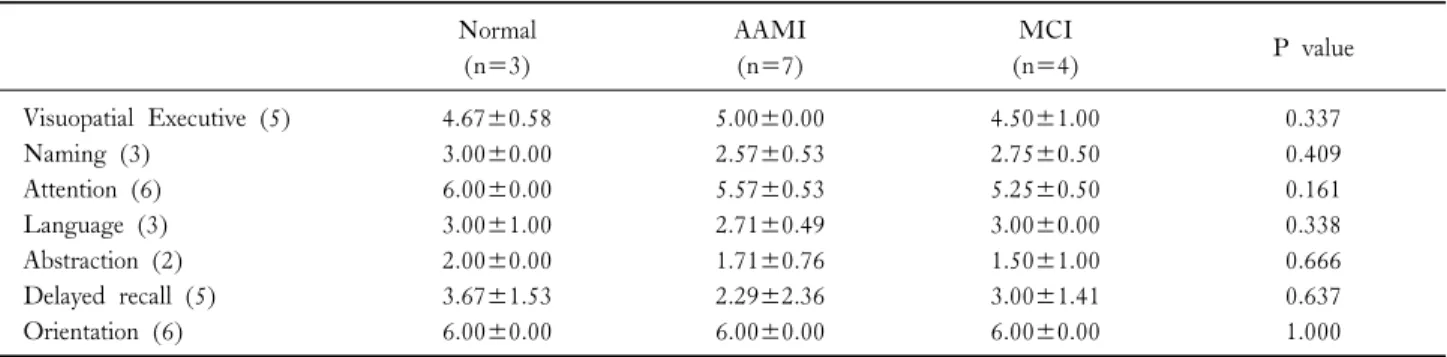
Results: In the case of AAMI and MCI, there were partial metabolic decreases in various parts such as temporal lobe, frontal lobe, parietal lobe and cerebellum. Profound disparities in metabolic decrease in parietal lobe were observed among three groups (P=0.049). In the MMSE characteristics, MCI group showed marked deterioration in attention (P=0.030), and decreased in more various cognitive domains than AAMI group.

Conclusion: The distinct neuroimaging characteristics were observed among three groups. The deficit of neurocognitive function was more prominent in attention in MCI group.

Key Words: Age-Related Memory Disorders, Mild Cognitive Impairment, Neuroimaging 

INTRODUCTION

The average life span of modern people has been ex- tended, while cognitive function-related degenerative diseases such as vascular dementia and Alzheimer's dementia have in- creased [1]. However, the clear cause of cognitive decline has not been clarified yet, so the interest and concern of the

medical community are increasing on the methods for cogni- tive function preservation [2].

Age-associated memory impairment (AAMI) is a diag- nostic term that applies to healthy people aged 50 years or older who have experienced gradual memory impairment [3].

Although they have fewer behavioral disabilities compared to

cognitive disorders such as Alzheimer's disease, it refers to a

(2)

state of considerable difficulty in living for the elderly. There is also a similar definition of subjective memory impairment (SMI). These age-related subjective memory disorders have been considered to reflect a decline in objective cognitive function and to be associated with early dementia, but some studies have shown that subjective memory disorders is more associated with depression, anxiety, personality and education than emotional cognitive decline [4-6].

Mild cognitive impairment (MCI) is a broad concept that refers to the intermediate stage between normal aging and dementia. Therefore, the patient can be defined as MCI when there are complaints about memory deterioration by the patient or caregiver report, good activities of daily living, nor- mal cognitive ability, abnormal memory, but not dementia [7]. Approximately 80% of patients with MCI develop into dementia within 10 years, and unlike dementia, neurons are not yet destroyed, which is a clinically important period for reversible changes [8]. According to an empirical study on MCI, symptoms of early memory impairment are related to neuro-pathologic changes in the limbic system and eventually to Alzheimer’s disease, but the accumulation of research is insufficient [9,10].

Currently, screening and intervention at the pre-dementia stage are known to be the best way to prevent dementia, but the controversy about the linkage between AAMI or MCI and dementia continues [11]. Therefore, the relationship and the difference between AAMI and MCI should be clarified to be helpful for appropriate prevention and treatment of pa- tients who suffered from memory impairment depending on the status. Our study aimed to investigate the characteristics of each of AAMI and MCI and compared neurocognitive function in healthy Korean adults.

MATERIALS AND METHODS

1. Survey overview and study population

We retrospectively reviewed the medical records of 23 par- ticipants aged ≥50 years old who voluntarily visited the Family medicine of Gangnam Severance Hospital between October 2017 and August 2018 for assessments of neuro- cognitive health status. This study was conducted in accord-

ance with the ethical principles of the Declaration of Helsinki and was approved by the Institutional Review Board of Yonsei University College of Medicine, Gangnam Severance Hospital, Seoul, Korea. We excluded 9 subjects who reported physical and psychiatric problems related to cognitive dysfunction such as major depressive disorder, severe deterioration in activities of daily living, diagnosis of Alzheimer’s dementia and missing data in questionnaires. Finally, a total of 14 participants were analyzed in this study.

2. Assessments of anthropometric and laboratory data

Physical examinations were performed by medical staff ac-

cording to a standard protocol. Body weight (kg) and height

(cm) were measured in light indoor clothing and without

shoes to the nearest 0.1 kg and 0.1cm, respectively. Body

mass index (BMI) was calculated as weight in kilograms

(kg) divided by height in meters squared (m

2

). Blood pres-

sure was obtained with the participant in the sitting position

after 5 minutes of rest using an automated device

(TM-2665P, A&D Co., LTD., Tokyo, Japan). Venous blood

sampling was performed after a 12h fasting period. Fasting

plasma glucose, total cholesterol, triglyceride, high-density lip-

oprotein (HDL), and low-density lipoprotein (LDL) choles-

terol were measured using a Hitachi 7600-110 chemistry au-

to-analyzer (Hitachi, Tokyo, Japan). Serum fasting insulin

levels and C-reactive protein, serum total vitamin D were

measured using a chemiluminescence immunoassay system

(Roche, Indianapolis, IN, USA). Homocysteine measurement

was determined using a commercially available enzymatic col-

orimetric assay AU5800 (Beckman Coulter, Irvine, CA,

USA), and the values were expressed in mol/L. Information

about lifestyle behaviors, including cigarette smoking, alcohol

consumption, and physical activity, was obtained by a self-ad-

ministered questionnaire. Educational level was classified as

either middle school or below, high school, and college or

above. Current smokers were defined as individuals who cur-

rently smoke. Physical activity was defined as exercise more

than 30 minutes in duration and more than two or three

times per week and alcohol drinking as drink any kind of al-

cohol more than once a month. Diabetes mellitus, hyper-

(3)

Table 1. Baseline characteristics Normal (1)

(n=3)

AAMI (2) (n=7)

MCI (3) (n=4)

P value

Trend 1 vs. 2 1 vs. 3 2 vs. 3

Age (years) 64.0±1.3 65.8±1.6 73.7±1.6 0.562 0.739 0.154 0.827

Women 2 (66.7) 6 (85.7) 3 (75.0) 0.781 0.490 0.809 0.658

MoCA 28.3±1.2 26.3±1.9 26.3±3.1 0.271 0.104 0.271 0.772

K-MMSE 28.3±0.6 29.3±0.8 26.5±0.6 0.008 0.090 0.029 0.007

MAC-Q 9.7±3.1 20.4±8.2 17.8±5.7 0.071 0.039 0.048 0.634

SMCQ 1.7±1.2 5.3±3.6 4.8±4.1 0.236 0.084 0.285 0.704

Weight (kg) 52.8±13.9 61.2±8.1 57.4±14.3 0.759 0.424 0.724 0.850

BMI (kg/m

2

) 19.8±2.5 22.4±2.8 23.7±4.1 0.318 0.305 0.157 0.450

SBP (mmHg) 120.0±24.0 120.8±12.3 148.3±13.5 0.086 0.739 0.165 0.033

DBP (mmHg) 68.5±23.3 70.7±6.6 80.8±7.4 0.217 1.000 0.643 0.051

Glucose (mg/dL) 93.7±12.7 103.4±14.1 102±2.8 0.422 0.819 0.212 0.298

Total cholesterol (mg/dL) 166.7±23.1 208.6±36.4 187.0±42.5 0.181 0.087 0.724 0.218

Triglyceride (mg/dL) 72.3±45.7 131.9±43.4 146.3±101.4 0.293 0.138 0.289 0.571

HDL cholesterol (mg/dL) 59.7±19.0 58.9±12.1 60.5±26.3 0.988 0.909 0.857 1.000

LDL cholesterol (mg/dL) 104.7±9.3 140.7±39.1 122.8±30.1 0.203 0.053 0.480 0.571

Hs-CRP (mg/dl) 0.2±0.0 1.6±2.4 3.1±5.2 0.124 0.073 0.060 0.635

Insulin (U/mL) 4.1±4.8 5.5±4.2 10.0±6.3 0.445 0.439 0.355 0.327

Vitamin D (ng/mL) 16.1±8.5 22.9±14.5 23.9±10.0 0.633 0.439 0.355 0.806

Homocysteine (mol/L) 6.4±1.3 6.6±1.6 7.4±1.6 0.562 0.739 0.355 0.394

Hypertension (%) 0 (0.0) 1 (14.3) 4 (100) 0.006 0.490 0.008 0.006

Diabetes mellitus (%) 0 (0.0) 2 (28.6) 1 (25.0) 0.588 0.301 0.350 0.898

Dyslipidemia (%) 0 (0.0) 4 (57.1) 2 (50) 0.233 0.091 0.147 0.819

Physical activity (%) 1 (33.3) 1 (14.3) 1 (25) 0.296 0.240 0.350 0.308

Current smoker (%) 0 (0.0) 0 (0.0) 0 (0.0) - - - -

Alcohol drinking (%) 0 (0.0) 3 (42.9) 2 (50) 0.337 0.175 0.147 0.819

MEQ 58.0±6.1 50.4±15.5 54.0±4.0 0.859 0.819 0.463 0.575

Education (years) 14.7±2.3 14.9±2.0 16.0±0.0 0.486 0.886 0.248 0.260

Data are expressed as the mean±standard deviation or number (percentage).

Physical activity means moderate intensity physical exercise (two or more times/week). Alcohol drinking means drinking any kinds of alcohol

≥ once a month. Data are expressed as the mean±standard deviation or percentage.

AAMI, age related memory impairment; MCI, mild cognitive impairment; MoCA, Montréal cognitive functional assessment; K-MMSE, Korean mini-mental state exam; MAC-Q, memory assessment clinic-questionnaire; SMCQ, subjective memory complaint questionnaire;

BMI, body mass index; SBP, systolic blood pressure; DBP, diastolic blood pressure; HDL, high density lipoprotein; LDL, low density lipoprotein; Hs-CRP, high sensitivity C-reactive protein; MEQ, morningness-eveningness questionnaire.

tension, and dyslipidemia was defined as taking medication, or diagnosis by physicians.

3. Definition of AAMI and MCI

To date, the assessment questionnaire for AAMI is the memory assessment clinic-questionnaire (MAC-Q), which is the most concise statement of AAMI. MAC-Q consists of 6 items, each of which can be answered on a scale of 1 to 5 points and a total score of 30 points. The higher the score, the more the participants feel difficulty about their memory.

If at least one of the 4 or 5 points is recorded, it will be de-

fined as AAMI [12]. Since there is no official Korean ver-

sion of MAC-Q, we made a translation in cooperation with

the Korean translation institute, and we need to study for val-

idation with a large sample size. We defined AAMI as 4 or

5 points in at least one item in MAC-Q, Korean mini-mental

state exam (K-MMSE) score of 27 points or more and

Korean activities of daily living (K-ADL) as a group with no

serious dysfunctions. A similar concept of AAMI is SMI,

which uses the subjective memory complaint questionnaire as

a tool to assess it in Korea. If the score is 6 or more out of

14 points, it is recommended to consult the doctor [13].

(4)

Table 2. Comparisons of decreased foci detected by brain positron emission tomography/computed tomography between AAMI and MCI groups

Normal (n=2)

AAMI (n=5)

MCI

(n=4) P value Temporal lobe 0 (0.0) 2 (40.0) 1 (25.0) 0.557 Frontal lobe 1 (50.0) 1 (20.0) 1 (25.0) 0.717 Cerebellum 0 (0.0) 1 (20.0) 0 (0.0) 0.517 Parietal lobe 1 (50.0) 1 (20.0) 1 (25.0) 0.049 No foci 1 (50.0) 2 (40.0) 1 (25.0) 0.814 Data are expressed as the number (percentage).

AAMI, age related memory impairment; MCI, mild cognitive impairment.

In the diagnostic criteria proposed by Petersen et al., MCI has a memory impairment in the caregiver and the patient and shows objectively decreased memory compared to the age, but the overall cognitive function should be preserved [14].

Therefore, we defined MCI as a group that received 4 or 5 points in at least one item in MAC-Q, K-MMSE score of 24 or more, and no severe dysfunction in K-ADL. There is a Montréal cognitive functional assessment (MoCA), which is known to be useful for assessing MCI, and we also used this questionnaire as an additional tool in this study [15].

Morningness-eveningness questionnaire is useful to assess the sleep/wake cycle or circadian patterns of human [16].

4. Acquisition of positron emission tomography/

computed tomography (PET/CT)

In all subjects, Brain CT and

18

F-fluorodeoxyglucose (FDG) PET scans, which is known to be a helpful diag- nostic tool for suspicion of early stage of cognitive impair- ment, were performed with a Biograph 40 True Point PET/CT scanner (Siemens Medical Solutions; Malvern, PA, USA) [17]. Fifty minutes after intravenous injection of 375.0±89.5 MBq of

18

F-FDG, PET/CT was performed. A head holder was applied to minimize the head motion during the scan. After brain CT scan for attenuation correction, structural imaging (120 KeV, 180 mAs, and 3 mm of slice thickness), and 10 minutes of emission scan, 3D CT and PET images were reconstructed in 512×512×110 matrix with 0.668×0.668×2 mm voxel size the

18

F-FDG PET scan to identify those people with MCI who would develop Alzheimer’s disease dementia or other forms of dementia over a period of time.

5. Statistical analysis

Participants were classified into normal, AAMI, and MCI groups according to their memory impairment status. Comparison of characteristics of the study population between three cate- gories in the field using chi-square, or Kruskal-Wallis test ac- cording to the condition. The results were expressed as mean and standard deviation (SD) or percentage for quantitative variables. Chi square analysis was performed to compare the lesions of the three groups with brain PET/CT, and

Kruskal-Wallis test was calculated to assess comparisons of cognitive functions categorized by K-MMSE and MoCA.

All analyses were conducted using SPSS version 23.0 stat- istical software (SPSS version 23.0; IBM Corp., Armonk, NY, USA). Statistical significance was determined at a P-val- ue<0.05.

RESULTS

Table 1 shows the demographic and biochemical character- istics of the participants in relation to memory impairment status. The mean values of several metabolic variables, weight, fasting glucose, and cholesterol tend to be higher in the AAMI group than in the normal and MCI group, stat- istically not significant. Only the LDL cholesterol was stat- istically significantly higher in the AAMI group. Other meta- bolic variables, BMI, fasting insulin, triglyceride and homo- cysteine were the higher in the MCI group than in the nor- mal and AAMI group. Table 2, Figure 1 and 2 illustrates the decreased foci detected by brain PET/CT between nor- mal and AAMI group. In the case of AAMI, there were no specific findings on brain PET/CT in two subjects and parti- al metabolic decrease was observed in various parts such as temporal lobe, frontal lobe and cerebellum. In the MCI group, one patient had decreased metabolism in the parietal lobe, one in the temporal lobe, and one in the frontal lobe.

The difference between the MCI and AAMI groups was

statistically significant in the parietal lobe. Table 3 and Table

4 show the results of Kruskal-Wallis test to compare the cat-

(5)

Figure 1. A composite picture of glucose metabolism using positron emission tomography and the tracer fluorodeoxyglucose. Patient with age-associated memory im- pairment on the right shows reduced glucose metabolism in the bilateral frontal lobes and left temporal lobe. There is also de- creased uptake in right parietal and temporal lobes with lesser degree, and slightly increased uptake in right basal ganglia.

Figure 2. Comparisons of decreased foci detected by brain positron emission tomography/computed tomography between age associated memory impairment (AAMI) and mild cognitive impairment (MCI) groups. The AAMI patient (A) shows moderately decreased glucose metabolism in the cerebellum and mild degree of decreased uptake in bilateral inferior temporal lobes. Another AAMI patient (B) shows focal glucose hypometabolism in right parietal lobe: Probably partial volume effect or atrophy (sulcus widening). The MCI patient (C) shows mild degree of glucose hypometabolism in both frontal lobes and insula.

egories of neurocognitive function with K-MMSE and MoCA among the three groups, and MCI group showed marked deterioration of in attention (P value=0.030), and decreased neurocognitive function in more various domains than AAMI group with K-MMSE.

DISCUSSION

In this study, we found that mean values of several meta- bolic parameters, such as LDL cholesterol, BMI, fasting in-

sulin, triglyceride and homocysteine were the higher in the AAMI and MCI group than normal group. MCI group showed a significant metabolic reduction in the parietal lobe and decreased function in more various domains than AAMI group. These findings mean MCI group had more delete- rious cognitive function and could develop into the dementia.

Previous study showed that 15% of patients diagnosed with

MCI proceeded to dementia annually, which supported our

result. Interestingly, AAMI also correlated with metabolic pa-

rameters, such as weight, fasting glucose, total cholesterol and

(6)

Table 3. Comparisons of cognitive functions by mini-mental state exam between AAMI and MCI groups Normal

(n=3)

AAMI (n=7)

MCI

(n=4) P value

Place (5) 5.00±0.00 5.00±0.00 4.25±0.96 0.068

Time (5) 5.00±0.00 5.00±0.00 4.75±0.50 0.287

Memory (3) 3.00±0.00 3.00±0.00 3.00±0.00 1.000

Attention (5) 4.00±1.00 5.00±0.00 3.75±0.96 0.030

Recall (3) 2.33±0.58 2.29±0.76 2.25±0.96 1.000

Language, visuospatial (9) 9.00±0.00 9.00±0.00 8.75±0.27 0.287

Data are expressed as the mean±standard deviation.

AAMI, age related memory impairment; MCI, mild cognitive impairment.

Table 4. Comparisons of cognitive functions by Montréal cognitive functional assessment between AAMI and MCI groups Normal

(n=3)

AAMI (n=7)

MCI

(n=4) P value

Visuopatial Executive (5) 4.67±0.58 5.00±0.00 4.50±1.00 0.337

Naming (3) 3.00±0.00 2.57±0.53 2.75±0.50 0.409

Attention (6) 6.00±0.00 5.57±0.53 5.25±0.50 0.161

Language (3) 3.00±1.00 2.71±0.49 3.00±0.00 0.338

Abstraction (2) 2.00±0.00 1.71±0.76 1.50±1.00 0.666

Delayed recall (5) 3.67±1.53 2.29±2.36 3.00±1.41 0.637

Orientation (6) 6.00±0.00 6.00±0.00 6.00±0.00 1.000

Data are expressed as the mean±standard deviation.

AAMI, age related memory impairment; MCI, mild cognitive impairment.

LDL cholesterol, however, the foci of decreased metabolism in the brain was different from MCI group. To date, only a few researchers have reported the difference between AAMI and MCI group with inconsistent and conflicting results [11].

In a cross-sectional community-based study for the com- parison of neurocognitive function in patients with SMI and in those with MCI in 84 Koreans, they identified the charac- teristic differences in the neurocognitive domains of SMI and MCI. Cognitive deficits are found in both SMI and MCI, but the MCI group showed more distinctive deficits in de- layed recall and recognition test of verbal learning and nam- ing ability compared to the SMI group [18]. On the con- trary, several observational studies have suggested that SMI is more associated with depression, anxiety, personality and education than cognitive decline [19]. A survey of 283 com- munity-dwelling people aged 45 to 94 years revealed that combination of measures of personality, emotional distress, and health status explained about a third of the memory im- pairment in America [20].

Brain CT and

18

F-FDG PET has been recognized as a crucial diagnostic marker in MCI, supporting the presence or the exclusion of Alzheimer’s disease pathology. The typical temporo-parietal pattern suggested prodromal Alzheimer’s dis- ease in several cases, some of them progressing to Alzheimer’s disease [21]. Our study also showed that the metabolism in temporal lobes and pariatal lobes tended to de- crease in the AAMI group, and the context is the same as that in the attention domain.

Some mechanisms could explain the significant relationship

between AAMI and MCI. The biomarkers that indicate

Alzheimer’s disease are low in amyloid  1-42, increased in

total tau and phosphorylated tau. According to some studies,

this characteristic is seen in patients with MCI, in a inter-

mediate state between normal elderly and Alzheimer’s disease,

and can be found in cerebrospinal fluid 5 to 10 years before

the onset of dementia [22]. In addition, MCI is known to

have several characteristics that indicate that it is a pre-advanced

stage of Alzheimer’s disease in brain-induced neurofilament,

brain-derived neurotrophic factor, and functional and amyloid

(7)

imaging [23].

AAMI is not significantly known to be associated with Alzheimer's disease, but also thought to be affected by several health factors, the most important mechanism of association with neurocognitive function is the insulin resistance. Although the pathophysiology of memory impairment is not fully un- derstood, the epidemiological data suggest that brain insulin resistance flanks both cognitive decline and progressive neu- ro-inflammation in neurodegenerative diseases [24]. Some ex- perimental study also reported the role of insulin in spatial memory and inflammatory process within the hippocampus for memory regulation. This mechanism may affect overall neurodegenerative disease, it can be interpreted that it is the main cause of the AAMI stage characterizing difference in from MCI [25].

Importantly, our study had several limitations. First, it is a retrospective observational analysis of an existing database that limits causal inferences. Additional research is needed to elu- cidate longitudinal associations. Second, since we included participants voluntarily visited a single health center for cog- nitive function check-ups, there remains the possibility of se- lection bias. Especially, the participants who undertaken the PET/CT only for memory loss, except for those without cog- nitive impairment, do not have sufficient sample size. Despite these potential limitations, we provided the differences in neu- rocognitive function of pre-dementia patients with imaging studies including brain PET/CT.

In conclusion, there are differences in decreased foci of metabolism among normal, AAMI and MCI groups, Especially, a difference of metabolic decrease was observed in parietal lobe. In the MCI group, the deficit of neurocognitive func- tion was the significant in attention, and showed a broader range of cognitive deficits than AAMI group. This result is not sufficient, but it can be regarded as the basis of a study to characterize AAMI and MCI.

Cognitive decline and neuropathological deficit have been increased in the aging society, and the prevention and man- agement of dementia is emerging issues for the huge socio- economic cost burden of dementia. It is not only possible to effectively prevent dementia disease by characterizing AAMI and MCI, but also to improve lifestyle (exercise and dietary

habits correction), diabetes, hypertension, and metabolic syn- drome influencing general physical strength and psychological factors. The management of life style risk factors and chronic metabolic conditions would helpful to reduce medical ex- penditures as well as improve the quality of life for the in- dividual elderly.

ACKNOWLEDGMENTS

We thank to the Korean Academy of Clinical Geriatrics, as well as the participants in the survey.

CONFLICTS OF INTEREST

This work was supported by the Technology Innovation Program (20002781, A Platform for Prediction and Management of Health Risk Based on Personal Big Data and Lifelogging) funded By the Ministry of Trade, Industry &

Energy (MOTIE, Korea).

REFERENCES

1. Hebert LE, Weuve J, Scherr PA, Evans DA. Alzheimer dis- ease in the United States (2010-2050) estimated using the 2010 census. Neurology 2013;80:1778-83.

2. van Norden AG, van Dijk EJ, de Laat KF, Scheltens P, Olderikkert MG, de Leeuw FE. Dementia: Alzheimer pathol- ogy and vascular factors: from mutually exclusive to interaction.

Biochim Biophys Acta 2012;1822:340-9.

3. Gilles C. Age-related mild cognitive deficit: a ready-to-use concept? Dialogues Clin Neurosci 2003;5:61-76.

4. Jessen F, Wiese B, Bachmann C, Eifflaender-Gorfer S, Haller F, Kolsch H, et al. Prediction of dementia by subjective mem- ory impairment: effects of severity and temporal association with cognitive impairment. Arch Gen Psychiatry 2010;67:414-22.

5. Hanninen T, Hallikainen M, Koivisto K, Helkala EL, Reinikainen KJ, Soininen H, et al. A follow-up study of age-associated memory impairment: neuropsychological pre- dictors of dementia. J Am Geriatr Soc 1995;43:1007-15.

6. Hanninen T, Soininen H. Age-associated memory impairment.

Normal aging or warning of dementia? Drugs Aging 1997;

11:480-9.

7. Petersen RC, Caracciolo B, Brayne C, Gauthier S, Jelic V, Fratiglioni L. Mild cognitive impairment: a concept in evolution.

J Intern Med 2014;275:214-28.

8. Brodaty H, Connors MH, Ames D, Woodward M, PRIME

study group. Progression from mild cognitive impairment to

(8)

dementia: a 3-year longitudinal study. Aust N Z J Psychiatry 2014;48:1137-42.

9. Korolev IO, Symonds LL, Bozoki AC, Alzheimer's Disease Neuroimaging Initiative. Predicting progression from mild cognitive impairment to Alzheimer’s dementia using clinical, MRI, and plasma biomarkers via probabilistic pattern classification. PLoS One 2016;11:e0138866.

10. Peters F, Villeneuve S, Belleville S. Predicting progression to dementia in elderly subjects with mild cognitive impairment us- ing both cognitive and neuroimaging predictors. J Alzheimers Dis 2014;38:307-18.

11. Bartres-Faz D, Junque C, Lopez-Alomar A, Valveny N, Moral P, Casamayor R, et al. Neuropsychological and genetic differences between age-associated memory impairment and mild cognitive impairment entities. J Am Geriatr Soc 2001;49:985-90.

12. Crook TH 3rd, Feher EP, Larrabee GJ. Assessment of memo- ry complaint in age-associated memory impairment: the MAC-Q.

Int Psychogeriatr 1992;4:165-76.

13. Youn JC, Kim KW, Lee DY, Jhoo JH, Lee SB, Park JH, et al. Development of the Subjective Memory Complaints Questionnaire. Dement Geriatr Cogn Disord 2009;27:310-17.

14. Petersen RC, Knopman DS. MCI is a clinically useful concept.

Int Psychogeriatr 2006;18:394-402.

15. Lin JS, O’Connor E, Rossom RC, Perdue LA, Eckstrom E.

Screening for cognitive impairment in older adults: A system- atic review for the U.S. Preventive Services Task Force. Ann Intern Med 2013;159:601-12.

16. Zacharia T, James J, Prakash H, Mohan RT, Rajashekhar B.

Development and standardization of Morningness-Eveningness Questionnaire (MEQ) in the Indian language Kannada. Int Tinnitus J 2014;19:36-40.

17. Small GW, Kepe V, Ercoli LM, Siddarth P, Bookheimer SY, Miller KJ, et al. PET of brain amyloid and tau in mild cogni-

tive impairment. N Engl J Med 2006;355:2652-63.

18. Kang MA, Baek YM. The neurocognitive function between the patients who had subjective memory impairment and mild cognitive impairment. J Korean Geriatr Soc 2014;18:7-15.

19. Kim WH, Kim JH, Kim BS, Chang SM, Lee DW, Cho MJ, et al. The role of depression in the insomnia of people with subjective memory impairment, mild cognitive impairment, and dementia in a community sample of elderly individuals in South Korea. Int Psychogeriatr 2017;29:653-61.

20. Pearman A, Storandt M. Predictors of subjective memory in older adults. J Gerontol B Psychol Sci Soc Sci 2004;59:P4-6.

21. Cerami C, Della Rosa PA, Magnani G, Santangelo R, Marcone A, Cappa SF, et al. Brain metabolic maps in Mild Cognitive Impairment predict heterogeneity of progression to dementia. Neuroimage Clin 2015;7:187-94.

22. Parnetti L, Chiasserini D, Eusebi P, Giannandrea D, Bellomo G, De Carlo C, et al. Performance of 1-40, 1-42, total tau, and phosphorylated tau as predictors of dementia in a co- hort of patients with mild cognitive impairment. J Alzheimers Dis 2012;29:229-38.

23. Borba EM, Duarte JA, Bristot G, Scotton E, Camozzato AL, Chaves ML. Brain-derived neurotrophic factor serum levels and hippocampal volume in mild cognitive impairment and de- mentia due to Alzheimer disease. Dement Geriatr Cogn Dis Extra 2016;6:559-67.

24. Bloemer J, Bhattacharya S, Amin R, Suppiramaniam V.

Impaired insulin signaling and mechanisms of memory loss.

Prog Mol Biol Transl Sci 2014;121:413-49.

25. Hoscheidt SM, Starks EJ, Oh JM, Zetterberg H, Blennow K,

Krause RA, et al. Insulin resistance is associated with increased

levels of cerebrospinal fluid biomarkers of Alzheimer’s disease

and reduced memory function in at-risk healthy middle-aged

adults. J Alzheimers Dis 2016;52:1373-83.

수치

Table 1. Baseline characteristics Normal (1) (n=3) AAMI (2)(n=7) MCI (3)(n=4) P value Trend 1 vs
Table 2. Comparisons of decreased foci detected by brain  positron emission tomography/computed tomography between  AAMI and MCI groups
Figure 2. Comparisons of decreased foci detected by brain positron emission tomography/computed tomography between age  associated memory impairment (AAMI) and mild cognitive impairment (MCI) groups
Table 4. Comparisons of cognitive functions by Montréal cognitive functional assessment between AAMI and MCI groups Normal (n=3) AAMI(n=7) MCI (n=4) P value Visuopatial Executive (5) 4.67±0.58 5.00±0.00 4.50±1.00 0.337 Naming (3) 3.00±0.00 2.57±0.53 2.75±0

참조

관련 문서

A β: β-amyloid, AD: Alzheimer’s dementia, aMCI: amnestic mild cognitive impairment, CN: cognitively normal, MCS: mean cluster size, NC: number of clusters, n.s.: not significant,

수집된 자료는 Statistical Pack - age for the Social Sciences(SPSS) ver. 각 군별로 인지기 능 수준의 차이는 연령을 보정한 이후에도 모두 통계적으 로 유의한

The purposes of this study are as fol- lows: to compare scores of three measures between patients with amnestic mild cognitive impairment (aMCI) and the normal elderly; to find

PD-MCI-SD = Parkinson’s disease with a shorter duration of parkinsonism before mild cognitive impairment diagnosis; PD-MCI-LD = Parkinson’s disease with a longer duration

CN, cognitively normal; MCI, mild cognitive impairment; AD, Alzheimer’s disease; APOE, apolipoprotein E; Aβ, average florbetapir mean standard uptake value ratio of frontal,

Methods We evaluated 50 elderly patients with mild cognitive impairment (MCI) and 33 without cognitive dysfunction with respect to de- mographics, clinical characteristics,

K-MMSE, Korean-Mini Mental State Examination; K-HDS-R, Korean version of Revised Hasegawa’s Dementia Scale; K-MoCA, Korean-Montreal Cognitive Assessment; Mild am- MCI, Mild

We defined two subtypes of amnestic mild cognitive impairment (aMCI) according to rec- ognition performance on the memory test: aMCI with encoding failure or aMCI-E and aMCI