INTRODUCTION
Many people with metabolic syndrome have a low-grade inflammation that may place them at risk for the develop- ment of cardiovascular disease. In view of its emerging epi- demic nature and impact, the early identification of those at high risk of developing metabolic syndrome would help pre- vent associated cardiovascular complications. Several epidemi- ological studies have already noted a relationship between some components of metabolic syndrome and leukocytes (1-4). Moreover, leukocyte count has been positively associ- ated with elevated cardiovascular mortality, mainly due to coronary heart disease and ischemic stroke (5-9), and it has been considered to be a marker of inflammation associated with the initiation and development of atherosclerosis. If the leukocyte count is an independent risk factor of metabol- ic syndrome, then it is important to consider the role of the constituent cell types involved. However, few systemic eval- uations have investigated the relation between metabolic syndrome and differential leukocyte counts (10-13).
In this study, we investigated the relationship between
total and differential leukocyte counts and the frequencies of diabetes, hypertension, dyslipidemia, obesity, and metabol- ic syndrome, after adjusting for clinical and biochemical factors.
MATERIALS AND METHODS Subjects
The medical records of the 15,654 subjects (age, median 46, range 14-90 yr; 8,380 men and 7,274 women) who vis- ited our Center for Health Promotion for a medical check- up between January 2002 and December 2003 were inves- tigated. Since routine medical checks are not covered by the Korean medical insurance system, we suspect that most of our study subjects were members of the upper-middle eco- nomic class. Subjects meeting any of the following criteria were excluded; a positive test for hepatitis C virus antibody, a positive test for hepatitis B virus surface antigen, a history of current antidiabetic/antihypertensive/antilipid medication,
193
Dong-Jun Kim, Jung-Hyun Noh, Byung-Wan Lee*, Yoon-Ho Choi�, Jae-Hoon Chung*, Yong-Ki Min*, Myung-Shik Lee*, Moon-Kyu Lee*, and Kwang-Won Kim*
Department of Internal Medicine, Ilsanpaik Hostipal, Inje University College of Medicine, Goyang; Division of Endocrinology and Metabolism*, Department of Medicine, Samsung Medical Center, Sungkyunkwan University School of Medicine, Seoul; Center for Health Promotion�, Samsung Medical Center, Sungkyunkwan University School of Medicine, Seoul, Korea
Address for correspondence Kwang-Won Kim, M.D.
Division of Endocrinology and Metabolism, Department of Medicine, Samsung Medical Center, Sungkyunkwan University School of Medicine, 50 Irwon-dong, Gangnam-gu, Seoul 135-710, Korea Tel : +82.2-3410-3430, Fax : +82.2-3410-3849 E-mail : [email protected] DOI: 10.3346/jkms.2008.23.2.193
The Associations of Total and Differential White Blood Cell Counts with Obesity, Hypertension, Dyslipidemia and Glucose Intolerance in a Korean Population
Although many studies have reported an association between total white blood cell count and metabolic syndrome, relatively few reports are available on the associa- tion between differential white blood cell counts and metabolic syndrome. The medi- cal records of 15,654 subjects (age, median 46, range 14-90 yr; 8,380 men and 7,274 women) who visited the Center for Health Promotion were investigated. It was found that as total white blood cell (WBC) and differential WBC counts increased the frequencies of diabetes, hypertension, obesity, dyslipidemia, and metabolic syn- drome also increased. Moreover, these significant relationships persisted after adjust- ing for age, gender, smoking, alcohol intake, educational background, and house- hold income. The odds ratios (95% CI) for metabolic syndrome was 2.64 (2.30- 3.04) in the highest quartile of total WBC count, with corresponding figures of 2.14 (1.88-2.44) for neutrophils, 2.32 (2.03-2.64) for lymphocytes, 1.56 (1.37-1.78) for monocytes, 1.36 (1.20-1.54) for basophils, and 1.82 (1.59-2.08) for eosinophils versus the lowest quartiles of the appropriate total and differential counts, respec- tively, after adjusting for the variables mentioned above. These independent asso- ciations were also observed by subgroup analyses according to the smoking sta- tus. Our data suggest that even within normal ranges, total WBC count and the differential WBC counts are associated with the presence of metabolic syndrome.
Key Words : Diabetes; Metabolic Syndrome; Leukocyte; Korea
Received : 14 June 2007 Accepted : 21 August 2007
or an abnormal white blood cell (WBC) count (<3,800 or
>10,000/ L). Subjects were classified into tertiles with respect to total and differential leukocyte counts. Diabetes was defin- ed as a fasting plasma glucose ≥7.0 mM/L; hypertension as a systolic blood pressure ≥140 mmHg and/or a diastolic blood pressure ≥90 mmHg; dyslipidemia as a serum LDL-choles- terol low density lipoprotein-cholesterol-C (LDL-C) ≥4.2 mM/L and/or triglyceride ≥2.46 mM/L and/or HDL-choles- terol high density lipoprotein-cholesterol-C (HDL-C) <1.16 mM/L; obesity as a body mass index ≥25 kg/m2(14, 15).
The presence of metabolic syndrome was determined using the definition provided by the Third Report of the National Cholesterol Education Program Expert Panel on the Detec- tion Evaluation, and Treatment of High Blood Cholesterol in Adults (16), as:- three or more of the following abnormal- ities: body mass index (BMI) ≥25 kg/m2; triglyceride ≥1.7 mM/L; HDL-C <1.04 mM/L; fasting plasma glucose (FPG)
≥6.1 mM/L; systolic blood pressure (SBP) ≥130 mmHg, and diastolic blood pressure (DBP) ≥85 mmHg. However, obesity according to the Expert Panel guidelines was not used as a criterion; instead, BMI was used, because waist circum- ference measurement was not available. The inclusion of BMI as a criterion is in line with the definition of metabolic syn- drome recommended by the Japan Society for the Study of Obesity (17). This study was approved by the Internal Review Board (IRB) of the Samsung Medical Center.
Assay methods
Height and weight were measured with subjects wearing light clothing but no shoes in the morning; blood pressure was measured using a mercury sphygmomanometer on the right arm with subjects in a sitting position after a 5-min rest. BMI was calculated as weight in kilograms divided by height in meters squared. Information on lifestyle factors including alcohol consumption, cigarette smoking, house- hold income, and educational background were obtained by trained nurses. Questions about alcohol intake included items about alcohol consumption frequency per week, and the type of alcoholic beverage; weekly alcohol intake was calculated and converted to daily alcohol consumption. Subjects were classified as non-drinkers or current drinkers when they con- sumed on average <180 or 181 to <360 g of alcohol/week, respectively. Heavy alcohol drinking was defined as ≥360 g/week of alcohol. Blood samples were obtained in the morn- ing after an overnight fast. Plasma glucose was measured in duplicate by the hexokinase method using an autoanalyzer (Hitachi, Tokyo, Japan), which had an interassay coefficient of variation of 1.6%. Standard liver testing, total cholesterol, HDL-C, LDL-C, triglycerides, and uric acid were measured using an autoanalyzer (Hitachi, Tokyo, Japan), as were WBC counts (Sysmex, Kobe, Japan). Plasma fibrinogen was assess- ed using Clauss method (reagent kit from Dade Behring, Newark, NJ, U.S.A.). Hepatitis B virus surface antigen
(HBsAg) and Hepatitis C virus antibody (anti-HCV) were measured using commercially available immunoradiometric assay kits (both from Riakey, Goyang, Korea).
Statistics
Data are expressed as means±SD. Analysis of variance (ANOVA) or 2tests were used to compare variables between tertile groups. Logistic regression analysis was used to obtain the odds ratios for diabetes, impaired fasting glucose, hyper- tension, dyslipidemia, obesity, and metabolic syndrome after adjusting for age, gender, smoking, alcohol intake, education- al background, and household income. Statistical analyses were performed using SPSS/PC+(SPSS, Inc., Chicago, IL, U.S.A.), and differences were considered statistically signifi- cant at a p level of <0.05.
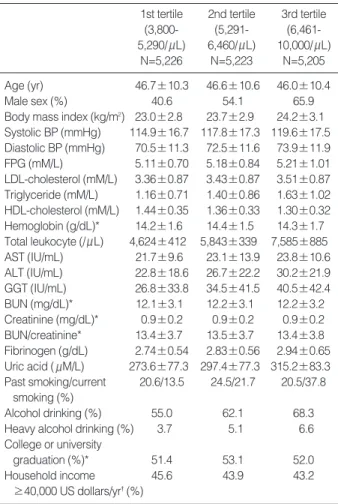
Data are means±SD or %. *not significant; �p<0.05 by the 2test. All other significances were at the p<0.01 by the 2test or ANOVA. Heavy alcohol drinking was defined as ≥360 grams of alcohol/week. The ranges of the total leukocyte counts tertiles were 3,800-5,290, 5,291-6,460, and 6,461-10,000/ L, respectively.
BP, blood pressure; FPG, fasting plasma glucose; AST, serum aspar- tate aminotransferase; ALT, serum alanine aminotransferase; GGT, serum gamma glutamyl transferase; BUN, blood urea nitrogen.
1st tertile (3,800- 5,290/ L)
N=5,226
2nd tertile (5,291- 6,460/ L)
N=5,223
3rd tertile (6,461- 10,000/ L)
N=5,205
Age (yr) 46.7±10.3 46.6±10.6 46.0±10.4
Male sex (%) 40.6 54.1 65.9
Body mass index (kg/m2) 23.0±2.8 23.7±2.9 24.2±3.1 Systolic BP (mmHg) 114.9±16.7 117.8±17.3 119.6±17.5 Diastolic BP (mmHg) 70.5±11.3 72.5±11.6 73.9±11.9 FPG (mM/L) 5.11±0.70 5.18±0.84 5.21±1.01 LDL-cholesterol (mM/L) 3.36±0.87 3.43±0.87 3.51±0.87 Triglyceride (mM/L) 1.16±0.71 1.40±0.86 1.63±1.02 HDL-cholesterol (mM/L) 1.44±0.35 1.36±0.33 1.30±0.32 Hemoglobin (g/dL)* 14.2±1.6 14.4±1.5 14.3±1.7 Total leukocyte (/ L) 4,624±412 5,843±339 7,585±885 AST (IU/mL) 21.7±9.6 23.1±13.9 23.8±10.6 ALT (IU/mL) 22.8±18.6 26.7±22.2 30.2±21.9 GGT (IU/mL) 26.8±33.8 34.5±41.5 40.5±42.4 BUN (mg/dL)* 12.1±3.1 12.2±3.1 12.2±3.2 Creatinine (mg/dL)* 0.9±0.2 0.9±0.2 0.9±0.2 BUN/creatinine* 13.4±3.7 13.5±3.7 13.4±3.8 Fibrinogen (g/dL) 2.74±0.54 2.83±0.56 2.94±0.65 Uric acid ( M/L) 273.6±77.3 297.4±77.3 315.2±83.3 Past smoking/current 20.6/13.5 24.5/21.7 20.5/37.8
smoking (%)
Alcohol drinking (%) 55.0 62.1 68.3
Heavy alcohol drinking (%) 3.7 5.1 6.6
College or university
graduation (%)* 51.4 53.1 52.0
Household income 45.6 43.9 43.2
≥40,000 US dollars/yr�(%)
Table 1. Clinical characteristics of study subjects according to total leukocyte counts
RESULTS
The clinical characteristics of study subjects according to total leukocyte count are presented in Table 1. Univariate analyses showed that the following increased with increas- ing total leukocyte count; BMI, systolic and diastolic BP, fast- ing plasma glucose, lipid profile, serum aspartate amino- transferase (AST), serum alanine aminotransferase (ALT), gamma-glutamyl transferase (GGT), fibrinogen, uric acid, and a male gender, heavy alcohol drinking, and current smok- ing. Age, HDL-C, and household income decreased with increasing total leukocyte counts.
Logistic regression analyses showed that the frequencies of obesity, hypertension, diabetes, and dyslipidemia increased as total leukocyte, neutrophil, and lymphocyte counts increas- ed after adjusting for age, gender, smoking, alcohol intake, educational background, and household income (Table 2).
Total and differential leukocyte counts increased with increase in numbers of components of metabolic syndrome (Table 3).
Because smoking was identified as a major determinant of leukocyte count, we performed a subgroup analyses to fur- ther examine this feature. It was found that in all three smok-
ing subgroups total and differential leukocyte counts were independently associated with the presence of metabolic syn- drome, with the exception of basophil counts in past-smok- ers and current smokers (Table 4).
Men had higher total leukocyte counts and higher alcohol consumption and smoking frequencies than women. We per- formed logistic regression analyses to determine the odd ratios of the presence of metabolic syndrome with respect to total and differential leukocyte counts in both genders (Table 5). In both men and women, all differential and total leukocyte counts were significantly associated with the presence of metabolic syndrome after adjusting for the above mentioned variables.
To determine which component of the differential leuko- cyte count was more strongly related to metabolic syndrome, we performed logistic regression analyses using the individ- ual differential leukocyte counts as covariates. The calculat- ed odds ratios (95% CI) of metabolic syndrome (for highest versus lowest count quartiles) were: 1.76 (1.53-2.02) for neu- trophils, 1.96 (1.71-2.25) for lymphocytes, and 1.59 (1.38- 1.83) for eosinophils. However, monocyte and basophil show- ed no significant difference.
Obesity Hypertension Diabetes Dyslipidemia
Total WBC vs. 1st tertile
p for trend <0.001 <0.001 <0.001 <0.001
2nd tertile 1.45 (1.33-1.59) 1.24 (1.10-1.40)� 1.24 (0.92-1.68)� 1.35 (1.24-1.46)
3rd tertile 1.70 (1.56-1.86) 1.59 (1.41-1.80) 1.81 (1.37-2.41) 1.77 (1.63-1.93)
Neutrophil vs. 1st tertile
p for trend <0.001 <0.001 <0.001 <0.001
2nd tertile 1.30 (1.20-1.42) 1.25 (1.11-1.41) 1.62 (1.21-2.17)� 1.25 (1.15-1.35)
3rd tertile 1.32 (1.21-1.44) 1.78 (1.32-1.67) 1.90 (1.43-2.53) 1.37 (1.26-1.49)
Lymphocyte vs. 1st tertile
p for trend < 0.001 <0.001 <0.05 <0.001
2nd tertile 1.36 (1.25-1.49) 1.12 (1.08-1.37)� 0.99 (0.75-1.32)� 1.520 (1.40-1.65)
3rd tertile 1.94 (1.78-2.12) 1.51 (1.34-1.70) 1.31 (1.01-1.71)* 2.04 (1.88-2.22)
Monocyte vs. 1st tertile
p for trend <0.001 <0.05 NS <0.001
2nd tertile 1.20 (1.10-1.31) 1.11 (0.98-1.25)� 1.06 (0.80-1.41)� 1.09 (1.00-1.18)*
3rd tertile 1.36 (1.25-1.49) 1.18 (1.05-1.34)� 1.18 (0.89-1.56)� 1.25 (1.15-1.36)
Basophil vs. 1st tertile
p for trend NS NS <0.05 <0.001
2nd tertile 1.07 (0.98-1.17)� 1.12 (1.00-1.26)� 1.39 (1.05-1.84)* 1.15 (1.06-1.25)�
3rd tertile 1.08 (0.99-1.18)� 1.11 (1.00-1.25)� 1.46 (1.11-1.92)� 1.21 (1.11-1.31)
Eosinophil vs. 1st tertile
p for trend <0.001 NS NS <0.001
2nd tertile 1.44 (1.32-1.57) 0.96 (0.86-1.08)� 0.93 (0.72-1.23)� 1.32 (1.21-1.43)
3rd tertile 1.55 (1.42-1.70) 0.87 (0.77-0.98)� 1.04 (0.80-1.37)� 1.36 (1.25-1.48)
Table 2. Odds ratios for obesity, hypertension, diabetes, and dyslipidemia versus total and differential leukocyte counts
NS, not significant. *<0.05; �<0.01; �not significant. All other odds ratios were p<0.001. All odds ratios were adjusted for age, gender, smoking, alcohol intake, educational background, and household income. Definitions; obesity as body mass index ≥25 kg/m2; hypertension as an SBP ≥140 mmHg and/or a DBP ≥90 mmHg; dyslipidemia as an LDL-C ≥4.1 mM/L and/or a triglyceride of ≥2.46 mM/L and/or a HDL-C of <1.16 mM/L. Total leukocyte counts by tertile were the same as shown in Table 1, and were:- 1,070-2,806, 2,807-3,676, and 3,677-8,199 for neutrophils, 146-1,748, 1,749-2,224, and 2,225- 5,727 for lymphocytes, 0-315, 316-410, and 411-1,714 for monocytes, 0-22, 23-34, and 35-397 for basophils and 0-88, 89-176, and 177-2,671/ L for eosinophils, respectively.
WBC, white blood cell, SBP, systolic blood pressure; DBP, diastolic blood pressure; LDL-C, low density lipoprotein-cholesterol; HDL-C, high density liprotein-cholesterol.
DISCUSSION
Our analysis demonstrates that leukocyte count, even within its normal range, is closely related to the presence of the com- ponents of metabolic syndrome after adjusting for age, gen- der, smoking, alcohol consumption, educational background,
and income. Our results are consistent with previous find- ings concerning the significance of the relationship between total leukocyte count and metabolic syndrome (18-20), and with its components, namely, obesity, high blood pressure, and high serum triglyceride (21, 22).
Although several studies previously revealed these associ-
Total Never-smoker Past smoker Current smoker
Total WBC vs. 1st tertile
p for trend <0.001 <0.001 <0.001 <0.001
2nd tertile 1.83 (1.59-2.11) 1.73 (1.37-2.19) 1.67 (1.31-2.12) 1.67 (1.34-2.09)
3rd tertile 2.45 (2.13-2.81) 2.55 (2.04-3.19) 2.10 (1.66-2.66) 2.12 (1.71-2.64)
Neutrophil vs. 1st tertile
p for trend <0.001 <0.001 <0.001 <0.001
2nd tertile 1.54 (1.35-1.76) 1.34 (1.07-1.67)* 1.64 (1.29-2.08) 1.54 (1.24-1.91)
3rd tertile 1.90 (1.67-2.16) 2.02 (1.64-2.49) 1.86 (1.48-2.35) 1.81 (1.46-2.25)
Lymphocyte vs. 1st tertile
p for trend <0.001 <0.001 <0.001 <0.001
2nd tertile 1.40 (1.22-1.61) 1.31 (1.04-1.66)* 1.30 (1.03-1.65)* 1.77 (1.42-2.21)
3rd tertile 2.17 (1.90-2.46) 2.36 (1.91-2.91) 1.78 (1.42-2.24) 2.15 (1.72-2.67)
Monocyte vs. 1st tertile
p for trend <0.001 <0.001 <0.05 <0.001
2nd tertile 1.24 (1.09-1.42)� 1.26 (1.01-1.57)* 1.33 (1.05-1.67)* 1.49 (1.20-1.86)
3rd tertile 1.46 (1.28-1.66) 1.56 (1.26-1.93) 1.40 (1.12-1.77)� 1.69 (1.36-2.09)
Basophil vs. 1st tertile
p for trend <0.001 <0.001 NS NS
2nd tertile 1.26 (1.11-1.43) 1.33 (1.07-1.65)� 1.20 (0.96-1.51)� 1.13 (0.92-1.40)�
3rd tertile 1.30 (1.15-1.47) 1.57 (1.28-1.93) 1.15 (0.92-1.44)� 1.12 (0.91-1.38)�
Eosinophil vs. 1st tertile
p for trend <0.001 <0.001 <0.001 <0.01
2nd tertile 1.52 (1.32-1.74) 1.58 (1.25-1.99) 1.51 (1.19-1.91)� 1.29 (1.04-1.60)*
3rd tertile 1.74 (1.52-1.99) 1.93 (1.54-2.41) 1.69 (1.33-2.13) 1.49 (1.21-1.85)
Table 4. Odds ratios for metabolic syndrome according to total and differential leukocyte counts
*<0.05; �<0.01; �not significant. All other odds ratios were p<0.001. All odds ratios were adjusted for age, gender, smoking, alcohol intake, educational background, and household income. Metabolic syndrome was defined as the presence of 3 or more of the following abnormalities: BMI ≥25 kg/m2; triglyceride ≥1.7 mM/L; HDL-C <1.04 mM/L; FPG ≥6.1 mM/L; and SBP ≥130 mmHg and/or DBP ≥85 mmHg. In all subjects, the ranges of the total and differential leukocyte counts in the tertiles were as shown in Table 2. In never-smokers these were 3,800-5,050, 5,051-6,150, and 6,151-10,000 for total leukocytes, 1,096-2,707, 2,708-3,536, and 3,537-8,199 for neutrophils, 146-1,711, 1,712-2,121, and 2,122-5,057 for lymphocytes, 7-294, 295- 379, and 380-1,714 for monocytes, 0-21, 22-32, and 33-397 for basophils, and 0-71, 72-139, and 140-2,268 for eosinophils, respectively. In pastsmok- ers these were 3,800-5,323, 5,324-6,400, and 6,401-10,000 for total leukocytes, 1,070-2,807, 2,808-3,604, and 3,605-7,571 for neutrophils, 756-1,979, 1,798-2,236, and 2,237-5,727 for lymphocytes, 0-22, 23-34, and 35-180 for basophils, and 0-99, 100-190, and 191-2,671 for eosinophils, respective- ly. In current smokers, these were 3,800-5,900, 5,901-7,200, and 7,201-10,000 for total leukocytes, 1,200-3,079, 3,080-4,063, and 4,064-7,950 for neu- trophils, 541-1,971, 1,972-2,445, and 2,446-4,726 for lymphocytes, 0-25, 26-38, and 39-246 for basophils, and 0-129, 130-240, and 241-2,200 for eosinophils, respectively. WBC, white blood cell.
Total WBC Neutrophil Lymphocyte Monocyte Basophil Eosinophil
Numbers of components of metabolic syndrome
0 (n=6,357) 5,765±17 3,263±14 1,946±7 366±1 30.5±0.2 162±2
1 (n=4,533) 6,024±19 3,394±16 2,056±8 375±2 31.1±0.3 170±2
2 (n=2,851) 6,258±25 3,483±20 2,173±10 391±2 31.8±0.3 182±3
3 (n=1,455) 6,421±35 3,583±28 2,220±14 396±3 32.5±0.5 189±4
4 (n=430) 6,627±63 3,711±51 2,270±25 398±6 33.9±0.9 214±8
5 (n=28) 6,450±246 3,589±198 2,199±99 398±22 36.2±3.4 228±30
Table 3. Association of total and differential leukocyte counts with numbers of components of metabolic syndrome controlling after age and gender
Data are means±SEM. All p for trend were <0.001 by ANCOVA. Ages were adjusted as 46.43 yr old. WBC, white blood cell.
ations, these studies have usually involved a relatively small numbers of subjects, and the exclusion criteria adopted were insufficient. Unlike other studies, subjects positive for hep- atitis C virus antibody and/or hepatitis B virus surface anti- gen, which are prevalent in Korea, were excluded, as were subjects with a recent history of antidiabetic, antihyperten- sive, or antilipid medication because of the possibility that these drugs could have affected leukocyte counts.
The mechanism of the relationship between leukocyte counts and cardiovascular disease has not been clarified. As cytokines are potent inducers of leukocyte differentiation, we speculated that an activated cytokine system might lead to elevated leukocyte levels. Furthermore, activated differ- entiated leukocytes can produce more cytokines. There is a possibility that hormones such as cortisol or insulin, which
are known to be increased in metabolic syndrome, then stim- ulate leukocyte propagation (23-25). Some data are available on the association between differential leukocyte counts and coronary heart disease. Prentice et al. were the first to ana- lyze differential leukocyte counts, and found that elevated neutrophil and eosinophil counts were both related to the development of coronary heart disease, and further suggested a similar relationship for monocyte count (26), and this rela- tionship between coronary heart disease and monocyte counts was confirmed by Olivares et al. (11). Caerphilly and Speed- well found significant increases of neutrophil and eosinophil count in men who developed ischemic heart disease during follow-up (27), and the Atherosclerosis Risk in Communi- ties study found that those in the highest quartiles for mono- cyte and granulocyte counts had a higher rate of cardiovas- cular disease mortality than those in the lowest quartiles (9).
Tanigawa et al. reported that total leukocyte and total lym- phocyte counts, and more specifically, memory cell counts are elevated in middle-aged men with clustered features of metabolic syndrome (28). To the best of our knowledge, this is the first report to find significant associations between dif- ferential and total leukocyte counts and metabolic syndrome after adjusting for age, gender, smoking, alcohol intake, edu- cational background, and household income. The reason for the differences between our results and those of Tanigawa et al. are uncertain. The first possibility concerns sample size differences, as the larger sample size used in the present study, compared to that of Tanigawa et al. (15,654 vs. 439), would have enabled us to detect smaller differences. The second possibility concerns the compositions of study subjects. Our study included both men and women in the range of age 14- 90 yr, whereas Tanigawa et al. included only middle-aged men.
The present study has several limitations. This is a cross- sectional study, thus we only observed the association between leukocyte count and metabolic syndrome and could not deter- mine the causal relationship. Although our study was rela- tively large in scale, the possibilities of using differential leuko- cyte counts as risk markers for metabolic syndrome require prospective study. Another limitation of the present study is that insulin resistance, a key component of metabolic syn- drome, was not measured, and thus no direct relationship between insulin sensitivity and leukocyte counts was demon- strated. Moreover, we used BMI alone as a parameter of obesi- ty, and waist circumference or some other parameter of obesi- ty that more accurately reflects insulin resistance or athero- genicity would have been more preferable because obesity is a major determinant of leukocyte count. In addition, because this was not a population-based study, our results are limit- ed in terms of their meaningfulness in the Korean popula- tion. In view of the fact that subjects with a college or uni- versity graduation constituted 52.2% of the study popula- tion and 44.2% had a relatively high income (household income ≥40,000 US dollars/yr), it is apparent that our study subjects represented the upper socioeconomic Korean class.
*<0.05; �<0.01; �not significant. All other odds ratios were p<0.001. All odds ratios were adjusted for age, smoking, alcohol intake, educational background, and household income. Metabolic syndrome was defined as in the legend of Table 4. In men, the ranges in each tertile were 3,800- 5,580, 5,581-6,800, and 6,801-10,000 for total leukocytes, 1,070-2,922, 2,923-3,810, and 3,811-7,950 for neutrophils, 388-1,864, 1,865-2,330, and 2,331-5,727 for lymphocytes, 0-346, 347-448, and 449-1,376 for mono- cytes, 0-22, 23-36, and 37-246 for basophils, and 0-112, 113-217, and 218-2,671 for eosinophils, respectively. In women, these were 3,800- 5,000, 5,001-6,100, and 6,101-10,000 for total leukocytes, 1,096-2,680, 2,681-3,514, and 3,515-8,199 for neutrophils, 146-1,701, 1,702-2,109, and 2,110-5,057 for lymphocytes, 7-289, 290-369, and 370-1,714 for monocytes, 0-21, 22-32, and 33-397 for basophils, and 0-68, 69-130, and 131-2,132 for eosinophils, respectively. WBC, white blood cell.
Men Women
Total WBC vs. 1st tertile
p for trend <0.001 <0.001
2nd tertile 1.87 (1.61-2.16) 1.31 (0.97-1.77)� 3rd tertile 2.38 (2.05-2.77) 2.25 (1.70-2.96) Neutrophil vs. 1st tertile
p for trend <0.001 <0.001
2nd tertile 1.52 (1.32-1.76) 1.29 (0.97-1.73)� 3rd tertile 1.83 (1.59-2.11) 2.04 (1.55-2.67) Lymphocyte vs. 1st tertile
p for trend <0.001 <0.001
2nd tertile 1.31 (1.13-1.51) 1.29 (0.95-1.78)� 3rd tertile 1.97 (1.71-2.27) 2.23 (1.68-2.97) Monocyte vs. 1st tertile
p for trend <0.001 <0.01
2nd tertile 1.28 (1.11-1.47)� 1.21 (0.91-1.61)� 3rd tertile 1.44 (1.25-1.66) 1.61 (1.23-2.11)� Basophil vs. 1st tertile
p for trend <0.01 <0.01
2nd tertile 1.18 (1.02-1.36)* 1.49 (1.12-1.99)� 3rd tertile 1.25 (1.09-1.44)� 1.59 (1.21-2.10)� Eosinophil vs. 1st tertile
p for trend <0.001 <0.001
2nd tertile 1.38 (1.19-1.58) 1.60 (1.19-2.16)� 3rd tertile 1.55 (1.35-1.78) 2.12 (1.59-2.82) Table 5. Odds ratios for metabolic syndrome according to an increase in the total and differential leukocyte counts in men vs. women
In conclusion, the results of the present study suggest that even within normal ranges, total leukocyte count and all dif- ferential leukocyte count examined are independently associ- ated with the presence of metabolic syndrome. Future prospec- tive studies are required to determine which differential leuko- cyte counts are most associated with metabolic syndrome development.
REFERENCES
1. Friedman M, Teskawa I, Grimm RH, Manolio T, Shannon SG, Sid- ney S. The leukocyte count: correlates and relationship to coronary risk factors: the CARDIA study. Int J Epidemiol 1990; 19: 889-93.
2. Hansen LK, Grimm RH, Neaton JD. The relationship of white cell count to the other cardiovascular risk factors. Int J Epidemiol 1990;
19: 881-8.
3. Nieto FJ, Szaklo M, Folsom AR, Rock R, Mercuri M. Leukocyte count in middle-aged adults: the Atherosclerosis Risk in Communi- ties (ARIC) Study. Am J Epidemiol 1992; 136: 527-37.
4. Wang YY, Lin SY, Liu PH, Cheung BM, Lai WA. Association between hematological parameters and metabolic syndrome com- ponents in a Chinese population. J Diabetes Complications 2004;
18: 322-7.
5. Weijenberg MP, Feskens EJ, Kromhout D. White blood cell count and the risk of coronary heart disease and all-cause morality in elderly men. Arterio Thromb Vasc Biol 1996; 16: 499-503.
6. Saito I, Folsom AR, Braneati EL, Duncan BB, Chambless LE, McGovern PG. Non-traditional risk factors for coronary heart dis- ease incidence among persons with diabetes: the Atherosclerosis Risk in Communities (ARIC) Study. Ann Intern Med 2000; 133: 81-91.
7. Brown DW, Giles WH, Croft JB. White blood cell count: an inde- pendent predictor of coronary heart disease mortality among a nation- al cohort. J Clin Epidemiol 2001; 54: 316-22.
8. Noto D, Barbagarllo CM, Cavera G, Cefalu AB, Caimi G, Marino G, Lo Coco L, Caldarella R, Notarbartolo A, Averna MR. Leukocyte count, diabetes mellitus and age are strong predictors of stroke in a rural population in southern Italy: an 8-year follow-up. Atheroscle- rosis 2001; 157: 225-31.
9. Lee CD, Folsom AR, Nieto FJ, Chambless LE, Shahar E, Wolfe DA.
White blood cell count and incidence of coronary heart disease and ischemic stroke and mortality from cardiovascular disease in African- American and white men and women: Atherosclerosis Risk in Com- munities Study. Am J Epidemiol 2001; 154: 758-64.
10. Sweetnam PM, Thomas HF, Yarnell JW, Baker IA, Elwood PC.
Total and differential leukocyte counts as predictors of ischemic heart disease: the Caerphilly and Speedwell Studies. Am J Epidemiol 1997; 145: 416-21.
11. Olivares R, Ducimetiere P, Claude JR. Monocyte count: a risk fac- tor for coronary heart disease? Am J Epidemiol 1993; 137: 49-53.
12. Tanigawa T, Iso H, Yamagishi K, Muraki I, Kawamura N, Nakata
A, Sakurai S, Ohira T, Shimamoto T. Association of lymphocyte sub- populations with clustered features of metabolic syndrome in mid- dle-aged Japanese men. Atherosclerosis 2004; 173: 295-300.
13. Pinto EM, Huppert FA, Morgan K, Brayne C. Neutrophil counts, monocyte counts and cardiovascular disease in the elderly. Exp Gerontol 2004; 39: 615-9.
14. Oh SW, Shin SA, Yun YH, Yoo T, Huh BY. Cut-off point of BMI and obesity-related comorbidities and mortality in middle-aged Kore- ans. Obes Res 2004; 12: 2031-40.
15. Kim YH, Suh YK, Choi HM. BMI and metabolic disorders in south Korean adults: 1988 Korea National Health and Nutrition Survey.
Obes Res 2004; 12: 445-53.
16. Third report of the national cholesterol education program (NCEP) expert panel on detection, evaluation, and treatment of high blood cholesterol in adults (adult treatment panel III) final report. Circula- tion 2002; 106: 3143-421.
17. Examination committee of criteria for ‘obesity disease’ in Japan;
Japan society for the study of obesity. New criteria for ‘obesity dis- ease’ in Japan. Circ J 2002: 66: 987-92.
18. Ble A, Palmieri E, Volpato S, Costantini F, Fellin R, Zuliani G. White blood cell count is associated with some features of metabolic syn- drome in a very old population. Nutr Metab Cardiovasc Dis 2001;
11: 221-6.
19. Nakanishi N, Suzuki K, Tatara K. White blood cell count and clus- tered features of metabolic syndrome in Japanese male office work- ers. Occup Med (Lond) 2002; 52: 213-8.
20. Ford ES. The metabolic syndrome and C-reactive protein, fibrinogen, and leukocyte count: findings from the Third National Health and Nutritional Examination Survey. Atherosclerosis 2003; 168: 351-8.
21. Nieman DC, Henson DA, Nehlsen-Cannarella SL. Influence of obe- sity on immune function. J Am Diet Assoc 1999; 99: 294-9.
22. Gillum RF, Mussolino ME. White blood cell count and hypertension incidence. The NHANES I Epidemiologic Follow-up Study. J Clin Epidemiol 1994; 47: 911-9.
23. Sims E. Humoral factors Oxford: IRL Press. 1993; 1-373.
24. Athens JW. Granulocyte-neutrophils In C.R.ee (Ed.), Wintrobe’s clinical hematology (9th ed., pp. 247-8). Philadelphia: Lea And Fer- binger.
25. Pederson O, Beck-Nielsen H. A study of insulin receptors in human mononuclear leukocytes. Acta Endocrinology 1976; 83: 556-64.
26. Prentice RL, Szatrowski TP, Fujikara T. Leukocyte counts and coro- nary heart disease in Japanese cohort. Am J Epidemiol 1982; 116:
496-509.
27. Sweetnam PM, ThomasHF, Yarnell JW, Baker IA, Elwood PC.
Total and differential leukocyte counts as predictors of ischemic heart disease: the Caerphilly and Speedwell studies. Am J Epidemi- ol 1997; 145: 416-21.
28. Tanigawa T, Iso H, Yamagishi K, Muraki I, Kawamura N, Nakata A, Sakurai S, Ohira T, Shimamoto T. Association of lymphocyte sub-populations with clustered features of metabolic syndrome in meddle-aged Japanese men. Atherosclerosis 2004; 173: 295-300.