1. Introduction
The application of surface modification technology, in- cluding water jet and laser peening, was carried out in the early 2000s in many industries [1,2].The nuclear in- dustry has tried to apply this technology to the parts of the primary and secondary sides because the technology can harden the surface and improve the fatigue strength, surface roughness and wear resistance, and form very high compressive stresses on the surface [3-7]. When SCC (Stress Corrosion Cracking) susceptible materials were used in corrosive environments under high tensile stress fields, generally, SCC could be easily induced [8].
Therefore, nuclear power plants are trying to apply various methods, including the substitution to high corrosion re- sistant materials, reduction of mechanical stress, weld overlay, weld inlay, weld onlay and water chemistry con- trol [1]. However, the above methods have a difficulty because of high cost. As a result, the peening process is emerging in order to reduce the difficulty of the sub- stitution and inspection costs. Since 2016, the nuclear in- dustry in the USA has applied the peening process to nu-
clear vessels and steam generator, and tried its application to other parts and further research [1]. Applicable peening process includes shot [9-11], laser [12-16], water jet [17,18] and ultrasonic shot peening [19,20], and UNSM etc.
Among the peening processes, it is well known that UNSM is very powerful [21]. In the UNSM process, the material is impacted with a hard rigid pin moving at a ultrasonic frequency, typically 20 kHz. A tungsten carbide (WC) tip is attached to an ultrasonic horn, which strikes the specimen surface up to 20,000 or more times per sec- ond with 1,000 to 10,000 shots per square millimeter in a very short time. The impact deforms the surface of the target material and converts its microstructure into nano- crystals [22]. The variables in the UNSM process are static load, amplitude, pitch and tip diameter, etc. Researches about mechanical properties and fatigue were performed by using the UNSM technology [23-26], but there is little to the study about the corrosion resistance.
Recently, our research team reported the effect of UNSM on the corrosion resistance of stainless steel and Alloy 600. In the case of the stainless steel [27-29], the UNSM treatment improves the passivation film and pitting corrosion resistance, and reduces the chromium carbide
Effect of the Amplitude in Ultrasonic Nano-crystalline Surface Modification on the Corrosion Properties of Alloy 600
Ki Tae Kim and Young Sik Kim†
Research Center for Energy and Clean Technology, School of Materials Science and Engineering, Andong National University, 1375 Gyeongdong-ro, Andong, Gyeongbuk 36729, South Korea
(Received October 22, 2019; Revised October 31, 2019; Accepted October 31, 2019)
Surface modification techniques are known to improve SCC by adding large compressive residual stresses to metal surfaces. This surface modification technology is attracting attention because it is an economical and practical technology compared to the maintenance method of existing nuclear power plants. Surface modification techniques include laser, water jet and ultrasonic peening, pinning and ultrasonic Nano-crystal surface modification (UNSM). The focus of this study was on the effect of ultrasonic amplitude in UNSM treatment on the corrosion properties of Alloy 600. A microstructure analysis was conducted using an optical microscope (OM), scanning electron microscope (SEM) and electron backscattering diffraction (EBSD). A cyclic polarization test and AC-impedance measurement were both used to analyze the corrosion properties.
UNSM treatment influences the corrosion resistance of Alloy 600 depending on its amplitude. Below the critical amplitude value, the pitting corrosion properties are improved by grain refinement and compressive residual stress, but above the critical amplitude value, crevices are formed by the formation of overlapped waves. These crevices act as corrosion initiators, reducing pitting corrosion resistance.
Keywords: Alloy 600, UNSM, Amplitude, Corrosion, Electrochemical properties
†Corresponding author: [email protected]
and carbon segregation for the aged specimens to improve the intergranular corrosion resistance. In addition, the SCC resistance was also increased by adding a high com- pressive residual stress. In the case of Alloy 600 [30], an UNSM treatment can refine the grain size, which facili- tates the grain boundary diffusion, and therefore, strength- ens the passive film. However, the surface may be dam- aged by increasing the friction between the strike tip and surface due to the high static load during the UNSM process. Through that repeated process, an overlapped wave, which acts as the initiating site of corrosion, may be formed. This overlapped wave formation may reduce the corrosion resistance.
This work focused on the effect of ultrasonic amplitude in UNSM treatment on the corrosion properties of Alloy 600. Three kinds of ultrasonic amplitude were controlled, and corrosion mechanism by the amplitude was discussed on the base of the microstructure, the mechanical proper- ties, and polarization behavior.
2. Experimental Methods
2.1 Specimen
Alloy 600 was used in this work. Table 1 shows the chemical composition of the experimental alloy. The specimens were heat-treated at 1,040 oC for 7 minutes.
UNSM treatment was applied to the surface by using an UNSM equipment (Design Mecha-LM20 UNSM system, Asan, Korea). The surface prior to UNSM treatment was ground till # 2,000 SiC abrasive paper. The UNSM was treated via a zigzag style. A 2.38 mm tungsten carbide tip was used. The static load was 30 N and the pitch was 0.07 mm as summarized in table 2. This work controlled the amplitudes of 30 μm, 40 μm and 50 μm. The sche-
matic diagram about UNSM treatment was described else- where [30].
2.2 Microstructure Analysis
The microstructure was observed through an optical mi- croscopy (AXIOTECH 100HD, ZEISS, Oberkochen, Germany) and the surface profile was obtained with the use of a 3D microscopy (KH-7700, HiROX, Tokyo, Japan). The surface shape was observed by SEM (VEGA II LMU, Tescan, Brno, Czech Republic) after the UNSM process. The microstructural properties were analyzed by using EBSD (Electron Backscattering Diffraction, Lyra 3 XMH, Oxford Ins., Abingdon, UK). The specimens for the EBSD analysis were ground using #4000 SiC paper, and then polished by using a colloidal silica (0.04 μm).
The EBSD step size was 0.3 μm. The observed data were post-processed using the HKL channel 5 (Oxford Ins., Abingdon, UK) analysis software. The crystallographic structure and lattice plane spacing were analyzed by XRD (X-ray diffraction) (Ultima IV, Rigaku, Tokyo, Japan) and the scan rate was 1°/min. The hardness of the samples was measured by using a micro-vickers hardness tester (HV-100, Mitutoyo, Japan).
2.3 Electrochemical Tests
The electrochemical test was performed in 1% NaCl at 30 oC solution by using a potentiostat (interface 1000, Gamry, Warminster, VA, USA). The reference electrode was saturation calomel electrode (SCE), while the counter electrode was high-density graphite rode. The solution was de-aerated via using N2 gas at the rate of 200mL/min for 30 minutes, and the electrochemical tests, including cyclic polarization test and AC-impedance measurement, were performed. The cyclic polarization test specimen was coat- Table 1 The chemical composition of Alloy 600 used in the experiments (wt%).
Ni Cr Fe C Mn S Si Cu
73.13 16.35 9.42 0.07 0.21 0.002 0.29 0.01
Table 2 UNSM condition for Alloy 600
Sample name Static load (N) Amplitude (μm) Pitch (mm) WC1 Tip
diameter(mm)
Untreated - - - -
A30 30 30 0.07 2.38
A40 30 40 0.07 2.38
A50 50 50 0.07 2.38
1WC : Tungsten carbide
ed with epoxy except for 1 cm2 after epoxy mounting.
The forward and reverse scan rates were 0.33 mV/s in the cyclic polarization test. In addition, the apex current density in the cyclic polarization was 0.1 mA/cm2. In the forward polarization, the passive current density and pit- ting potential were obtained. The protection potential was
defined as the intercept in the reverse and forward polar- ization curves. The AC-impedance test specimen was the same as that of the polarization test. Before measuring, passivation was treated at +0 mV (SCE) for 30 minutes.
AC impedance was measured at a passivation potential from 10 kHz to 0.01 Hz, and the AC voltage amplitude was 10 mV.
3. Results
3.1 Effect of the amplitude in UNSM treatment on the corrosion properties of Alloy 600
Fig. 1 shows the effect of the amplitude in UNSM treat- ment on the polarization curve of Alloy 600 in deaerated 1% NaCl at 30 oC. The UNSM-treated specimens revealed a higher pitting potential (Ep) and lower passive current density (ip) than those of the UNSM-untreated specimen.
However, by increasing the ultrasonic amplitude, the pro- tection potential (Eprot) was greatly decreased. Table 3 summarizes the three kinds of corrosion factors - pitting potential, protection potential, and passive current density - obtained from Fig. 1.
Fig. 1 The effect of the amplitude in UNSM treatment on the polarization curve of Alloy 600 in deaerated 1% NaCl at 30 oC (The scan rate was 0.33 mV/sec).
Table 3 Corrosion factors by the amplitude in the UNSM treatment obtained from Fig. 1 UNSM
Untreated
Ultrasonic amplitude (μm)
A30 (30) A40 (40) A50 (50)
Ep, V(SCE) 0.218 0.313 0.279 0.347
Eprot, V(SCE) 0.146 0.198 0.114 0.022
ip, A/cm2 10-6.074 10-6.658 10-6.71 10-6.69
(a) (b)
Fig. 2 The effect of the amplitude in UNSM treatment on the AC impedance measurement for the passive film formed at 0 V (SCE) in deaerated 1% NaCl at 30 °C: (a) Nyquist plot and (b) polarization resistance.
Fig. 2 shows the effect of the amplitude in UNSM treat- ment on the AC impedance measurement for the passive film formed at 0 V (SCE) in a deaerated solution of 1%
NaCl at 30 °C. Fig. 2a represents the Nyquist plot, and Fig. 2b plotted the polarization resistance obtained from Fig. 2a using Randel’s model. The UNSM-treated speci- mens show a higher polarization resistance than that of the UNSM-untreated specimen. However, by increasing the ultrasonic amplitude, the polarization resistance re- vealed the decreasing trend. This trend was similar to the results of the polarization test.
Fig 3 shows the effect of the amplitude below/over the critical UNSM condition on the corrosion factors of Alloy
600. As shown in the figures, if the UNSM was treated, the passivation behavior was improved. However, if the ultrasonic amplitude was over the critical value (e.g. 30 μm in this work), the increased amplitude lowered the pitting corrosion resistance. In special, the protection po- tential was greatly lowered by increasing the ultrasonic amplitude. This trend is similar to the effect of the static load on the corrosion resistance [30].
3.2 Effect of the amplitude in UNSM treatment on the microstructure of Alloy 600
In order to figure out the microstructural change by the UNSM treatment, an EBSD analysis was performed on
(a) (b)
Fig. 3 The effect of the amplitude below/over the critical UNSM condition on the corrosion factors of Alloy 600; (a) below critical value, (b) over critical value.
(a) (b) (c) (d)
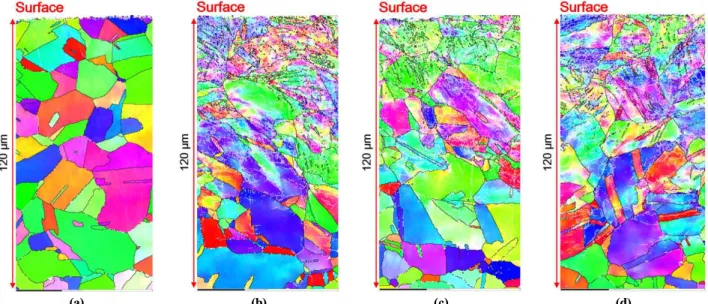
Fig. 4 The effect of the amplitude in UNSM treatment on the grain refinement depth profile of Alloy 600 by EBSD (×600);
(a) Untreated (b) A30, (c) A40, (d) A50.
the cross-section of the specimens. Fig. 4 shows the effect of the amplitude in the UNSM treatment on the grain re- finement depth profile of Alloy 600 by EBSD. In the un- treated specimen, an austenitic structure was revealed, and the grain size was larger. However, when the UNSM treat- ment was applied, the grain was refined as show in Fig.
4b-d. In these figures, the white lines mean the grain boun- dary showing the misorientation under 15o and black line implies the grain boundary having the misorientation over 15o. An increased low-angle boundary means the for- mation of sub-grain by UNSM treatment. This sub-grain was higher on the outer surface and its ratio was decreased in depth. In the point of grain refinement, the effective
refine depth was about 60 ~ 70 μm regardless of the ultra- sonic amplitude.
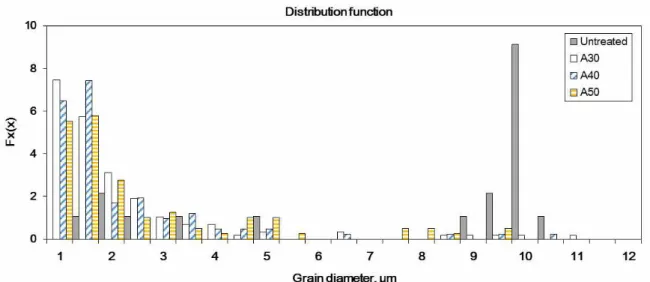
Fig. 5 shows the effect of the amplitude in the UNSM treatment on the grain diameter distribution of Alloy 600.
The grain diameter distribution was obtained for the EBSD area of Fig. 4. The average grain diameter of the untreated specimen was about 10.32 μm, and 2.29 μm, 2.98 μm and 2.97 μm for the A30, A40 and A50 speci- mens, respectively.
Hardness was measured to find out the effect of grain refinement on the hardness in depth. Fig. 6 shows the effect of the amplitude in the UNSM treatment on the hardness depth profile of Alloy 600. The highest hardness was obtained in the outmost surface and it was gradually decreased in depth. As shown in Fig. 6, y of the trend equation means the hardness (HV) and x implies the depth (μm) from the top surface. The hardness in depth of A50 was a little higher than those of A40 and A30. Regardless of the ultrasonic amplitude, the effective depth was about 1,000 μm on the base of hardness in depth.
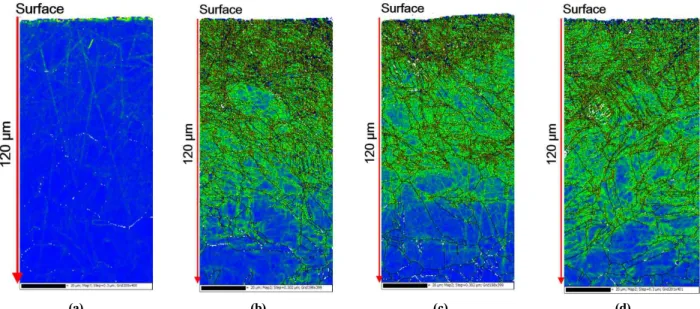
Fig. 7 shows the effect of the amplitude in the UNSM treatment on the dislocation density of Alloy 600 by kernel average misorientation (KAM). In these figures, the dis- location density is higher in a series of red > yellow >
green. When the UNSM treatment was applied to the specimen, the dislocation density increased till about to 100 μm depth (110 μm for A50 specimen). The dis- tribution of dislocation density means the formation of compressive residual stress by UNSM treatment [30].
Since the UNSM treatment uses the strong strike to the surface of metals and alloys, phase transformation can be induced. In the austenitic stainless steel, it was reported Fig. 5 The effect of the amplitude in UNSM treatment on the grain diameter distribution of Alloy 600 determined from the EBSD area of Fig. 4.
Fig. 6 The effect of the amplitude in UNSM treatment on the hardness depth profile of Alloy 600.
that martensite was formed [21,31,32]. Fig. 8 shows the effect of the amplitude in the UNSM treatment on the XRD patterns of Alloy 600. As shown in Fig. 8a, no trans- formation by the UNSM treatment was detected.
However, Fig. 8b reveals slightly increased half width of the peaks. The increased half width means the formation of amorphous [33], but it is thought that this can be in- duced by the grain refinement by UNSM treatment.
4. Discussion
As described the above, the UNSM treatment to Alloy 600 increased the hardness, refined the grain diameter, and increased the dislocation density, and thus induced compressive residual stress. In addition, the ultrasonic am- plitude less than the critical value improved the passiva-
tion behavior, including pitting potential, protection poten- tial, and passive current density. However, the amplitude over the critical value reduced pitting corrosion resistance including protection potential.
The enhancement of the pitting corrosion resistance be- low the critical amplitude value can be explained on the base of grain refinement and induced compressive residual stress. The grain diameter by UNSM treatment was de- creased by about 77% than the untreated specimen, and this refinement increased the dislocation density too as shown in Fig. 4. The grain boundary was at a high energy state and active chemically [34]. At sites such as the grain boundaries and triple junctions, the atomic coordination decreased and electron activity increased [35-38].
Therefore, high density grain boundaries enhance the pas- sivation film by increasing surface reactivity through in-
(a) (b) (c) (d)
Fig. 7 The effect of the amplitude in the UNSM treatment on the dislocation density of Alloy 600 by kernel average misorientation;
(a) Untreated (b) A30, (c) A40, (d) A50.
(a) (b)
Fig. 8 The effect of the amplitude in the UNSM treatment on the XRD patterns of Alloy 600: (a) 20° ~ 80°; (b) 42° ~ 46°.
creased electron activity and diffusion [30,39-43].
Moreover, the introduction of high compressive residual stress decreased the interatomic distance [30]. The in- creased interatomic binding force and diffusion rate of the atoms strengthened the growth of passive film [44]. In the case over the critical ultrasonic amplitude, however, the protection potential greatly reduced. The question now is, why did the high ultrasonic amplitude decrease the cor- rosion resistance?
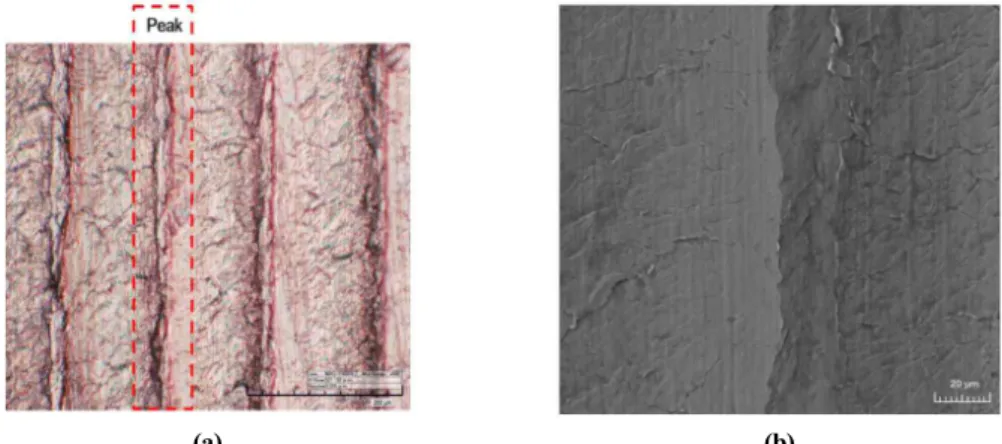
Fig. 9 shows the effect of the amplitude in the UNSM treatment on the surface appearance of Alloy 600 by opti- cal microscope (magnification: ×600). It can be seen that the micro-valleys were formed at a constant distance. The
peaks were also formed between the micro-valleys. Fig.
10 shows the effect of the amplitude in the UNSM treat- ment on the surface topography of Alloy 600 by 3D micro- scope (magnification: ×600). The depths of the micro-val- ley were 11.1 μm, 12.0 μm and 13.0 μm for A30, A40 and A50, respectively. By increasing the ultrasonic ampli- tude, the depth of the valley was increased.
Many lines in the micro-valley can be observed in Fig.
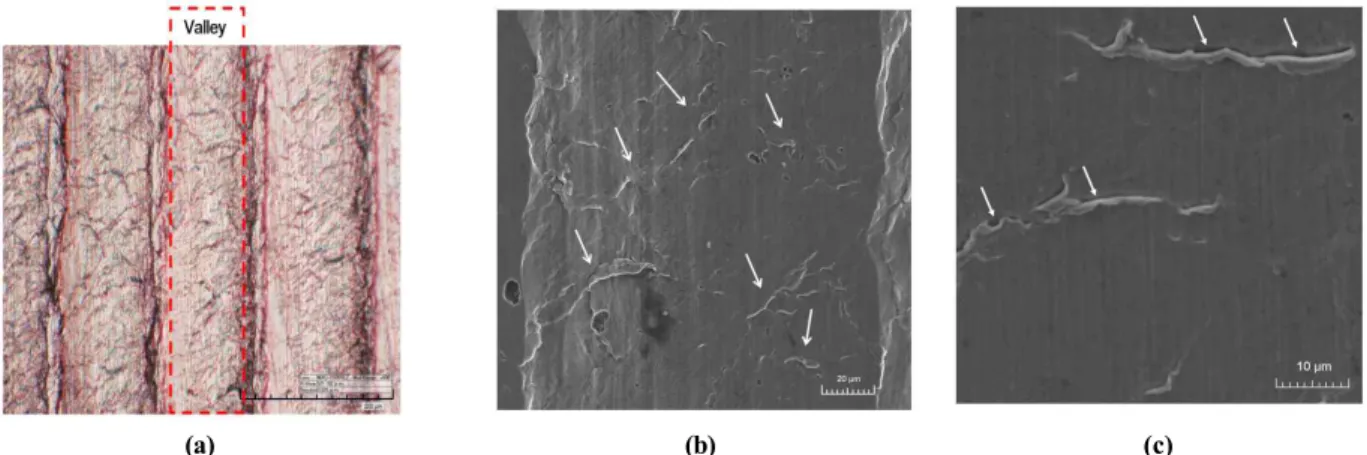
9, and a greater number of lines were observed in the high ultrasonic amplitude. Fig. 11 shows the optical mi- crograph and SEM image of the valley area of Fig. 9c.
As shown in Fig. 11b, the mechanically overlapped wave (the arrows in the SEM image) was observed, and the
(a) (b) (c)
Fig. 9 The effect of the amplitude in the UNSM treatment on the appearance of Alloy 600 by optical microscope (x600); (a) A30, (b) A40, (c) A50.
(a) (b) (c)
Fig. 10 The effect of the amplitude in the UNSM treatment on the surface topography of Alloy 600 by 3D microscope (×600);
(a) A30, (b) A40, (c) A50.
(a) (b) (c)
Fig. 11 Optical micrograph and SEM image on the valley area of Fig. 9(c); (a) OM (x600), (b) SEM (x1200), (c) SEM (x3000).
70o-tilted image of Fig, 11c revealed the crevice under mechanically overlapped wave. The mechanism of wave formation can be explained by the increased frictional force between the striking tip and surface. The increase of friction force produced instability in the ultrasonic sys- tem working in a resonance state [45]. Therefore, the strik- ing tip moved on the surface and strikes it, the mass was squeezed out and then the repeated strike made the over- lapped wave [30].
Fig. 12 shows the optical micrograph and SEM image on the peak area. As shown in the figures, any wave and crevice were not observed on the peak area. It is consid- ered that peaks may be formed by a larger striking tip (2.38 mm) than pitch distance (0.07 mm).
Based on the above results and discussion, the mecha- nism on the wave formation by the ultrasonic amplitude was proposed. Fig. 13 depicts the formation of mechanical
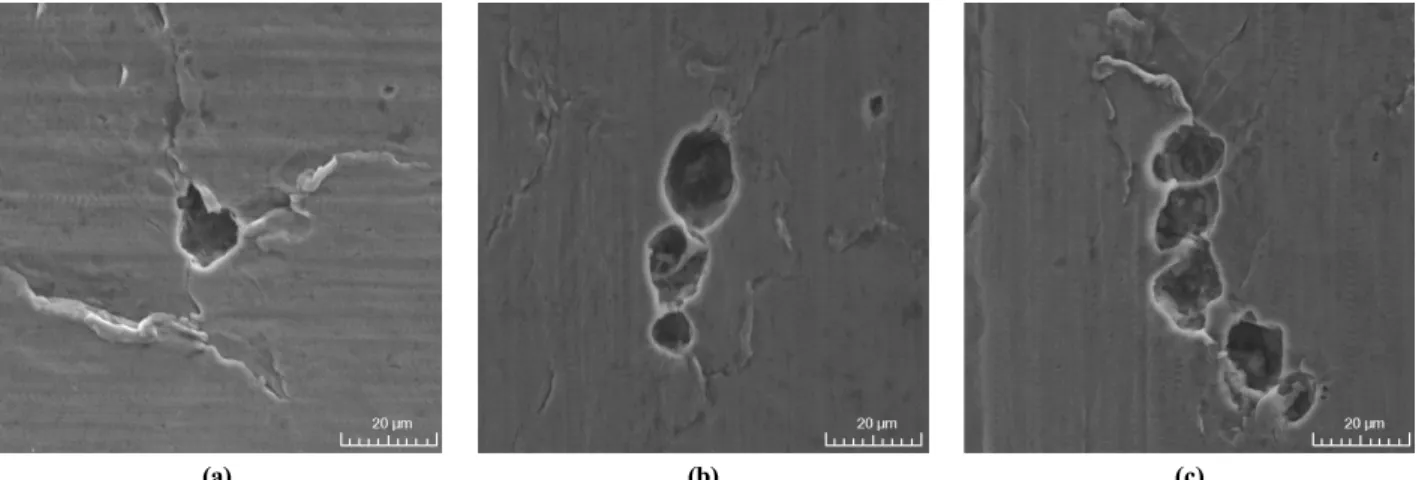
wave by the ultrasonic amplitude. By increasing the ultra- sonic amplitude, the mechanical wave can be formed more. Moreover, there were many crevices beneath the mechanically overlapped wave, and these may be corro- sion initiating sites. The evidence that the crevice formed beneath the mechanically overlapped wave acted as the pitting initiating site and is shown in Fig. 14. Fig. 14 re- veals the pits formation along the mechanically over- lapped wave and thereby crevice. The SEM images on the surface after the polarization test in deaerated 1% NaCl at 30 oC were observed.
5. Conclusions
This work focused on the effect of the ultrasonic ampli- tude in UNSM treatment on the corrosion properties of Alloy 600. The conclusions were as follows: The enhance-
(a) (b)
Fig. 12 Optical micrograph and SEM image on the peak area; (a) OM (x600), (b) SEM (x1200).
(a) (b)
Fig. 13 (a) Formation of mechanical wave by the ultrasonic amplitude and (b) crevice formation beneath the wave, which the crevice acts as the corrosion initiating site.
ment of pitting corrosion resistance below the critical ul- trasonic amplitude value can be explained on the base of grain refinement and induced compressive residual stress.
Over the critical amplitude value, however, the increased amplitude reduced the corrosion resistance. By increasing the ultrasonic amplitude, the depth of the valley was in- creased and many wave lines in the micro-valley can be formed. By increasing the ultrasonic amplitude, the me- chanical wave can be formed more. Moreover, there were many crevices beneath the mechanically overlapped wave, and these may be corrosion initiating sites.
Acknowledgments
This work was supported by a collaborative research fund of the future nuclear power system development be- tween Korea and the United States of 2014, from the National Research Foundation of Korea.
References
1. P. Crooker and T. Lian, Materials Reliability Program:
Technical Basis for Primary Water Stress Corrosion Cracking Mitigation by Surface Stress Improvement, MRP-267, Revision 2, EPRI, Product ID 3002008083 (2016).
2. P. Crooker, Materials Reliability Program: Topical Report for Primary Water Stress Corrosion Cracking Mitigation by Surface Stress Improvement (MRP-335, Revision 3-A), EPRI, Product ID 3002009241 (2016).
3. J. Zhu, X. Jiao, C. Zhou, and H. Gao, Enrgy. Proced., 16, 153 (2012).
4. J.-D. Kim and Y. SANO, J. Weld. Join., 34, 13 (2016).
5. H. Soyama, J. Mater. Process. Technol., 269, 65 (2019).
6. M. Ijiri and T. Yoshimura, Heliyon, 4, e00747 (2018).
7. A. Amanov and R. Umarov, Appl. Surf. Sci., 441, 515
(2018).
8. D. Feron, Nuclear corrosion science and engineering, 1st ed., p. 484, Woodhead Publishing, Cambridge (2012).
9. W. T. Tsai, C. S. Chang, and J. T. Lee, Corros. Sci., 50, 98 (1994).
10. W. H. Friske and J. P. Page, J. Mater. Energ. Syst., 1, 20 (1979).
11. O. Badran, N. Kloub, and M. A. Tal, Am. J. Appl. Sci., 5, 1397 (2008).
12. A. Telang, A. S. Gill, S. Teysseyre, S. R. Mannava, D.
Qian, and V. K. Vasudevan, Corros. Sci., 90, 434 (2015).
13. J. Lu, H. Qi, K. Luo, M. Luo, and X. Cheng, Corros.
Sci., 80, 53 (2014).
14. D. Karthik and S. J. Swaroop, J. Alloys Compd., 694, 1309 (2017).
15. P. Peyre, X. Scherpereel, L. Berthe, C. Carboni, R. Fabbro, G. Beranger, and C. Lemaître, Mat. Sci. Eng. A-Struct., 280, 294 (2000).
16. J. Lu, K. Luo, D. Yang, X. Cheng, J. Hu, F. Dai, H.
Qi, L. Zhang, J. Zhong, Q. Wang, and Y. Zhang, Corros.
Sci., 60, 145 (2012).
17. K. Hirano, K. Enomoto, E. Hayashi, and K. Kurosawa, J. Soc. Mater. Sci., 45, 740 (1996).
18. M. Ijiri, D. Shimonishi, S. Tani, N. Okada, M. Yamamoto, D. Nakagawa, K. Tanaka, and T. Yoshimura, Int. J.
Lightweight Mater. Manufact., 2, 255 (2019).
19. Y. Feng, S. Hu, D. Wang, J. Liu, and C. Zhang, Surf.
Eng., 33, 696 (2017).
20. B. Ahmad and M. E. Fitzpatrick, Metall. Mater. Trans.
A, 46, 1214 (2015).
21. Y. He, K. Li, I. S. Cho, C. S. Lee, I. G. Park, J.-I. Song, C.-W. Yang, J-H. Lee, and K. Shin, Appl. Microsc., 45, 155 (2015).
22. A. Cherif, Y. Pyoun, and B. Scholtes, J. Mater. Eng.
Perform., 19, 282 (2010).
23. C. Ye, A. Telang, A. S. Gill, S. Suslov, Y. Idell, K.
Zweiacker, J. M. K. Wiezorek, Z. Zhou, D. Qian, S. R.
Mannava, and V. K. Vasudevan, Mater. Sci. Eng. A, 613, 274 (2014).
(a) (b) (c)
Fig. 14 Pits formation along the mechanically overlapped wave and thereby crevice (SEM images on the surface after the polarization test in deaerated 1% NaCl at 30 oC); (a) A30, (b) A40, (c) A50.
24. A. Cherif, Y. Pyoun, and B. Scholtes, J. Mater. Eng.
Perform., 19, 282 (2010).
25. M. K. Khan, Y. J. Liu, Q. Y. Wang, Y. S. Pyun, and R. Kayumov, Fatigue Fract. Eng. Mater. Struct., 39, 427 (2016).
26. A. Amanova, R. Karimbaeva, E. Malekib, O. Unalc, Y.
S. Pyuna, and T. Amanovd, Surf. Coat. Technol., 358, 695 (2019).
27. J. H. Lee, K. T. Kim, Y. S. Pyoun, and Y. S. Kim, Corros.
Sci. Tech., 15, 226 (2016).
28. J. H. Lee and Y. S. Kim, Corros. Sci. Tech., 14, 313 (2015).
29. K. T. Kim, J. H. Lee, and Y. S. Kim Materials., 10, 713 (2017).
30. K. T. Kim and Y. S. Kim Materials, 12, 3165 (2019).
31. M.Yasuoka, P. Wang, K. Zhang, Z. Qiu, K. Kusaka, Y.
S. Pyoun, and R. Murakami, Surf. Coat. Technol., 218, 93 (2013).
32. S. Li, Z. Ren, Y. Dong, C. Ye, G. Cheng, and H. Cong, J. Electrochem. Soc., 164, C682 (2017).
33. S. Luo, L. Zhou, X. Wang, X. Cao, X. Nie, and W. He, Materials, 11, 563 (2018).
34. M. G. Fontana, Corrosion Engineering, 3rd ed., p. 29, Mc-Graw-Hill Book Co., New York (1987).
35. S. J. Splinter, R. Rofagha, N. S. McIntyre, and U. Erb, Surf. Interface Anal., 24, 181 (1996).
36. K. D. Ralston and N. Birbilis, Corrosion, 66, 075005-1 (2010).
37. G. Palumbo, K. T. Aust, and U. Erb, Mater. Sci. Forum, 225-227, 281 (1996).
38. G. Palumbo, S. J. Thorpe, and K. T. Aust, Scr. Metall.
Mater., 24, 1347 (1990).
39. X. Wang and D. Li, Electrochim. Acta, 47, 3939 (2002).
40. X. Wang and D. Li, Wear, 255, 836 (2003).
41. T. Wang, J. Yu, and B. Dong, Surf. Coat. Technol., 200, 4777 (2006).
42. K. T. Liu and J. G. Duh, J. Electroanal. Chem., 618, 45 (2008).
43. S. Ghosh, G. Dey, R. Dusane, and A. Grover, J. Alloy.
Compd., 426, 235 (2006).
44. O. Takakuwa and H. Soyama, Adv. Chem. Eng. Sci., 5, 62 (2015).
45. B. Wu, J. Zhang, L. Zhang, Y. S. Pyoun, and R. I.
Murakami, Appl. Surf. Sci., 321, 318 (2014).