Printed in the Republic of Korea
High Performance Liquid Chromatographic Determination of Homocysteine and Cystathionine in Biological Samples by Derivatization with 6-Amino-
quinolyl-N-Hydroxylsuccinimidyl Carbamate (AQC)
Seong S. Seo*
Department of Natural Sciences, 504 College Dr., Albany State University, Albany, GA 31705, USA (2004. 10. 11 접수)
요 약. AQC를사용하여일차및이차아미노산의감도높은형광유도체를얻었으며, AQC 전컬럼법을사용하여
형광검출로닭의조직및혈액시료내아미노산을분석하였다. AQC법을사용하는새로운 HPLC법을개발하여생체
시료낸호모시스틴(Hcy)과시스타티오닌(Cysta)의농도를측정하였다. 닭의간, 가슴살및혈액시료내 Hcy의평균
총농도는각각 9.66, 4.66 및 7.77 nmol/g 이었으며, Cysta의평균농도는각각 15.93, 2.55 및 8.08 nmol/g이었다.
AQC법은생체시료내아미노산, Hcy 및 Cysta의농도를빠르고쉽게측정하는데사용할수있다.
주제어: Homocysteine, Cystathionine, HPLC
ABSTRACT. The AQC has been used for the derivatization of primary and secondary amino acids to yield fluorescent derivatives with high sensitivity. The AQC precolumn method was applied to analyze the amino acids using florescent detector for tissue and blood samples of chickens. A new HPLC method was developed to measure the concentrations of homocysteine (Hcy) and cystathionine (Cysta) in biological samples by using AQC method. The averaged total con- centrations of Hcy were obtained as 9.66, 4.66, and 7.77 nmol/g in liver, breast and blood samples of chicken, respec- tively. Also, the averaged values of Cysta concentrations were obtained as 15.93, 2.55, and 8.08 nmol/g in liver, breast, and blood samples, respectively. The AQC method was rapid and easy to measure the concentrations of amino acids, Hcy and Cysta in biological samples.
Keywords: Homocysteine, Cystathionine, HPLC
INTRODUCTION
Previously, the most common analysis method of amino acids in biological samples was conducted by using ion exchange chromatography (IEC), fol- lowed by postcolumn derivatization of amino acids
with ninhydrin reagent.1,2 However, the precolumn derivatization methods have been developed with many reagents to analyze amino acids and the shortcomings of each precolumn method have been reported.3 Hyperhomosteinemia is an established risk factor for coronary heart diseases and vascular
diseases. Hcy may be either methylated to form methionine or converted to cysteine (Cys) with cys- tathionine as an intermediate. The plasma total homocysteine and aminothiols profile were deter- mined by HPLC with fluorescence detection after derivatization with ammonium 7-fluorobenzo-2-oxa-1, 3-diazole-4-sulfonate4 and with 7-fluoro-2,1,3-ben- zoxadiazole-4-sulfonamide.5,6 The total homocys- teine in human serum was measured by capillary gas chromatography with sulfur-specific detection double focusing ICP-MS after derivatization with N-trifluoroacetyl-o-isopropyl7 and with ethyl chlo- roformate.8 Previously, AQC was synthesized as a derivatizing reagent for amino acid analysis with heterocyclic rings.9,10 The AQC derivatizing method has been applied to analyze amino acids in food and feed using UV detector (248 nm) and by fluores- cence detectors for feed grain samples.11,12 The reproducibility, stability and recovery of AccQ-Tag method were studied by using derivatization with AQC.13 AQC is a highly electrophilic compound that reacts with nuccleophiles such as amines and amino acids. It has been used for highly selective and sensitive separation of amino acids in the revise phase mode and for quantitation of amino acids.
The derivatization reaction shown in scheme 1 pro- duces derivatized amino acid and N-hydroxysuccin- imide (NHS).14-15 The excess reagent is hydrolyzed to produce 6-aminoquinoline (AMQ), NHS and CO2. The fluorescence emission maxima of AMQ and AQC-derivatized amines are approximately 100 nm apart, allowing for selective detection of the desired analytes without significant reagent interference.
Interferences from sample hydrolysis are hydro- lyzed reagent and derivatized ammonia. However, there is no report of analysis method for amino acids or Hcy and Cysta in biological samples with fluorescence detector using AQC method. In this study, the concentrations of the common amino acids were obtained from hydrolyzed liver, breast, and blood chicken samples using AQC method.
Also, the AQC precolume method was applied to measure the total concentrations of homcysteine and cystathionine in liver, breast, and blood chicken samples with a new HPLC method.
MATERIALS AND METHODS Chemicals
AccQ-Tag reagent kits were obtained from Waters (Milford, MA). Hcy and Cysta were obtained from Sigma (Milwaukee, WI).
Sample hydrolysis and derivatization procedures The liver, breast and blood samples were obtained from the type Cobb, 500 female chickens at 31 weeks of age which were given from Cobb-Vantress (Fay- etteville, AR). The 0.5 g of tissue samples and 0.5 ml of plasma samples were transferred to a hydrol- ysis bottle and 5 ml of 6 M HCl were added. The sample bottles were sealed with a vacuum. The sealed samples were placed in an electric oven for 20 hrs at 110oC and then cooled to room tempera- ture. The 1ml hydrolyzing samples were dried to remove excess 6 M HCl with a freezer drier. Amino acids were reconstituted with 1 ml of 0.1 M HCl and filtered with 0.2 um filter (MetaChem). The 10 ul of constituted amino acids and hydrolysate stan- dard amino acid mixture (Pierce) were reacted with AQC following the method of AccQ-Tag (8-10). To analyze homocysteine and cystathionine, constituted amino acid (1 mL) was redried with a freezer drier and derivatized with the AQC method.
Chromatographic Conditions
The HPLC system consisted of 626 pump, a 727 autosampler, 600S controller (Waters, MA), and a scanning fluorescence detector (Hewlett Packard).
Millinnium 2000 Chromatography Manager was connected with the system for data acquisition and data management. All of separations were gener- ated on a Nova-Pak C18 (4µm) column (Waters, MA) with the temperature controlled at 37oC, and oper- ated with a flow rate of 1.0 ml/ min.
The linear gradient elution system was used. Mobile phases A, B, C were acetate-phosphate buffer solu- tion, acetonitrile and water, respectively. The linear gradient conditions were developed with the same solvents to measure the concentration of Hcy and Cysta. The excitation and emission wavelengths for fluorescence detector were 250 nm and 395 nm, respectively. The gain setting of the detector was 10
and the 10 ul of samples was injected into the HPLC. The run time was 40 min that was followed by a 10 min for rest period before the next injection.
RESULTS
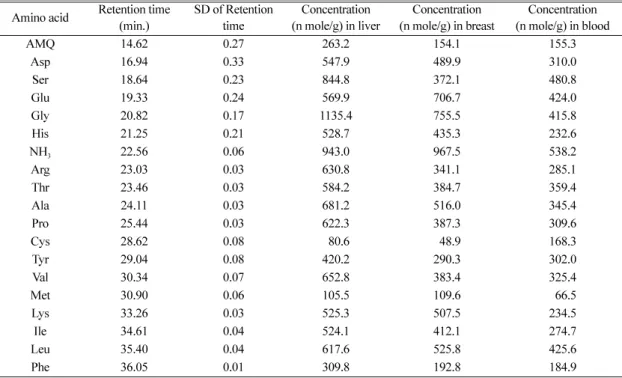
The HPLC conditions for hydrolysate standard amino acids with AccQ-Tag method were reported previously.9-13 The AccQ-Tag method was applied to tissue and blood samples of chicken to analyze common and unusual amino acids. The chromato- grams of AQC derivatives with the hydrolysate standard amino acid and common amino acid from liver samples were obtained as shown on Figs. 1 and 2. The retention times and peak area of the hydrolysate standard amino acid were used to obtain the concentrations of amino acids in biologi- cal samples. The retention times and concentrations of liver, breast, and blood samples for common amino
acids were summarized in Table 1. The concentra- tions from five samples (n=5) were averaged, and standard deviations of retention time were also pre- sented in Table 1. The standard deviations for reten- tion time for all amino acids were 0.01-0.33 min.
The detection limits for fluorescence detector method of all amino acids were in the range of 0.07-0.30 pmol.13
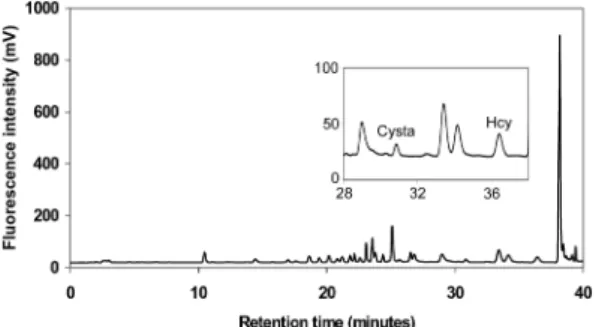
The chromatograms of standard solution for Hcy and Cysta with AccQ-Tag method were presented in Figs. 3 and 4. The calibration curves from ana- lyzing a series of dilutions of the standard solution (from 0.45 nmole to 4.5 nmole for Cysta, from 0.74 nmole to 7.4 nmole for Hcy) were obtained, and the correlation coefficients were 0.98 and 0.99 for Hcy and Cysta respectively, which demonstrates excel- lent linearity of the calibrations as shown in Figs. 5 and 6. These standard curves were used for the quantitative the analysis of Hcy and Cysta in bio- logical samples. The linear gradient conditions of solvents were modified as follows: initial, 100% A (acetate-phosphate buffer); 0.5 min, 99% A, 1% B (HPLC grade acetonitrile); 18 min, 95%A, 5%B; 19 min, 91%A, 9%B; 35 min, 90% A, 10%B; and 38 min, 60% B, 40% C (Milli-Q water). As the chromato- graphic separation of derivatized Hcy and Cysta from hyerolyzed blood sample was shown on
Fig. 7, the early eluting amino acids were sacri- ficed in order to get Hcy and Cysta in short reten- tion times. The retention times for Cysta and Hcy were about 30.8 and 36.5 min, respectively. The averaged Hcy concentrations were obtained as 9.66, 4.66, and 7.77 nmol/g in liver, breast and blood
Scheme 1. Derivatization reaction of primary and secondary amino acid with AQC.
Fig.1. Chromatogram for amino acid standard mixture derivatized with AQC.
Fig. 2. Chromatogram of common amino acids derivatized with AQC from hydrolyzed liver sample.
samples of chicken from 10 samples (n=10), respec- tively. The range for standard deviation was from 0.17 to 0.14 nmol/g. Also, the averaged values of Cysta concentrations are, 15.93, 2.55, and 8.08 nmol/g in liver, breast and blood samples with range of standard deviations of 0.04-0.23 nmol/g, respectively. The average reproducibility of entire procedure for the analysis was 2.0% relative stan- dard deviation (RSD). These results are very good
Table 1. Common amino acids analysis using AQC-precolumn derivatization Amino acid Retention time
(min.) SD of Retention
time Concentration
(n mole/g) in liver Concentration
(n mole/g) in breast Concentration (n mole/g) in blood
AMQ 14.62 0.27 263.2 154.1 155.3
Asp 16.94 0.33 547.9 489.9 310.0
Ser 18.64 0.23 844.8 372.1 480.8
Glu 19.33 0.24 569.9 706.7 424.0
Gly 20.82 0.17 1135.4 755.5 415.8
His 21.25 0.21 528.7 435.3 232.6
NH3 22.56 0.06 943.0 967.5 538.2
Arg 23.03 0.03 630.8 341.1 285.1
Thr 23.46 0.03 584.2 384.7 359.4
Ala 24.11 0.03 681.2 516.0 345.4
Pro 25.44 0.03 622.3 387.3 309.6
Cys 28.62 0.08 180.6 148.9 168.3
Tyr 29.04 0.08 420.2 290.3 302.0
Val 30.34 0.07 652.8 383.4 325.4
Met 30.90 0.06 105.5 109.6 166.5
Lys 33.26 0.03 525.3 507.5 234.5
Ile 34.61 0.04 524.1 412.1 274.7
Leu 35.40 0.04 617.6 525.8 425.6
Phe 36.05 0.01 309.8 192.8 184.9
AMQ: 6-aminoquinoline, Asp: Aspartic acid, Ser: Serine, Glu: Glutamic Acid, Gly: Glycine, His: Histidine, NH3: Ammonia, Arg: Arginine, Thr: Threonine, Ala: Alanine, Pro: Proline, Cys: Cysteine, Tyr: Tyrosine, Val: Valine, Met: Methionine, Lys:
Lysine, Ile: Isoleucine, Leu: Leucine, Phe: Phenylalaine.
Fig. 3. Chromatrogram of standard cystathione derivatized with AQC.
Fig. 4. Chromatogram of standard homocysteine derivatized with AQC.
Fig. 5. The Calibration curve of standard homocysteine derivatized with AQC.
agreed with previous data.16-17 The AccQ-Tag method was rapid and easy to obtain the concentrations of amino acids, Hcy, and Cysta in tissue and blood samples of chicken. The common amino acids and Hcy and Cysta were analyzed with AccQ-Tag method relatively in short time. The use of fluores- cence detection, rather than absorbance, is still for the higher selectivity and less interference by hydro- lyzed reagent. Derivatization with AQC requires fewer manipulations and less time that other deriva- tization method. The AQC derivatization method of
common amino acids and sulfur containing amino acids offers rapid, convenient sample preparation, and excellent sensitivity.
REFERENCES
1. Moore, S.; Stein, W. H., J. Biol. Chem., 1948, 176, 367- 2. Moore, S.; Spackman, D. H.; Stein, W. H., 388. Anal. Chem.,
1958, 30, 1185-1190.
3. Brown, Phyllis R.; Steven A., Cohen and Kathryn M.
De Antonis, Anal. Biochemistry, 1994, 223, 191-197.
4. Jakub Krijt, Martina Vackov, and Viktor Kozich, Clin- ical Chemistry, 2002, 47, 1821-1828.
5. Araki, A.; Sako, Y., J. Chromatogr, 1987, 422, 43-52.
6. Jacob, N.; Guillaume, L.; Garcon, L.; Foglietti, M. J., Ann. Biol. Clin. [Paris], 1997, 55(6), 583-591.
7. De la Flor ST Remy RR, Montes B. M, and Sanz- Medel A, Anal. Bioanal. Chem., 2003, 377(2), 299- 8. Petr Husek, Petr Matucha, Alice Vrankova, and Petr305.
Simek, J. Chromatogr. B, 2003, 789(2), 311-322.
9. Chang, Bi Ying, Hong Ji Liu, and Hui Wen Yan et al, J. of AOAC International, 1995, 78, 736-744.
10. Cohen, Steven A.; Daniel, J., Strydom, Anal. Biochem- istry, 1988, 174, 1-16.
11. Cohen, Steven A.; Daniel, J., Strydom, Anal. Biochem- istry, 1994, 222, 19-28.
12. Cohen, Steven A.; Dennis P. Michaud, Anal. Biochem- istry, 1993, 211, 279-287.
13. Liu, Hong Ji, J. Chromatogr.,1994, 670, 59-66.
14. Xing Chen, Fei Wang, Qian Chen, Xing Chen Qin, and Zhixiao Li, J. Agric. Food Chem., 2000, 48, 3383-3386.
15. Ting Sun and Wong, W. H., J. Agric. Food Chem.,
1999, 47, 4678-4681.
16. Cao, Z.; Coon, C., Poultry Science, 1993, 72(Supp 1), 17. Cao, Z.; Coon, C., 53. Poultry Science, 1994, 73(Supp 1),
96.
Fig. 6. The calibration curve of standard cystathionine derivatized with AQC.
Fig. 7. Chromatogram of Cysta and Hcy derivatized with AQC from hydrolyzed blood sample.