INTRODUCTION
Gadoxetic acid (GA) is a liver-specific contrast agent that is used for magnetic resonance (MR) imaging. GA has features of a bolus-injectable extracellular contrast agent and a late hepato- cyte-specific phase (1). After intravenous injection, GA is transported from the extracellular space into the hepatocytes and is subsequently excreted into the biliary canaliculi. GA ac- cumulates in normally functioning hepatocytes at the hepato- biliary phase, so the hepatic parenchyma is enhanced (1-5).
The use of GA for liver MR imaging has proven to be valuable
in both the detection and characterization of focal hepatic le- sions. In particular, the GA-enhanced hepatobiliary phase MR imaging may assist in better diagnosis of hepatocellular carci- noma (HCC) and thus, may help guide in the treatment plan- ning (6-13).
The hepatic uptake of GA allows data acquisition during hep- atobiliary phase in addition to dynamic phase examination. In patients with normal liver function, hepatobiliary phase imag- ing can usually be acquired within 20 min after GA injection.
Because of the marked hepatic uptake of GA, this hepatobiliary phase is usually reached within 20 min after initiation of GA in-
J Korean Soc Radiol 2013;68(4):319-328 http://dx.doi.org/10.3348/jksr.2013.68.4.319
Received December 10, 2012; Accepted February 13, 2013 Corresponding author: Yong Yeon Jeong, MD Department of Radiology, Chonnam National University Hwasun Hospital, Chonnam National University Medical School, 322 Seoyang-ro, Hwasun-eup, Hwasun 519-763, Korea.
Tel. 82-61-379-7133 Fax. 82-61-379-7101 E-mail: yjeong@jnu.ac.kr
This is an Open Access article distributed under the terms of the Creative Commons Attribution Non-Commercial License (http://creativecommons.org/licenses/by-nc/3.0) which permits unrestricted non-commercial use, distri- bution, and reproduction in any medium, provided the original work is properly cited.
Purpose: To assess the optimal scan delay of hepatobiliary phase of gadoxetic acid (GA)-enhanced magnetic resonance (MR) imaging for small-sized (≤ 3 cm) hepato- cellular carcinomas (HCCs) in cirrhotic liver.
Materials and Methods: There were 71 HCCs included in this study, derived from 53 patients with liver cirrhosis. Hepatobiliary phase MR imaging was obtained at 10, 15 and 20 mins after GA injection. For quantitative analysis, 2 radiologists calculat- ed signal to noise ratio (SNR), enhancement ratio (ER) of the tumor and liver paren- chyma and contrast-to-noise ratio (CNR) at 10 min, 15 min, and 20 min images, re- spectively. For qualitative analysis, 3 radiologists independently reviewed the 3 different phase about HCC possibilities using a 5-point scale. For each observer, the diagnos- tic accuracy of different hepatobiliary phases was compared using the area under the alternative free-response receiver operating characteristic curve (Az). In addi- tion, sensitivity and specificity were compared.
Results: No significant differences in SNR, ER and CNR at 10 min, 15 min, and 20 min were found. The Az values for HCC possibility were not significantly different.
Sensitivity and specificity were also not significantly different.
Conclusion: Hepatobiliary phase MR imaging were obtained at 10 min, 15 min and 20 min yield comparable diagnostic information, so that the choice of scan delay can be adapted according to the clinical routine needs.
Index terms
Hepatocellular Carcinoma Cirrhosis of Liver
Magnetic Resonance Imaging Gadolinium Ethoxybenzyl
Diethylenetriamine Pentaacetic Acid
The Proper Scan Delay of the Hepatobiliary Phase of Gadoxetic Acid-Enhanced Magnetic Resonance Imaging to Evaluate Small- Sized (≤ 3 cm) Hepatocellular Carcinoma in Cirrhotic Liver
1 간경변증 환자에서 소간세포암평가를 위한 Gadoxetic Acid 조영증강 자기공명영상의 적절한 스캔지연1Ji Hyun Lee, MD
2, Yong Yeon Jeong, MD
1, Sook Hee Heo, MD
1, Sang Soo Shin, MD
2, Jin Woong Kim, MD
1, Heoung Keun Kang, MD
11Department of Radiology, Chonnam National University Hwasun Hospital, Chonnam National University Medical School, Hwasun, Korea
2Department of Radiology, Chonnam National University Hospital, Chonnam National University Medical School, Gwangju, Korea
tion with follow-up imaging obtained more than 6 months later.
The criteria for diagnosis of HCCs is as follows (10, 19, 20): 1) a nodule with increased enhancement on arterial phase and wash- out on portal or delayed phase images; 2) a nodule with arterial enhancement and no washout on portal or delayed phase imag- es, but hypointensity on hepatobiliary phases; or 3) a nodule with isointensity during contrast-enhanced dynamic study, hy- perintensity on T2-weighted image (T2WI) and no uptake of contrast agent on hepatobiliary phase images.
The mean size of the HCCs was 1.9 cm (range, 0.8-3 cm).
There were 11 HCCs equal to or smaller than 1 cm, 33 HCCs were 1-2 cm, and 27 HCCs were larger than 2 cm at maximum diameter. All patients had underlying liver cirrhosis caused by hepatitis B in 39 patients, hepatitis C in 12 patients, alcohol abuse in 6 patients, and idiopathic cirrhosis in 2 patients. Cirrhosis was classified as Child-Pugh class A in 51 patients, as Child-Pugh class B in 1 patient, and Child-Pugh class C in 1 patient (21).
MR Imaging
MR examinations were performed with a 3.0 T MR scanner (Magnetom Tim Trio, Siemens, Munich, Germany) using an 8-channel phased-array coil. The MR imaging protocols was as follows: T1-weighted gradient-echo in-phase imaging [repeti- tion time (TR)/echo time (TE): 4.4 ms/2.5 ms, flip angle: 9.0°, matrix: 320 × 168, bandwidth: 680 Hz per pixel]; an out-of- phase imaging (TR/TE: 4.4 ms/1.3 ms, flip angle: 9.0°, matrix:
320 × 168, bandwidth: 980 Hz per pixel); a prospective acquisi- tion correction turbo spin echo T2WI (TR/TE: 3000 ms/80 ms, flip angle: 140°, matrix: 320 × 219, bandwidth: 260 Hz per pix- el), a half-Fourier acquisition single-shot turbo spin-echo heavi- ly T2WI (TR/TE: 1600 ms/182 ms, flip angle: 150°, matrix: 320
× 230, bandwidth: 781 Hz per pixel) with a 5-7 mm section thickness, a 1-mm intersection gap, and a field of view of 360 × 297 mm. A dose of 0.1 mL/kg (0.025 mmol/kg gadoxetic acid) contrast agent was bolus injected intravenously at a rate of 1 mL/sec followed by a 20 mL saline solution flush. For contrast- enhanced MR imaging, the unenhanced, dynamic phase (30 s, 60 s, 100 s, 140 s and 180 s after contrast injection) and hepato- biliary phase (10 min, 15 min and 20 min after contrast injec- tion) images were obtained using a fat-suppressed T1-weighted gradient-echo in-phase imaging (TR/TE: 3.4 ms/1.3 ms, flip an- gle: 13°, matrix: 320 × 176, bandwidth: 500 Hz per pixel) with a jection in patients with normal hepatic function and lasts for at
least 60 min (2-7, 9). However, a 20 min wait is too long time consuming on routine liver MR imaging. Liver MR imaging in- cluded diffusion-weighted images is available within 15 min.
Compared with non-cirrhotic liver, cirrhotic liver may have di- minished parenchymal enhancement in the hepatobiliary phase (14). The uptake of GA in cirrhotic liver is variable and may be difficult to predict parenchymal enhancement (14-16).
Although some studies have suggested that decreasing the de- lay time for the hepatobiliary phase to 10 min sufficient to detect focal hepatic lesions in non-cirrhotic liver (9, 17, 18), there has been no report focused on determining the optimal scan time delay between 10 min, 15 min and 20 min hepatobiliary phase image for the evaluation of small-sized (≤ 3 cm) HCCs in the cir- rhotic liver. Therefore, the purpose of this study is to assess the optimal scan delay of the hepatobiliary phase of GA-enhanced MR imaging for small-sized HCCs in the cirrhotic liver.
MATERIALS AND METHODS
Patients
This retrospective study was approved by the review board of our hospital, and followed the guidelines of the Declaration of Helsinki and subsequent amendments. Between Jan. 2009 and Dec. 2010, 182 patients underwent GA-enhanced MR imaging for the evaluation of HCCs in patients with cirrhotic liver. Ex- clusion criteria included the following: lesions larger than 3 cm or infiltrative lesions (n = 58), a history of chemoembolization, ethanol instillation, or thermal ablation within 6 months before study (n = 70). Lesions with background hemochromatosis were excluded (n = 1) because signal intensity changes of the liv- er parenchyma due to iron deposition would likely affect mea- surements for liver to lesion contrast. In final, 53 patients were included in this study.
The patients’ age ranged from 40 y to 82 y of age (mean, 60.8
± 9.9 y). There were 42 male patients and 11 female patients.
There were 71 lesions diagnosed as HCCs in 53 patients; 40 pa- tients had solitary lesions, 9 patients had 2 lesions, 3 patients had 3 lesions, and 1 patient had 4 lesions. Among 71 HCCs, 19 were confirmed by surgery, and one was diagnosed by percuta- neous biopsy. The remaining HCCs were confirmed by image findings and alpha fetoprotein level > 200 IU/mL in combina-
dard. When an observer estimated the lesion as a score of 4 or 5, the lesion was classified as positive. To achieve accurate correla- tion between the findings of the scored lesions and the reference standard, each observer recorded the individual image number, the locations of all of the lesions and the diameter of each le- sions. For patients with multiple lesions located in the same seg- ment, the observers added further descriptions regarding the size and location of the lesion within each segment in order to avoid confusion during the data analysis.
Statistical Analysis
All statistical analyses were performed with commercially avail- able software (MedCalc for Windows. Version 11.6.1.0; MedCalc Software, Mariakerke, Belgium). For each observer, accuracy [area under the alternative free-response receiver operating char- acteristic curve (Az)] for the diagnosis of HCCs was calculated and compared by using latent binomial alternative free-response receiver operating characteristic analysis (22, 23). Sensitivity was calculated for the 3 hepatobiliary phases for each observer ac- cording to lesion size: equal to or < 1 cm, 1-2 cm, and > 2 cm.
Sensitivity was calculated as the number of true-positive lesions divided by the total number of HCCs. For positive predictive value, numbers in parentheses are the number of true-positive lesions divided by the total number of lesions assigned a confi- dence level of 4 or 5. Statistical analyses for the differences of the sensitivities and positive predictive values (PPV) for each ob- server were based on a previous report (24).
Descriptive statistics including mean value, standard devia- tion, and range were calculated for ER, CNR, and SNR. The sta- tistical significance of any differences between calculated ER, CNR, and SNR at 10 min, 15 min, and 20 min was examined using analysis of variance. A p-value < 0.05 was considered sta- tistically significant. By comparing the scoring results from the 3 observers with the reference standard, we calculated the kappa value: 0.0-0.2, poor; 0.2-0.4, fair; 0.4-0.6, moderate; 0.6-0.8, good; 0.8-1.0, excellent (25).
RESULTS
Quantitative Analysis
The time course of SNR, ER and CNR between 10, 15 and, 20 minute imaging is shown in Table 1 and Fig. 1. The liver paren- 3.5 mm section thickness with no intersection gap and a field of
view of 360 × 260 mm. Otherwise, T2WIs were obtained be- tween 180 s and 10 minutes; diffusion weighted imaging was obtained between 10 min and 15 min.
Image Analysis
Quantitative Analysis
Quantitative analysis of the reference lesions was performed by one radiologist (J.H.L) without knowledge of the results of tumor grading on histology. One radiologist calculated signal- to-noise ratio (SNR), enhancement ratio (ER) of the tumor and liver parenchyma and contrast-to-noise ratios (CNR) at 10, 15 and 20 minute images, respectively. Signal intensity (SI) of the liver parenchyma, reference hepatic lesion and background were measured in each patient for all image before and 10, 15 and 20 minutes after contrast injection.
Regions of interest (ROI) were drawn as large as possible in the structure of interest avoiding necrotic areas and vessels. To avoid affection of signal intensity, ROI were drawn on liver parenchyma away from focal hepatic lesions. All ROIs were positioned at iden- tical intra-axial positions for each sequence. Background noise was defined as the standard deviation (SD) of the SI measured in the air outside the body, avoiding artifacts resulting from breath- ing. SNR, ER of HCCs and liver parenchyma, and liver-to-lesion CNR were calculated with the following formula; SNR = SI of liv- er / SD of background noise, ER = [(SI after enhancement - SI be- fore enhancement) / SI before enhancement] × 100, and CNR = [(SI of tumor - SI of liver) / SD of background noise].
Qualitative Analysis
Three abdominal radiologists (Y.Y.J, S.S.S, J.W.K) blinded to the results of histology and quantitative analyses reviewed 71 HCCs independently at 10 min, 15 min, and 20 min GA-enhanced hep- atobiliary phase MR imaging with additional T1WI, T2WI, heavily T2WI, and dynamic contrast enhanced image. The in- terval between the reviews of the 3 phases of images was at least 2 weeks. The reference hepatic lesion was evaluated regarding HCC possibility using a 5-point scale: 1, definitely not HCC; 2, probably not HCC; 3, indeterminate; 4, probably HCC; 5, defi- nitely HCC. A score of 0 was assigned retrospectively when an observer did not find a lesion documented as a reference stan-
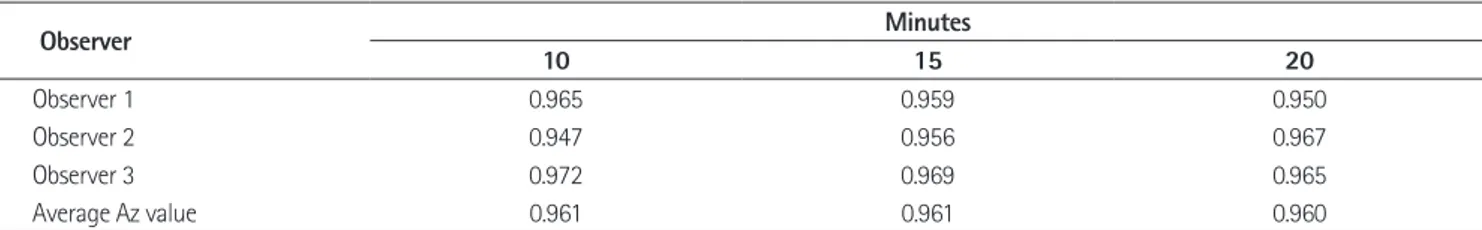
Qualitative Analysis
The calculated Az values for each observer for the GA-enhanced hepatobiliary phase MR imaging are shown in Table 2. The diag- nostic accuracy of hepatobiliary phase imaging does not signifi- cant change when performed 10, 15 and 20 minutes after injection (Fig. 2). The average Az values for 10, 15, and 20 minutes between the observers were not significantly different (p > 0.05).
The sensitivity and PPV between the 3 hepatobiliary phases chyma showed a slight increase in the SNR between 10 and 20
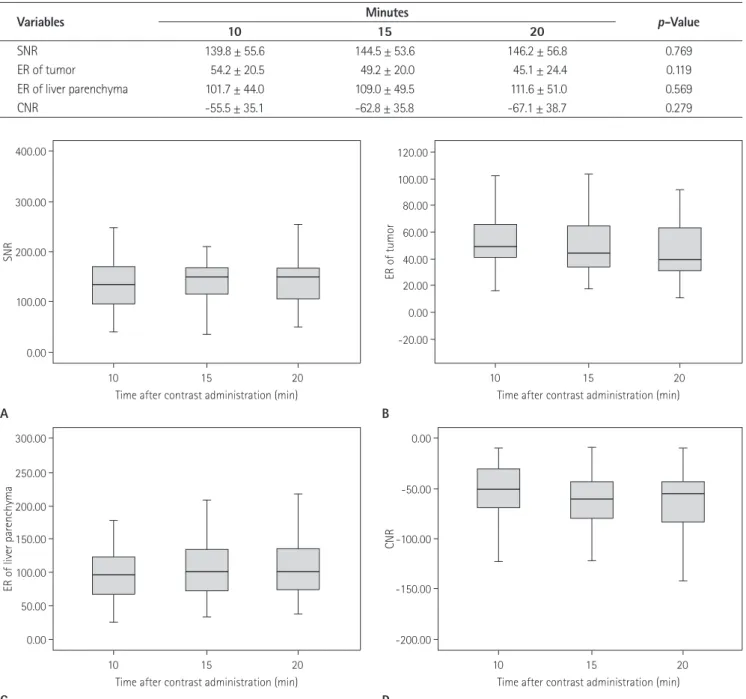
minute imaging. However, significant changes in SNR were not observed. The mean ER of HCCs was maximal at 10 minute im- aging. The mean ER of liver parenchyma increased according to time course after GA injection. However, ER of HCCs and liver parenchyma were not statistically significant (p = 0.569 and 0.143, respectively). There were no significant differences in CNR at 10, 15 and 20 minute imaging (p = 0.279).
Table 1. Signal-to-Noise Ratio (SNR), Enhancement Ratios (ER) of the Tumor and Liver Parenchyma, and Contrast to Noise Ratio (CNR) on Three Hepatobiliary Phase MR Imaging
Variables Minutes p-Value
10 15 20
SNR 139.8 ± 55.6 144.5 ± 53.6 146.2 ± 56.8 0.769
ER of tumor 54.2 ± 20.5 49.2 ± 20.0 45.1 ± 24.4 0.119
ER of liver parenchyma 101.7 ± 44.0 109.0 ± 49.5 111.6 ± 51.0 0.569
CNR -55.5 ± 35.1 -62.8 ± 35.8 -67.1 ± 38.7 0.279
Fig. 1. Signal-to-noise ratios (SNRs) (A), enhancement ratio (ERs) of the tumor (B) and liver parenchyma (C) and contrast-to-noise ratios (CNRs) (D). There are no significant differences in CNR at 10, 15 and 20 minutes imaging after contrast administration.
0.00 -200.00
0.00 -20.00
100.00
50.00
-150.00 100.00
0.00 20.00
150.00 -100.00
200.00
40.00 60.00
250.00
200.00
-50.00
300.00 80.00
300.00 0.00
400.00 120.00
100.00
ER of liver parenchyma CNR
SNR ER of tumor
10 10
10 10
15 15
15 15
20 20
20 20
Time after contrast administration (min) Time after contrast administration (min) Time after contrast administration (min) Time after contrast administration (min)
A B
C D
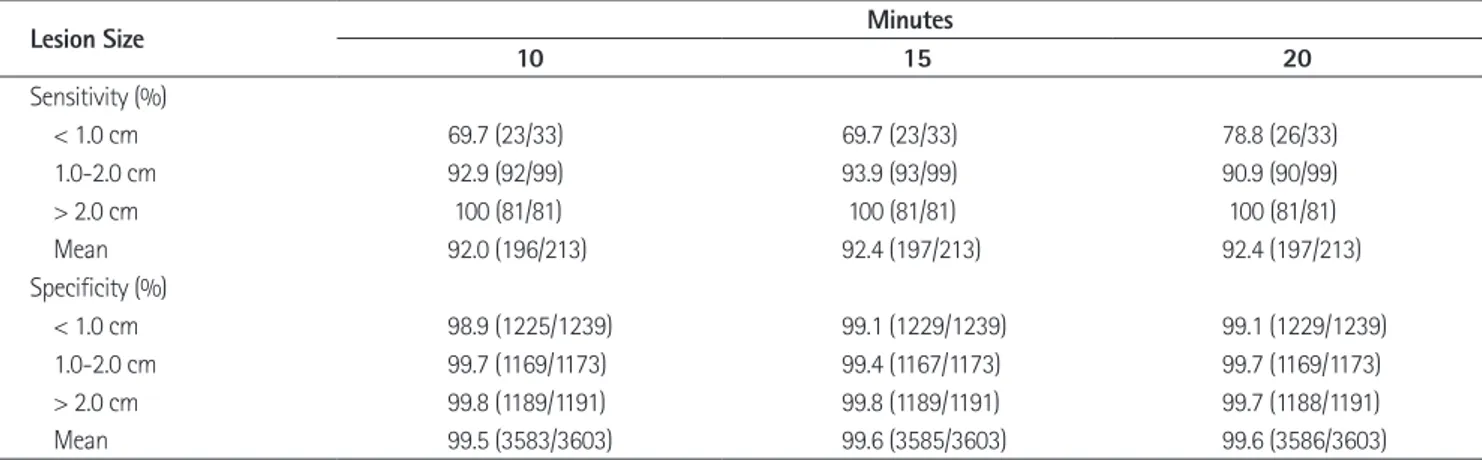
The sensitivity and specificity of the 3 observers is shown in Ta- ble 4. The sensitivities were increased according to increasing sizes of HCCs. Although 3 observers determined lower sensitiv- ities in the detection of HCCs smaller than 1 cm in diameter, imaging for each observer are summarized in Table 3. The differ-
ences of sensitivity and PPV between the 3 hepatobiliary phase images for each observer were not statistically significant (p >
0.05). The PPV of all 3 observers ranged from 81.8% to 86.8%.
Table 2. The Az Value for Gadoxetic Acid-Enhanced MR Imaging for the Detection of Hepatocellular Carcinoma by Three Hepatobiliary Phase MR Imaging
Observer Minutes
10 15 20
Observer 1 0.965 0.959 0.950
Observer 2 0.947 0.956 0.967
Observer 3 0.972 0.969 0.965
Average Az value 0.961 0.961 0.960
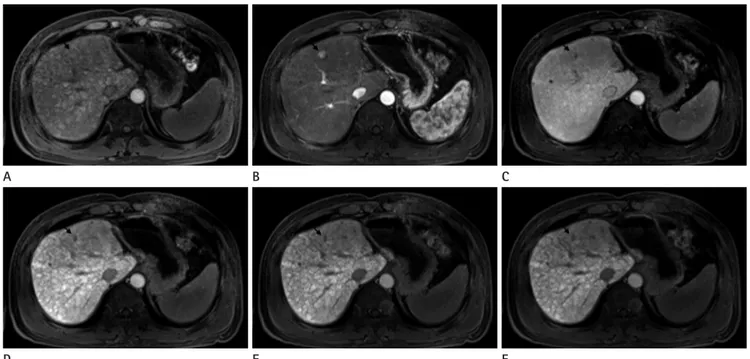
Fig. 2. MR images in 69-year-old man with HCC (arrow) in liver segment VII. Preenhanced image (A), gadoxetic acid-enhanced T1WIs obtained 30 s (B), 180 s (C), 10 minutes (D), 15 minutes (E) and 20 minutes (F) after contrast injection show a 2.1 cm HCC. HCC possibility by all three observers is 5 in the images obtained 10, 15 and 20 minutes after contrast injection. This HCC is confirmed by typical imaging finding on liver MRI (enhancement on arterial phase and washout on portal or delayed phase images).
Note.-HCC = hepatocellular carcinoma, T1WI = T1 weighted image D
A
E B
F C
Table 3. Sensitivity and Positive Predictive Value (PPV) for the Detection of Hepatocellular Carcinoma on Hepatobiliary Phase MR Imaging among Three Observers
Observer Minutes
10 15 20
Sensitivity (%)
Observer 1 94.3 (67/71) 94.3 (67/71) 90.1 (64/71)
Observer 2 88.7 (63/71) 87.3 (62/71) 91.5 (65/71)
Observer 3 91.5 (65/71) 93.0 (66/71) 93.0 (66/71)
PPV (%)
Observer 1 83.8 (67/80) 83.8 (67/80) 83.8 (67/80)
Observer 2 81.8 (63/77) 82.7 (62/75) 84.4 (65/77)
Observer 3 83.3 (65/78) 86.8 (66/76) 86.7 (66/77)
rhosis showed a slight increase in the SNR between 10 min and 20 min after GA injection. However, no statistically significant differences in SNR were observed between the 10 min, 15 min, and 20 min MR images.
ER of liver parenchyma was not significantly different be- tween 10 min, 15 min, and 20 min in our study, although it was higher on 20 min images than on 10 min images. Lee et al. (27) also showed that the mean ER of chronic liver disease was not significantly different after 10 min and after 20 min. Reimer et al.
(9) showed that CNR was lower on the images obtained 20 min after GA injection than on those obtained after 10 min, but the difference was not significant. Our study showed similar results that there was no significant difference in CNR between 10 min, 15 min, and 20 min images. One of the causes of these consis- tent results is that most patients in our study had liver cirrhosis that corresponds to a relatively normal liver function. However, according to Frericks et al. (1), CNR decreased significantly be- tween 10 min and 20 min after contrast GA injection. The cause of the inconsistent result is that included HCCs are not limited to small size less than 3 cm and considerable number of Child- Pugh class B was included by Frericks et al.
GA-enhanced MR imaging showed clear superiority in the detection of HCCs in cirrhotic liver. The sensitivities of GA-en- hanced MR imaging for detection of HCCs ranged from 81.3 to 99.4% in previous studies (10, 28-32). The hepatobiliary phase MR imaging may be useful in detecting iso- and hypovascular small HCCs that are nonspecific in the dynamic phases (16).
Haradome et al. (28) demonstrated that the sensitivity of hepa- tobiliary phase MR imaging for detection of early stage HCCs (range 0.5-2.8 cm, mean size 1.7 cm) was 93.0%. In our study, the mean sensitivities were similar in all 3 imagings and there
was no significant difference was found. The sensitivities for all observers were 100% for all 3 phases of HCCs larger than 2 cm in maximum diameter.
Three observers recorded 22, 17, and 19 false-positive find- ings on 10 min, 15 min, and 20 min images, respectively.
Twelve, 11, and 12 false-positive findings for each observer were most commonly attributed to intrahepatic vasculature. Eight, 5, and 6 false-positive findings for each observer were attributed to cirrhotic nodules.
With regard to the false-negative findings, 24, 22, and 8 le- sions were overlooked because of small size below 1 cm, iso-in- tensity on T2WI, and intrahepatic vasculature on 3 imaging.
The one HCC was overlooked by all 3 observers on the 3 imag- ing, because the liver parenchyma appeared heterogeneous due to the presence of cirrhotic nodules of variable sizes (Fig. 3).
The kappa values among the 3 observers ranged from 0.756 to 0.853, indicating good or excellent agreement for the 3 images.
DISCUSSION
Compared with the non-cirrhotic liver, the cirrhotic liver may have diminished parenchymal enhancement on the hepatobili- ary phase after GA injection, and the time to peak enhancement may be delayed. GA enhancement of the cirrhotic liver may be modest and the peak may not be achieved for 40 min or more.
The reason for the diminished and delayed enhancement is due to impaired transport mechanism including dysfunctional trans- porters or reduced functional hepatocytes (26). As in previous studies, our study showed that the liver parenchyma with cir-
Table 4. Comparison of the Sensitivities and Specificities between 10, 15 and 20 Minutes Hepatobiliary Phase MR Imaging According to Le- sion Size by Three Radiologists
Lesion Size Minutes
10 15 20
Sensitivity (%)
< 1.0 cm 69.7 (23/33) 69.7 (23/33) 78.8 (26/33)
1.0-2.0 cm 92.9 (92/99) 93.9 (93/99) 90.9 (90/99)
> 2.0 cm 100 (81/81) 100 (81/81) 100 (81/81)
Mean 92.0 (196/213) 92.4 (197/213) 92.4 (197/213)
Specificity (%)
< 1.0 cm 98.9 (1225/1239) 99.1 (1229/1239) 99.1 (1229/1239)
1.0-2.0 cm 99.7 (1169/1173) 99.4 (1167/1173) 99.7 (1169/1173)
> 2.0 cm 99.8 (1189/1191) 99.8 (1189/1191) 99.7 (1188/1191)
Mean 99.5 (3583/3603) 99.6 (3585/3603) 99.6 (3586/3603)
MR imaging were attributed to arterio-portal (AP) shunts and high-flow hemangioma. AP shunts usually exhibit intense en- hancement on arterial phase images and identical signal intensi- ty to that of surrounding liver parenchyma on GA-enhanced equilibrium or hepatobiliary phase MR imaging. The presence of high signal intensity on T2WI for hemangioma could be helpful for differentiating high-flow hemangiomas from HCC.
AP shunts and hemangioma could not be false-positive findings because the assessment in our study included moderate, heavily T2WI and hepatobiliary phase MR imaging.
The numbers of false-negative lesions by three observers were same between the 10, 15 and 20 minutes images. Fifty-four HCCs, which were interpreted as a false-negative lesions from the 3 phases for each observer were too small to be interpreted as such according to the diagnostic criteria, were isointense to the surrounding parenchyma on T2WI, or overlooked because of intravascular structures. Small HCCs may not show definite hypointensity on hepatobiliary phase MR imaging due to reten- tion of GA in well-differentiated HCC and/or decreased paren- chymal enhancement in the cirrhotic background liver (32). Ac- cording to the diagnostic criteria of our study, since small HCCs did not show a definite hypointensity on hepatobiliary phase the sensitivities of hepatobiliary phase MR imaging for detect-
ing HCCs smaller than 3 cm were 92.0, 92.4 and 92.4% at 10 min, 15 min, and 20 min, respectively. Our result was consistent with previous reports because of the same contrast medium and the small HCC size in cirrhotic liver chosen.
However, pre-enhanced and dynamic phase images may lead to an increased in detection of HCC. Small HCCs showing typi- cal arterial enhancement and washout on portal or delayed phase images were seen as isointense or slightly hypointense lesions on hepatobiliary phase image. The reason of decreased detection of HCC may be related to residual hepatocyte activity due to well- differentiated lesion and heterogeneous hepatic parenchyma due to the presence of cirrhotic nodules.
In our study, the numbers of false-positive lesions by 3 ob- servers were similar between 10 min, 15 min, and 20 min imag- es. The false-positive lesions were caused by intrahepatic vascu- lature and cirrhotic nodules. The liver parenchyma of cirrhotic liver appeared heterogeneous due to the presence of cirrhotic nodules of variable sizes and signal intensity interdispersed in a mesh of hypointense fibrotic scars that may be fine, coarse, nod- ular or confluent (32). Previous reports (28, 30) showed that the false-positive findings for detection of HCCs on GA-enhanced
Fig. 3. MR images in 57-year-old man with HCC (arrow) in liver segment IV. Preenhanced image (A), gadoxetic acid-enhanced T1WIs obtained 30 s (B), 180 s (C), 10 minutes (D), 15 minutes (E) and 20 minutes (F) after contrast injection show a 1 cm HCC. This HCC is overlooked by all three observers because of multiple cirrhotic nodules of variable sizes. This HCC is confirmed by typical imaging finding on liver MRI (enhance- ment on arterial phase and washout on portal or delayed phase images).
Note.-HCC = hepatocellular carcinomas, T1WI = T1 weighted image D
A
E B
F C
Schumacher G, Balzer T, et al. Liver tumors: comparison of MR imaging with Gd-EOB-DTPA and Gd-DTPA. Radiology 1996;200:59-67
6. Saito K, Kotake F, Ito N, Ozuki T, Mikami R, Abe K, et al. Gd- EOB-DTPA enhanced MRI for hepatocellular carcinoma:
quantitative evaluation of tumor enhancement in hepato- biliary phase. Magn Reson Med Sci 2005;4:1-9
7. Hammerstingl R, Huppertz A, Breuer J, Balzer T, Blakebor- ough A, Carter R, et al. Diagnostic efficacy of gadoxetic acid (Primovist)-enhanced MRI and spiral CT for a therapeutic strategy: comparison with intraoperative and histopatho- logic findings in focal liver lesions. Eur Radiol 2008;18:457- 467
8. Lee JM, Zech CJ, Bolondi L, Jonas E, Kim MJ, Matsui O, et al.
Consensus report of the 4th International Forum for Gado- linium-Ethoxybenzyl-Diethylenetriamine Pentaacetic Acid Magnetic Resonance Imaging. Korean J Radiol 2011;12:
403-415
9. Reimer P, Rummeny EJ, Daldrup HE, Hesse T, Balzer T, Tom- bach B, et al. Enhancement characteristics of liver metas- tases, hepatocellular carcinomas, and hemangiomas with Gd-EOB-DTPA: preliminary results with dynamic MR im- aging. Eur Radiol 1997;7:275-280
10. Ahn SS, Kim MJ, Lim JS, Hong HS, Chung YE, Choi JY. Add- ed value of gadoxetic acid-enhanced hepatobiliary phase MR imaging in the diagnosis of hepatocellular carcinoma.
Radiology 2010;255:459-466
11. Chou CT, Chen YL, Su WW, Wu HK, Chen RC. Characteriza- tion of cirrhotic nodules with gadoxetic acid-enhanced magnetic resonance imaging: the efficacy of hepatocyte- phase imaging. J Magn Reson Imaging 2010;32:895-902 12. Sano K, Ichikawa T, Motosugi U, Sou H, Muhi AM, Matsu-
da M, et al. Imaging study of early hepatocellular carcino- ma: usefulness of gadoxetic acid-enhanced MR imaging.
Radiology 2011;261:834-844
13. Goodwin MD, Dobson JE, Sirlin CB, Lim BG, Stella DL. Di- agnostic challenges and pitfalls in MR imaging with hepa- tocyte-specific contrast agents. Radiographics 2011;31:
1547-1568
14. Cruite I, Schroeder M, Merkle EM, Sirlin CB. Gadoxetate disodium-enhanced MRI of the liver: part 2, protocol op- timization and lesion appearance in the cirrhotic liver. AJR MR imaging, it was not regarded as HCC.
Our study has several limitations: first, only 20 HCCs were pathologically confirmed, the rest of the reference tumors were diagnosed by imaging and clinical data. The inclusion of only those lesions that were confirmed at pathologic examination could have led to a verification bias. Second, this study included 51 patients with cirrhosis of Child-Pugh class A, which corre- sponded to liver cirrhosis. It was possible that they had relatively normal liver function. The number of patients with Child-Pugh class B or C, which could lead to an increased false negative rate, was too small to compare the other 2 classes. We could not com- pare quantitative and qualitative evaluation of the reference tu- mors according to liver function in the hepatobiliary phase MR imaging. Further studies should be performed to compare dif- ferences of qualitative and quantitative evaluation between Child- Pugh classes of A, B and C.
In conclusion, hepatobiliary phase MR imaging obtained 10 min, 15 min, and 20 min yield comparable diagnostic informa- tion, so that the choice of scan delay can be adapted according to the clinical routine needs to evaluate small-sized HCCs in cir- rhotic liver.
REFERENCES
1. Frericks BB, Loddenkemper C, Huppertz A, Valdeig S, Stroux A, Seja M, et al. Qualitative and quantitative evaluation of hepatocellular carcinoma and cirrhotic liver enhancement using Gd-EOB-DTPA. AJR Am J Roentgenol 2009;193:
1053-1060
2. Ringe KI, Husarik DB, Sirlin CB, Merkle EM. Gadoxetate di- sodium-enhanced MRI of the liver: part 1, protocol opti- mization and lesion appearance in the noncirrhotic liver.
AJR Am J Roentgenol 2010;195:13-28
3. Hamm B, Staks T, Mühler A, Bollow M, Taupitz M, Frenzel T, et al. Phase I clinical evaluation of Gd-EOB-DTPA as a hepatobiliary MR contrast agent: safety, pharmacokinet- ics, and MR imaging. Radiology 1995;195:785-792 4. Reimer P, Rummeny EJ, Shamsi K, Balzer T, Daldrup HE,
Tombach B, et al. Phase II clinical evaluation of Gd-EOB- DTPA: dose, safety aspects, and pulse sequence. Radiology 1996;199:177-183
5. Vogl TJ, Kümmel S, Hammerstingl R, Schellenbeck M,
2nd ed. New York: John Wiley & Sons, 1981:212-236 26. Tajima T, Takao H, Akai H, Kiryu S, Imamura H, Watanabe Y,
et al. Relationship between liver function and liver signal intensity in hepatobiliary phase of gadolinium ethoxyben- zyl diethylenetriamine pentaacetic acid-enhanced mag- netic resonance imaging. J Comput Assist Tomogr 2010;
34:362-366
27. Lee WJ, Cha SH, Kim MY, Chung HH, Lee SW, Yi A, et al.
Quantitative evaluation of the hepatic parenchymal change in patients with chronic liver disease using Gd-EOB-DTPA- enhanced MRI: comparison with normal liver. J Korean Soc Radiol 2011;64:49-55
28. Haradome H, Grazioli L, Tinti R, Morone M, Motosugi U, Sano K, et al. Additional value of gadoxetic acid-DTPA- enhanced hepatobiliary phase MR imaging in the diagno- sis of early-stage hepatocellular carcinoma: comparison with dynamic triple-phase multidetector CT imaging. J Magn Reson Imaging 2011;34:69-78
29. Park Y, Kim SH, Kim SH, Jeon YH, Lee J, Kim MJ, et al. Ga- doxetic acid (Gd-EOB-DTPA)-enhanced MRI versus gado- benate dimeglumine (Gd-BOPTA)-enhanced MRI for pre- operatively detecting hepatocellular carcinoma: an initial experience. Korean J Radiol 2010;11:433-440
30. Kim SH, Kim SH, Lee J, Kim MJ, Jeon YH, Park Y, et al. Ga- doxetic acid-enhanced MRI versus triple-phase MDCT for the preoperative detection of hepatocellular carcinoma.
AJR Am J Roentgenol 2009;192:1675-1681
31. Kim YK, Kim CS, Han YM, Kwak HS, Jin GY, Hwang SB, et al. Detection of hepatocellular carcinoma: gadoxetic acid- enhanced 3-dimensional magnetic resonance imaging versus multi-detector row computed tomography. J Com- put Assist Tomogr 2009;33:844-850
32. Golfieri R, Renzulli M, Lucidi V, Corcioni B, Trevisani F, Bolondi L. Contribution of the hepatobiliary phase of Gd- EOB-DTPA-enhanced MRI to Dynamic MRI in the detec- tion of hypovascular small (≤ 2 cm) HCC in cirrhosis. Eur Radiol 2011;21:1233-1242
Am J Roentgenol 2010;195:29-41
15. Nilsson H, Nordell A, Vargas R, Douglas L, Jonas E, Blomqvist L. Assessment of hepatic extraction fraction and input rel- ative blood flow using dynamic hepatocyte-specific con- trast-enhanced MRI. J Magn Reson Imaging 2009;29:
1323-1331
16. Ryeom HK, Kim SH, Kim JY, Kim HJ, Lee JM, Chang YM, et al. Quantitative evaluation of liver function with MRI Us- ing Gd-EOB-DTPA. Korean J Radiol 2004;5:231-239 17. Motosugi U, Ichikawa T, Tominaga L, Sou H, Sano K, Ichi-
kawa S, et al. Delay before the hepatocyte phase of Gd- EOB-DTPA-enhanced MR imaging: is it possible to shorten the examination time? Eur Radiol 2009;19:2623-2629 18. Zech CJ, Grazioli L, Breuer J, Reiser MF, Schoenberg SO. Di-
agnostic performance and description of morphological features of focal nodular hyperplasia in Gd-EOB-DTPA- enhanced liver magnetic resonance imaging: results of a multicenter trial. Invest Radiol 2008;43:504-511
19. Willatt JM, Hussain HK, Adusumilli S, Marrero JA. MR Imag- ing of hepatocellular carcinoma in the cirrhotic liver: chal- lenges and controversies. Radiology 2008;247:311-330 20. Kudo M, Han KH, Kokudo N, Cheng AL, Choi BI, Furuse J,
et al. Liver Cancer Working Group report. Jpn J Clin Oncol 2010;40 Suppl 1:i19-i27
21. Pugh RN, Murray-Lyon IM, Dawson JL, Pietroni MC, Wil- liams R. Transection of the oesophagus for bleeding oe- sophageal varices. Br J Surg 1973;60:646-649
22. Chakraborty DP, Winter LH. Free-response methodology:
alternate analysis and a new observer-performance ex- periment. Radiology 1990;174(3 Pt 1):873-881
23. Hanley JA, McNeil BJ. A method of comparing the areas under receiver operating characteristic curves derived from the same cases. Radiology 1983;148:839-843
24. Bennett BM. On comparisons of sensitivity, specificity and predictive value of a number of diagnostic procedures.
Biometrics 1972;28:793-800
25. Fleiss JL, Levin B, Paik MC. The measurement of interrater agreement. Statistical methods for rates and proportions,
간경변증 환자에서 소간세포암평가를 위한 Gadoxetic Acid 조영증강 자기공명영상의 적절한 스캔지연1
이지현
2· 정용연
1· 허숙희
1· 신상수
2· 김진웅
1· 강형근
1목적: 간경변증 환자에서 3 cm 이하의 소간세포암평가를 위한 gadoxetic acid 조영증강 자기공명영상의 hepatobiliary phase의 적절한 스캔지연에 대하여 평가하였다.
대상과 방법: Gadoxetic acid 조영증강 자기공명영상 hepatobiliary phase를 시행한 53명의 간경변증 환자가 포함되었다.
Hepatobiliary phase 영상은 조영제 주입 후 10, 15, 20분 후에 얻었다. 정량분석으로 신호대잡음비(signal-to-noise ratio), 간세포암과 간실질의 조영증강비(enhancement ratio), 대조잡음비(contrast-to-noise)를 측정하였다. 정성분석을 위해 세 명의 영상의가 10, 15, 20분 영상에서 병소뚜렷함을 측정하였으며 진단 정확도를 위해 Az를 비교하였다. 민감도와 특이도 를 측정하였다.
결과: 10, 15, 20분 자기공명영상에서 신호대잡음비, 간세포암과 간실질의 조영증강비, 대조잡음비는 뚜렷한 차이를 보 이지 않았다(p = 0.769, 0.119, 0.569 and 0.279). Lesion possibility의 Az value는 10, 15, 20분 영상에서 의미있는 차 이를 보이지 않았다(Az = 0.961, 0.961 and 0.960). 민감도와 특이도에서도 뚜렷한 차이를 보이지 않았다(p > 0.05).
결론: 간경변증 환자에서 3 cm 이하의 소간세포암평가를 위한 gadoxetic acid 조영증강 자기공명영상 10, 15분 영상은 20분 영상과 큰 차이 없으며, 10, 15분 영상이 20분 지연 없이 대체할 수 있다.
1전남대학교 의과대학 화순전남대학교병원 영상의학과, 2전남대학교 의과대학 전남대학교병원 영상의학과