Background and Purpose Epidemiological studies have suggested the presence of strong correlations among diet, lifestyle, and dementia onset. However, these studies have unfortu- nately had major limitations due to their inability to fully control the various potential con- founders affecting the nutritional status. The purpose of the current study was to determine the nutritional status of participants in the Korean Brain Aging Study for the Early Diagnosis and Prediction of Alzheimer’s Disease (KBASE) and to identify clinical risk factors for being at risk of malnutrition or being malnourished.
Methods Baseline data from 212 participants [119 cognitively unimpaired (CU), 56 with mild cognitive impairment (MCI), and 37 with dementia] included in the KBASE database were an- alyzed. All participants underwent a comprehensive cognitive test and MRI at baseline. The presence of malnutrition at baseline was measured by the Mini Nutritional Assessment score.
We examined the cross-sectional relationships of clinical findings with nutritional status using multiple logistic regression applied to variables for which p<0.2 in the univariate analysis. Dif- ferences in cortical thickness according to the nutritional status were also investigated.
Results After adjustment for demographic, nutritional, and neuropsychological factors, par- ticipants with dementia had a significantly higher odds ratio (OR) for being at risk of malnu- trition or being malnourished than CU participants [OR=5.98, 95% CI=1.20–32.97] whereas participants with MCI did not (OR=0.62, 95% CI=0.20–1.83). Cortical thinning in the at-risk/
malnutrition group was observed in the left temporal area.
Conclusions Dementia was found to be an independent predictor for the risk of malnutrition compared with CU participants. Our findings further suggest that cortical thinning in left tem- poral regions is related to the nutritional status.
Key Words nutritional status, dementia, cerebral cortex.
Association of Nutritional Status with Cognitive Stage in the Elderly Korean Population:
The Korean Brain Aging Study for the Early Diagnosis and Prediction of Alzheimer’s Disease
INTRODUCTION
The number of people with dementia is estimated to double every 20 years and will reach approximately 40 million worldwide by 2020 due to the increasing aging of the world’s pop- ulation.1 There are 9.9 million new cases of dementia each year,2 and so health care costs will increase exponentially over time.3 It has been hypothesized that if the onset of Alzheimer’s disease (AD), the most common type of dementia, could be delayed in all patients by 2 years, the worldwide prevalence in 2050 might be 22 million lower than the current esti- mates, which would significantly reduce the associated costs.4 It is now well established that dementia includes a long phase of preclinical pathological changes that occur prior to Jae-Won Janga, Yeshin Kima
Yong-Ho Choib, Jong-Min Leeb Bora Yoonc, Kyung Won Parkd Si Eun Kime, Hee Jin Kimf Soo Jin Yoong, Jee Hyang Jeongh Eun-Joo Kimi, Na Yeon Jungi Jihye Hwangj, Ju-Hee Kangk Jin Yong Hongl, Seong Hye Choim
a Department of Neurology, Kangwon National University Hospital, Kangwon National University College of Medicine, Chuncheon, Korea
b Department of Biomedical Engineering, Hanyang University, Seoul, Korea
c Department of Neurology, Konyang University College of Medicine, Daejeon, Korea
d Department of Neurology, Dong-A Medical Center, Dong-A University College of Medicine, Busan, Korea
e Department of Neurology, Inje University College of Medicine, Haeundae Paik Hospital, Busan, Korea
f Department of Neurology, Samsung Medical Center, Sungkyunkwan University School of Medicine, Seoul, Korea
g Department of Neurology, Eulji University College of Medicine, Daejeon, Korea
h Department of Neurology, Ewha Womans University School of Medicine, Seoul, Korea
i Department of Neurology, Pusan National University School of Medicine, Busan, Korea
j Department of Neurology, Keimyung University Dongsan Medical Center, Daegu, Korea
k Department of Pharmacology and Medicinal Toxicology Research Center, Inha University School of Medicine, Incheon, Korea Department of Neurology, Yonsei University l
Wonju College of Medicine, Wonju, Korea
m Department of Neurology, Inha University School of Medicine, Incheon, Korea
pISSN 1738-6586 / eISSN 2005-5013 / J Clin Neurol 2019;15(3):292-300 / https://doi.org/10.3988/jcn.2019.15.3.292
Received August 2, 2018 Revised December 15, 2018 Accepted December 18, 2018 Correspondence
Seong Hye Choi, MD, PhD Department of Neurology, Inha University School of Medicine, 27 Inhang-ro, Jung-gu, Incheon 22332, Korea Tel +82-32-890-3860
Fax +82-32-890-3864 E-mail [email protected] Jin Yong Hong, MD, PhD Department of Neurology, Yonsei University Wonju College of Medicine, 20 Ilsan-ro, Wonju 26426, Korea
Tel +82-33-741-0525 Fax +82-33-741-1365 E-mail [email protected]
cc This is an Open Access article distributed under the terms of the Creative Commons Attribution Non-Com- mercial License (https://creativecommons.org/licenses/by-nc/4.0) which permits unrestricted non-commercial use, distribution, and reproduction in any medium, provided the original work is properly cited.
JCN
Open Access ORIGINAL ARTICLEJang JW et al.
JCN
the manifestation of clinical symptoms. Hence, it is neces- sary to identify modifiable factors and early interventions that can be a focus of therapy during these preclinical or pro- dromal stages of the disease.5
Numerous epidemiological studies have consistently sug- gested the presence of strong correlations among diet, life- style, and onset of dementia.6-9 Malnutrition is defined as an inappropriate nutritional status characterized by poor appe- tite, insufficient dietary intake, weight loss, and muscle wast- ing.10 Malnutrition places older adults at increased risks of depression, infection, falls, and low psychological well-being.11 Elderly patients with dementia may suffer from malnutrition because they are often unable to eat independently and ex- hibit a reduced appetite.12 Unfortunately, the studies designed to confirm malnutrition as a modifiable risk factor for de- mentia have been restricted by the complexity of nutrition science,5 which indicates that there is a wide array of potential confounders that cannot be fully controlled when analyzing and designing studies related to nutrition.
This study used the Mini Nutritional Assessment (MNA) to assess the relationship between cognitive stage and nutri- tional status. We further examined differences in brain vol- ume between a well-nourished group and an at-risk/malnu- trition group to evaluate the relationship between malnutrition and cognitive change. Our hypothesis was that lower nutri- tional status is independently related to dementia, as well as to cerebral structural changes that might be associated with cognition.
METHODS
The data analyzed in this study were obtained from the Kore- an Brain Aging Study for the Early Diagnosis and Prediction of Alzheimer’s Disease (KBASE). The KBASE is an ongoing prospective cohort study that started in 2014 and was de- signed to identify new biomarkers for AD and also AD-related structural and functional cerebral changes. The Institutional Review Board of Kangwon National University approved this study, which was performed in accordance with the tenets of the Declaration of Helsinki (approval number: KNUH-2015- 04-009-005).
Participants
Participants were recruited from nine university hospital across South Korea. As of April 2017, 212 participants who were 55 years or older were initially enrolled in the study. Among the subjects, 119 were cognitively unimpaired (CU), 56 had mild cognitive impairment (MCI), and 37 had clinically diagnosed AD. All of the subjects underwent a comprehensive KBASE baseline assessment that included a clinical examination, neu-
ropsychological tests, MRI, amyloid PET, and a blood test.
The CU group (aged 55–90 years) consisted of subjects with a global Clinical Rating Scale (CDR) score of 0 and with- out a diagnosis of MCI or dementia. Subjects with MCI (aged 55–90 years) met the following criteria: 1) memory complaint reported by themselves or by an informant or a cli- nician, 2) presence of objective memory impairment, 3) in- tact functional activities, and 4) no dementia. All MCI sub- jects had a global CDR score of 0.5. With respect to criterion 2), MCI individuals scored at least one SD below the respec- tive age-, education-, and sex-specific mean values in at least one of the four memory tests that were part of the Consor- tium to Establish a Registry for Alzheimer’s Disease (CERAD) neuropsychological battery (namely, Word List Memory, Word List Recall, Word List Recognition, and Construc- tional Recall tests).13 The following inclusion criteria were ap- plied to patients with AD (aged 55–90 years): 1) meeting both the criteria of the Diagnostic and Statistical Manual, 4th Edi- tion for dementia14 and the criteria for probable AD in the National Institute on Aging and Alzheimer’s Association guidelines,15 and 2) having a global CDR score of 0.5 or 1. The exclusion criteria were 1) presence of any psychiatric or neu- rological disorders that could affect mental function, 2) se- vere communication problems that would made assessments or brain scans difficult, 3) contraindications for MRI scan- ning, 4) absence of a reliable informant, or 5) being illiterate.
Neuropsychological assessment
All participants underwent a standardized clinical assessment by a trained clinician based on the KBASE protocol, which corresponded with the Korean version of the CERAD-K as- sessment packet.16 In addition, participants underwent a KBASE neuropsychological assessment by trained neuropsy- chologists that included the CERAD neuropsychological battery,13 which contained the Mini Mental State Examina- tion (MMSE).
Amyloid PET
Seventy-nine participants underwent simultaneous three- dimensional (3D) [11C] Pittsburgh Compound B (PiB) PET and 3D T1-weighted MRI using a 3.0-Tesla PET-MRI scan- ner (Siemens, Washington D.C., DC, USA). A 30-minute emission scan was performed 40 minutes after the intrave- nous administration of a mean of 555 MBq of [11C] PiB (range, 450–610 MBq). The PiB-PET data collected in list mode were processed for routine corrections such as uniformity, ultrashort echo time-based attenuation, and decay correc- tions, and were reconstructed into a 256×256 image matrix using iterative methods (6 iterations with 21 subsets). Amy- loid PET scans using [18F]-flutemetamol were obtained in 131
Nutritional Status and Cognition
JCN
subjects. These participants underwent a 20-minute emission scan at 90 minutes after the intravenous injection of 185 MBq of [18F]-flutemetamol. Low-dose CT was performed for attenuation correction before all scans. The images were reconstructed in a 256×256×109 matrix with a voxel size of 1.33×1.33×1.5 mm3 using a 2D ordered subset expectation maximization algorithm (8 iterations and 16 subsets), and they were corrected for physical effects including radiation atten- uation and scatter.
The mean standardized uptake value ratio (SUVR) was determined for each subject by dividing the mean value for all voxels within the volume of interest (VOI) by the mean uptake value for cerebellar gray matter. β-amyloid (Aβ)-positive and Aβ-negative statuses were defined according to SUVR criteria of ≥1.4 for PiB PET and ≥0.634 for [18F]-flute- metamol PET. These criteria were taken from the KBASE database as the composite VOI SUVR with the highest accu- racy for discriminating between CU subjects and patients with AD.
MRI acquisition, processing, and cortical thickness measurement
All of the participants were scanned using 3-Tesla MRI with protocols based on the Alzheimer’s Disease Neuroimaging Initiative-2 MRI protocols. The 3D T1-weighted MRI scans were acquired from 212 participants with the following pa- rameters: TR=7.32 ms, TE=3.02 ms, inversion time (TI)=400 ms, flip angle=11°, and a voxel resolution of 0.8×0.8×0.8 mm3 for the GE MRI device (GE Healthcare, Milwaukee, WI, USA); TR=shortest (6.8 ms), TE=shortest (3.1 ms), flip an- gle=9°, and a voxel resolution of 0.8×0.8×0.8 mm3 for the Philips MRI device (Philips Healthcare, Andover, MA, USA);
and TR=2,300 ms, TE=2.14 ms, TI=900 ms, flip angle=9°, and a voxel resolution of 0.8×0.8×0.8 mm3 for the Siemens MRI device.
Images were processed using the CIVET anatomical pipe- line (version 2.1; http://mcin.ca/technology/civet/).17 The T1- weighted images in native space were aligned to the Montreal Neurological Institute 152 standard space.18 The N3 algo- rithm was used to correct for inhomogeneities caused by in- tensity nonuniformities of the magnetic field.19 Nonbrain tis- sue was excluded using the BET algorithm.20 The registered and corrected images were classified into gray matter, white matter, and cerebrospinal fluid using an advanced neural-net classifier.21 The inner surfaces of the cortex were extracted from a defined white-matter mask, and then the outer surface of the cortex was automatically extracted using the Constrained Laplacian-based Automated Segmentation with Proximities algorithm.22 The cortical thickness values were calculated in native space using the Euclidean distance between the linked
vertices of the inner and outer surfaces. The thickness values in corresponding regions were compared between individ- uals using surface-based 2D registration with a sphere-to- sphere warping algorithm to spatially normalize the cortical thickness values.23 These values were subsequently smoothed using a surface-based diffusion kernel in order to increase the signal-to-noise ratio. We chose a 30-mm full-width at half- maximum kernel to maximize the statistical power while min- imizing false positives.24 Finally, we divided the cortical sur- face into 78 regions with an automated anatomical labeling template excluding the cerebellum and subcortical regions,25 and calculated the regional cortical thickness values.
Laboratory tests for blood samples
Overnight fasting blood samples were collected in the morn- ing by venipuncture. The baseline routine blood laboratory tests included in this study were of hemoglobin, albumin, and serum lipids. Genomic DNA was extracted from whole blood, and ApoE genotyping was performed as described previously.26
Assessment of nutritional and related-factors status Nutritional status was measured using the MNA, which is widely used for evaluating the nutritional status of the elderly.
This assessment method has been well validated internation- ally and has a high sensitivity, specificity, and reliability. The MNA consists of 18 questions, with the total MNA score rang- ing from 0 to 30, and a higher score indicating a better nutri- tional status. The total score was used to classify each patient into well nourished (MNA score >23.5), at risk of malnutri- tion (MNA score=17.0–23.5), or malnourished (MNA score
<17).27,28 Appetite was measured with the Simplified Nutri- tional Appetite Questionnaire (SNAQ) that was developed for a hospital outpatient population.29 The body mass index (BMI) was calculated for all subjects using their heights and weights.
Statistical analysis
Independent t-tests and chi-square tests were used to iden- tify between-group differences in continuous variables and categorical variables, respectively. We examined the cross- sectional relation of being at risk of malnutrition or being malnourished to the clinical diagnosis using multiple logis- tic regression. The criterion for a variable being retained in multiple logistic regression was p<0.2 in the univariate analy- sis, and clinically important measures that were also included in the pool of predictors were age, sex, education level, MMSE score, Clinical Rating Scale Sum of Boxes (CDR-SOB) score, BMI, Geriatric Depression Scale (GDpS) score, SNAQ score, Aβ status, and hemoglobin level, as well as the final diagno-
Jang JW et al.
JCN
sis. Multicollinearity among the covariates was tested by calculating the variance inflation factor.30
The criterion for statistical significance was set at p<0.05.
Statistical analyses were performed with R software (version 3.3.2, 64-bit platform, The R Foundation for Statistical Com- puting; https://www.r-project.org/about.html). To identify differences in cortical thickness between groups, we first per- formed independent two-sample t-tests on a vertex-wise ba- sis and in 78 regions of interest, with the age, sex, education level, SNAQ score, MMSE score, GDpS score, Aβ status, clini- cal diagnosis, and mean cortical thickness of the whole brain as covariates. To identify the brain regions that were correlat- ed with clinical test results, we performed a partial correlation analysis between the regional cortical thickness and MNA score, with age, sex, education level, SNAQ score, MMSE score, GDpS score, Aβ status, and clinical diagnosis as covariates.
These correlation analyses were performed using a surface model. The significance level for statistical analyses was thres- holded at a false-discovery-rate-corrected p value of <0.0531.31
RESULTS
The demographic and clinical characteristics of the cohort are listed in Table 1. The prevalence of malnutrition was 1.9%
(n=4), while 30.7% (n=65) of the participants were at risk of malnutrition. Because the prevalence of malnutrition was very low, we grouped malnutrition and at risk of malnutrition into an at-risk/malnutrition group (n=69, 32.6%), and these participants were compared with those in the well-nourished group (n=143, 67.4%).
There were significant group differences in sex, age, and education level between the two groups. Participants in the at- risk/malnutrition group were significantly older, more likely to be female, and had a lower education level than partici- pants in the well-nourished group. The prevalence of demen- tia was significantly higher in the at-risk/malnutrition group than the well-nourished group (5.6% vs. 42.0%). The MMSE score, SNAQ score, BMI, and hemoglobin level were lower in the at-risk/malnutrition group, while the CDR-SOB and GDpS scores were higher. There was no significant difference in the frequency of the ApoE ε4 genotype; however, amy- loid positivity in amyloid PET was more common in the at- risk/malnutrition group. Among 62 subjects with amyloid positivity, 24 were positive in PiB PET and 38 were positive in [18F]-flutemetamol PET. In terms of clinical staging, amyloid positivity was observed in 14 (11.8%) subjects with CU, 19 (33.9%) subjects with MCI, and 30 (80.6%) subjects with de- mentia. There was no significant difference between the am- yloid-positive and amyloid-negative dementia patients in the MNA score (21.36±3.39 vs. 23.21±2.63, mean±SD, p=0.187)
or overall cortical thickness (2.96±0.17 vs. 2.96±0.11 mm, p=0.942).
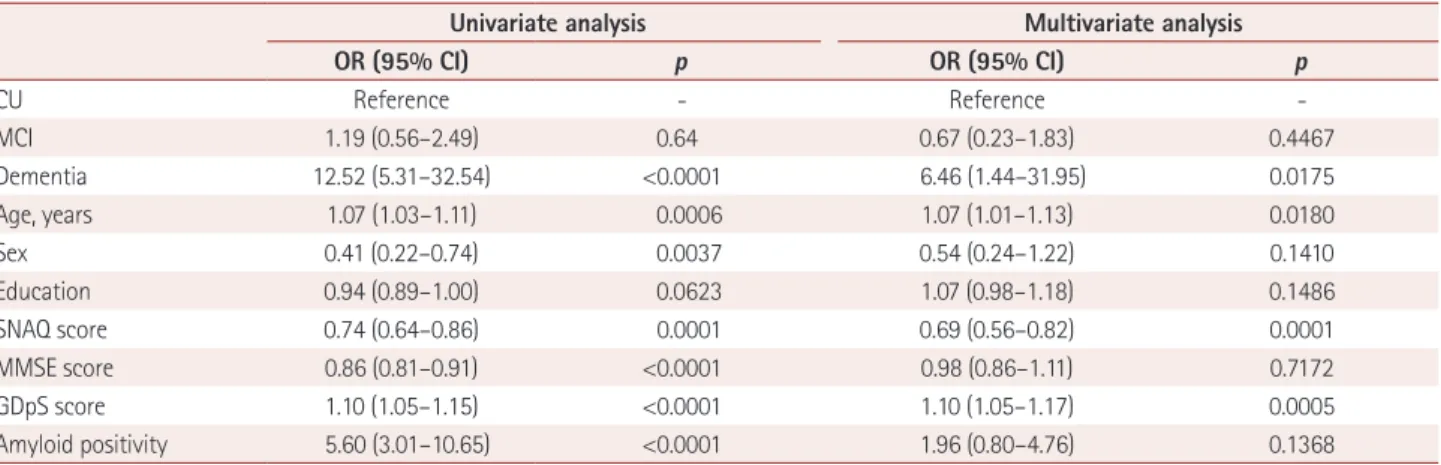
The risk factors for at-risk/malnutrition, as assessed by multivariate logistic regression analysis, are presented in Ta- ble 2. The CDR-SOB score was statistically relevant, but its variance inflation factor was 3.088 and so it was excluded as a covariate. In the univariate analysis, participants with de- mentia showed a significantly increased odds ratio (OR) for at-risk/malnutrition of 12.52 (95% CI=5.31–32.54) compared with CU participants. Higher age and male sex were associat- ed with at-risk/malnutrition, as were lower SNAQ and MMSE scores, higher GDpS score, and amyloid-positivity in PET.
In multivariate analysis performed with the statistically rel- evant variables described above, dementia remained signifi- cantly associated with at risk/malnutrition (OR=6.46, 95%
CI=1.44–31.95). There was no significant association be- tween MCI and nutritional status, but there was a significant difference between subjects with MCI and subjects with de- mentia when MCI was used as a reference (OR=9.62, 95%
CI=2.58–39.73). The significant independent risk predictors for at-risk/malnutrition also included age (OR=1.07, 95% CI=
1.01–1.13), SNAQ score (OR=0.69, 95% CI=0.56–0.82), and GDpS score (OR=1.10, 95% CI=1.05–1.17).
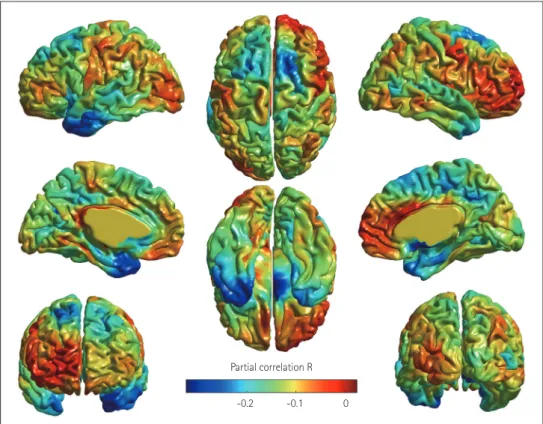
Compared with the well-nourished group, participants in the at-risk/malnutrition group showed cortical thinning pri- marily in the left temporal area that included the left supe- rior temporal gyrus, left temporal pole, and left insula after adjustment for age, sex, education level, SNAQ score, MMSE score, GDpS score, amyloid status, clinical diagnosis, and mean cortical thickness (uncorrected p<0.05) (Fig. 1). A sig- nificant negative correlation was observed between MNA score and cortical thickness in the temporal pole after adjust- ment for covariates (uncorrected p<0.05) (Fig. 2).
DISCUSSION
This study found a significant relationship between dementia and the risk of malnutrition after adjustment for other possi- ble confounding factors. The risk of malnutrition differed significantly between subjects with MCI and those with de- mentia, but not between CU participants and those with MCI.
In a comparison with other significant risk factors for mal- nutrition such as poor appetite, BMI, and depressive symp- toms, the strongest risk factor was a diagnosis of dementia.
In the present study, the prevalence of being at risk of malnu- trition (MNA score ≤23.5) was 78.3% (29/37) among the participants with dementia (Table 1), which is consistent with previous studies that found high prevalence rates of mal- nutrition in newly diagnosed dementia patients, ranging from 26% to 80%.32-39 Notably, 25% (14/56) of participants with
Nutritional Status and Cognition
JCN
Fig. 1. Cortical thinning was associated with the risk of malnutrition in the Korean Brain Aging Study for the Early Diagnosis and Prediction of Al- zheimer’s Disease cohort. Regions with significant between-group differences in cortical thickness appeared in the left temporal area after adjust- ment for covariates. Clusters where the thickness was less in the at-risk/malnutrition group than in the well-nourished group are indicated in red.
Fig. 2. Regions showing significant partial correlations between Mini Nutritional Assessment score and regional cortical thickness in the left temporal pole after adjustment for covariates. Clusters where the negative correlation was significantly stronger in all of the participants are indicated in blue.
Uncorrected p-value
0 0.02 0.04
Partial correlation R -0.2 -0.1 0
Jang JW et al.
JCN
MCI and 21.8% (26/119) of the CU participants exhibited a risk of malnutrition, and so we suspect that the nutritional imbalance associated with cognitive decline increases during the progression of dementia, rather than solely during the pre- dementia stage. This assumption is partly consistent with a previous study finding that a longer disease duration of de- mentia was related to a higher frequency of being at risk of malnutrition.32 The presence of a live-in caregiver might be one of the most important factors influencing the nutrition- al status of elderly subjects, especially patients with demen- tia. However, we found no group differences with respect to caregiver status between the well-nourished and at-risk/mal- nutrition groups (Table 1). Additionally, the numbers of el- derly subjects living alone in the present CU, MCI, and de- mentia groups were 9 (7.6%), 9 (16.1%), and 5 (13.5%), with no significant differences (p=0.204).
Regarding the association between dementia and malnu- trition, a previous study suggested that the inability of many
subjects with dementia to eat independently due to difficul- ties in swallowing, chewing, and recognizing hunger can re- sult in malnutrition if aid is not provided by a caregiver.40 As dementia progresses in elderly individuals, a decreased food intake due to mealtime difficulties reduces their quality of life and physical health. In addition to the inability to eat sat- isfactorily, some studies have suggested that individuals with dementia experience weight loss that worsens with the progression of dementia.41 Moreover, subjects with dementia are more likely to be adversely affected by disabilities or co- morbidities compared to subjects without dementia; this dis- parity can also lead to poor diet and malnutrition.42
Decreased appetite and BMI as well as depressive symp- toms were also independently related to the nutritional status (Table 2). Among these factors, depression is the most com- mon reversible cause of malnutrition43 and is more likely to be associated with weight loss and anorexia in older adults.44,45 Depressive symptoms are frequently considered risk factors for Table 1. Baseline characteristics of subjects according to the nutritional status
Well nourished (n=143, 67.4%) At-risk/malnutrition (n=69, 32.6%) Total (n=212) p
Age, years 68.4±7.8 72.8±8.4 69.8±8.2 <0.001
Sex, male 75 (52.4) 21 (30.4) 96 (45.3) 0.004
Education, years 10.0±5.0 8.5±4.8 9.5±5.0 0.041
Caregiver 125 (87.4) 64 (92.8) 189 (89.2) 0.349
Hypertension 62 (43.4) 32 (47.1) 94 (44.5) 0.566
DM 20 (14.0) 14 (20.6) 34 (16.1) 0.308
Diagnosis <0.001
CU 93 (65.0) 26 (37.7) 119 (56.1)
MCI 42 (29.4) 14 (20.3) 56 (26.4)
Dementia 8 (5.6) 29 (42.0) 37 (17.5)
MMSE score 25.1±3.9 21.3±6.1 23.9±5.1 <0.001
CDR-SOB score 0.5±1.1 2.3±2.7 1.1±2.0 <0.001
GDpS score 8.2±6.2 13.0±7.4 9.7±7.0 <0.001
SNAQ score 14.8±2.0 13.4±2.3 14.4±2.2 <0.001
BMI 24.5±3.6 22.5±2.7 23.9±3.4 <0.001
Albumin 4.4±0.3 4.4±0.4 4.4±0.3 0.883
Total cholesterol 179.4±37.3 181.9±34.5 180.2±36.3 0.634
HDL-C 50.8±13.3 52.6±12.8 51.4±13.1 0.341
LDL-C 103.4±30.4 106.4±30.5 104.4±30.4 0.509
Triglycerides 155.3±91.2 142.7±78.9 151.2±87.4 0.325
Hemoglobin 13.8±1.3 12.8±1.2 13.5±1.3 <0.001
ApoE ε4 0.385
0 copies 109 (76.2) 48 (69.6) 157 (74.1)
1+ copies 34 (23.8) 21 (30.4) 55 (25.9)
Amyloid positivity, n (%) 25 (17.5) 37 (54.5) 62 (29.4) <0.001
Data are mean±SD values except where indicated otherwise. Independent t-tests and chi-square tests were used to examine between-group differ- ences in continuous variables and categorical variables, respectively.
BMI: body mass index, CDR-SOB: Clinical Rating Scale Sum of Boxes, CU: cognitively unimpaired, DM: diabetes mellitus, GDpS: Geriatric Depression Scale, HDL-C: high-density lipoprotein cholesterol, LDL-C: low-density lipoprotein cholesterol, MCI: mild cognitive impairment, MMSE: Mini Mental State Examination, SNAQ: Simplified Nutritional Appetite Questionnaire.
Nutritional Status and Cognition
JCN
a cognitive decline from MCI to dementia.46,47 Given the rela- tively high prevalence of malnutrition and depressive symp- toms among elderly subjects as well as the growing focus on preventable risk factors for dementia, future research should focus on the complex relationships among these factors.
Nutrition-associated atrophy was found predominantly in the left temporal area, indicating that the vulnerable areas were not distributed symmetrically. To the best of our knowl- edge, there have been no previous reports on reductions in cortical thickness related to undernutrition of elderly sub- jects, although a small number of studies have shown that eating a healthy diet (e.g., a Mediterranean-style diet) could increase the cortical thickness and improve cognitive func- tion.48-51 Because the risk of malnutrition was found to dif- fer significantly between subjects with and without demen- tia, we speculate that malnutrition could be associated with an increased risk of dementia, which is also partly supported by the nutrition-associated atrophy observed in this study.
Enhancing the understanding of the neurobiological inter- actions between dementia and malnutrition requires longitu- dinal studies focusing on the causal relationship between cog- nitive decline and malnutrition, with consideration of both cerebral function and structure.
This study was subject to several limitations that should be considered when interpreting the findings. First, the study had a cross-sectional design, which reduced the ability to make causal inferences. Therefore, with regard to the relationship between dementia and risk of malnutrition, it was not pos- sible to determine whether a nutritional imbalance caused de- mentia or the nutritional difference was a result of decreased intake secondary to cognitive decline. Second, a less strin- gent threshold for significance was adopted when determin- ing the effect of undernutrition on cortical thickness in the surface model used in our study (p<0.05, uncorrected). Third,
there was a low prevalence rate of malnutrition (MNA score
<17), which might have reduced the intergroup difference in cortical thickness. Fourth, 7 of the 37 subjects with clini- cally diagnosed AD dementia were amyloid negative, which means that their dementia was unlikely to have been due to AD.52 Although, the nutritional index and mean cortical thickness did not differ significantly between amyloid-posi- tive and amyloid-negative dementia, the ability to draw clear conclusions or perform further analyses was restricted by the small numbers of subjects. Lastly, nutritional status was categorized using the MNA questionnaire, which contains somewhat heterogeneous factors such as the activities of dai- ly living. Therefore, detailed nutritional evaluation tools such as food-frequency questionnaires should be applied after screening by the MNA in the future in order to better address the complexity of nutritional science.
In conclusion, the nutritional status of the KBASE cohort suggested that dementia is an independent risk factor for be- ing at risk of malnutrition. The structural changes in the left temporal region constitute additional evidence for a relation- ship with nutritional status. The nutritional status of patients with dementia needs to be evaluated to ensure that they have an optimal level of nutrition.
Conflicts of Interest
The authors have no financial conflicts of interest.
Acknowledgements
This research was supported by the Original Technology Research Pro- gram for Brain Science through the National Research Foundation of Ko- rea (NRF) funded by the Korean government (MSIP) (No. 2014M3C7A 1064752) and by the Korea Health Technology R&D Project through the Korea Health Industry Development Institute (KHIDI), funded by the Ministry of Health & Welfare, Republic of Korea (HI18C0479). And, this work was also supported by the National Research Foundation of Korea (NRF) grant funded by the Korea government (MSIP) (2016R1A2B301 6609).
Table 2. Risk factors for being at risk of malnutrition or malnourished using univariate and multivariate logistic regression analyses
Univariate analysis Multivariate analysis
OR (95% CI) p OR (95% CI) p
CU Reference - Reference -
MCI 1.19 (0.56–2.49) 0.64 0.67 (0.23–1.83) 0.4467
Dementia 12.52 (5.31–32.54) <0.0001 6.46 (1.44–31.95) 0.0175
Age, years 1.07 (1.03–1.11) 0.0006 1.07 (1.01–1.13) 0.0180
Sex 0.41 (0.22–0.74) 0.0037 0.54 (0.24–1.22) 0.1410
Education 0.94 (0.89–1.00) 0.0623 1.07 (0.98–1.18) 0.1486
SNAQ score 0.74 (0.64–0.86) 0.0001 0.69 (0.56–0.82) 0.0001
MMSE score 0.86 (0.81–0.91) <0.0001 0.98 (0.86–1.11) 0.7172
GDpS score 1.10 (1.05–1.15) <0.0001 1.10 (1.05–1.17) 0.0005
Amyloid positivity 5.60 (3.01–10.65) <0.0001 1.96 (0.80–4.76) 0.1368
Data are OR (95% CI) values.
CU: cognitively unimpaired, GDpS: Geriatric Depression Scale, MCI: mild cognitive impairment, MMSE: Mini Mental State Examination, OR: odds ratio, SNAQ: Simplified Nutritional Appetite Questionnaire.
Jang JW et al.
JCN
REFERENCES
1. Ferri CP, Prince M, Brayne C, Brodaty H, Fratiglioni L, Ganguli M, et al. Global prevalence of dementia: a Delphi consensus study. Lan- cet 2005;366:2112-2117.
2. Alzheimer’s Disease International. Dementia statistics [Internet].
London: Alzheimer’s Disease International; 2015 [cited 2018 Aug 1].
Available from: https://www.alz.co.uk/research/statistics.
3. Wimo A, Guerchet M, Ali GC, Wu YT, Prina AM, Winblad B, et al.
The worldwide costs of dementia 2015 and comparisons with 2010.
Alzheimers Dement 2017;13:1-7.
4. Brookmeyer R, Evans DA, Hebert L, Langa KM, Heeringa SG, Plass- man BL, et al. National estimates of the prevalence of Alzheimer’s dis- ease in the United States. Alzheimers Dement 2011;7:61-73.
5. Otaegui-Arrazola A, Amiano P, Elbusto A, Urdaneta E, Martínez- Lage P. Diet, cognition, and Alzheimer’s disease: food for thought.
Eur J Nutr 2014;53:1-23.
6. Nicolia V, Lucarelli M, Fuso A. Environment, epigenetics and neuro- degeneration: focus on nutrition in Alzheimer’s disease. Exp Gerontol 2015;68:8-12.
7. Greenwood CE, Parrott MD. Nutrition as a component of dementia risk reduction strategies. Healthc Manage Forum 2017;30:40-45.
8. Berti V, Murray J, Davies M, Spector N, Tsui WH, Li Y, et al. Nutrient patterns and brain biomarkers of Alzheimer’s disease in cognitively normal individuals. J Nutr Health Aging 2015;19:413-423.
9. Mosconi L, Murray J, Davies M, Williams S, Pirraglia E, Spector N, et al. Nutrient intake and brain biomarkers of Alzheimer’s disease in at-risk cognitively normal individuals: a cross-sectional neuroimag- ing pilot study. BMJ Open 2014;4:e004850.
10. Ahmed T, Haboubi N. Assessment and management of nutrition in older people and its importance to health. Clin Interv Aging 2010;5:207- 11. Muurinen S, Savikko N, Soini H, Suominen M, Pitkälä K. Nutrition 216.
and psychological well-being among long-term care residents with dementia. J Nutr Health Aging 2015;19:178-182.
12. Park M, Song JA, Lee M, Jeong H, Lim S, Lee H, et al. National study of the nutritional status of Korean older adults with dementia who are living in long-term care settings. Jpn J Nurs Sci 2018;15:318-329.
13. Lee DY, Lee KU, Lee JH, Kim KW, Jhoo JH, Kim SY, et al. A norma- tive study of the CERAD neuropsychological assessment battery in the Korean elderly. J Int Neuropsychol Soc 2004;10:72-81.
14. American Psychiatric Association. Diagnostic and Statistical Manual of Mental Disorders. DSM-IV-TR [Internet]. Washington, D.C.: Amer- ican Psychiatric Association; 2000 [cited 2018 May 7]. Available from:
https://dsm.psychiatryonline.org/doi/abs/10.1176/appi.books.97808 90420249.dsm-iv-tr.
15. McKhann GM, Knopman DS, Chertkow H, Hyman BT, Jack CR Jr, Kawas CH, et al. The diagnosis of dementia due to Alzheimer’s dis- ease: recommendations from the National Institute on Aging-Alzheim- er’s Association workgroups on diagnostic guidelines for Alzheimer’s disease. Alzheimers Dement 2011;7:263-269.
16. Lee JH, Lee KU, Lee DY, Kim KW, Jhoo JH, Kim JH, et al. Develop- ment of the Korean version of the Consortium to Establish a Registry for Alzheimer’s Disease Assessment Packet (CERAD-K): clinical and neuropsychological assessment batteries. J Gerontol B Psychol Sci Soc Sci 2002;57:P47-P53.
17. Zijdenbos AP, Forghani R, Evans AC. Automatic “pipeline” analysis of 3-D MRI data for clinical trials: application to multiple sclerosis.
IEEE Trans Med Imaging 2002;21:1280-1291.
18. Collins DL, Neelin P, Peters TM, Evans AC. Automatic 3D intersubject registration of MR volumetric data in standardized Talairach space. J Comput Assist Tomogr 1994;18:192-205.
19. Sled JG, Zijdenbos AP, Evans AC. A nonparametric method for auto- matic correction of intensity nonuniformity in MRI data. IEEE Trans Med Imaging 1998;17:87-97.
20. Smith SM. Fast robust automated brain extraction. Hum Brain Mapp 2002;17:143-155.
21. Zijdenbos A, Evans AC, Riahi F, Sled JG, Chui J, Kollokian V. Auto- matic quantification of multiple sclerosis lesion volume using stereo- taxic space. In: Höhne KH, Kikinis R, editors. Visualization in Biomedi- cal Computing. Berlin: Springer, 1996;439-448.
22. Kim JS, Singh V, Lee JK, Lerch J, Ad-Dab’bagh Y, MacDonald D, et al.
Automated 3-D extraction and evaluation of the inner and outer cor- tical surfaces using a Laplacian map and partial volume effect classifi- cation. Neuroimage 2005;27:210-221.
23. Lyttelton O, Boucher M, Robbins S, Evans A. An unbiased iterative group registration template for cortical surface analysis. Neuroimage 2007;34:1535-1544.
24. Chung MK, Worsley KJ, Robbins S, Paus T, Taylor J, Giedd JN, et al.
Deformation-based surface morphometry applied to gray matter de- formation. Neuroimage 2003;18:198-213.
25. Tzourio-Mazoyer N, Landeau B, Papathanassiou D, Crivello F, Etard O, Delcroix N, et al. Automated anatomical labeling of activations in SPM using a macroscopic anatomical parcellation of the MNI MRI single-subject brain. Neuroimage 2002;15:273-289.
26. Wenham PR, Price WH, Blandell G. Apolipoprotein E genotyping by one-stage PCR. Lancet 1991;337:1158-1159.
27. Guigoz Y. The Mini Nutritional Assessment (MNA) review of the lit- erature--What does it tell us? J Nutr Health Aging 2006;10:466-485.
28. Vellas B, Villars H, Abellan G, Soto ME, Rolland Y, Guigoz Y, et al.
Overview of the MNA--Its history and challenges. J Nutr Health Aging 2006;10:456-463.
29. Neelemaat F, Kruizenga HM, De Vet HC, Seidell JC, Butterman M, Van Bokhorst-de van der Schueren MA. Screening malnutrition in hospital outpatients. Can the SNAQ malnutrition screening tool also be applied to this population? Clin Nutr 2008;27:439-446.
30. Fox J, Monette G. Generalized collinearity diagnostics. J Am Stat Assoc 1992;87:178-183.
31. Benjamini Y, Hochberg Y. Controlling the false discovery rate: a prac- tical and powerful approach to multiple testing. J R Stat Soc Series B Stat Methodol 1995;57:289-300.
32. Droogsma E, Van Asselt DZ, Schölzel-Dorenbos CJ, Van Steijn JH, Van Walderveen PE, Van der Hooft CS. Nutritional status of commu- nity-dwelling elderly with newly diagnosed Alzheimer’s disease: prev- alence of malnutrition and the relation of various factors to nutrition- al status. J Nutr Health Aging 2013;17:606-610.
33. Guerin O, Soto ME, Brocker P, Robert PH, Benoit M, Vellas B; REAL.
FR Group. Nutritional status assessment during Alzheimer’s disease:
results after one year (the REAL French Study Group). J Nutr Health Aging 2005;9:81-84.
34. Guérin O, Andrieu S, Schneider SM, Milano M, Boulahssass R, Brock- er P, et al. Different modes of weight loss in Alzheimer disease: a pro- spective study of 395 patients. Am J Clin Nutr 2005;82:435-441.
35. Vellas B, Lauque S, Gillette-Guyonnet S, Andrieu S, Cortes F, Nourhashé- mi F, et al. Impact of nutritional status on the evolution of Alzheimer’s disease and on response to acetylcholinesterase inhibitor treatment. J Nutr Health Aging 2005;9:75-80.
36. Spaccavento S, Del Prete M, Craca A, Fiore P. Influence of nutritional status on cognitive, functional and neuropsychiatric deficits in Al- zheimer’s disease. Arch Gerontol Geriatr 2009;48:356-360.
37. Nourhashemi F, Amouyal-Barkate K, Gillette-Guyonnet S, Cantet C, Vellas B; REAL.FR Group. Living alone with Alzheimer’s disease:
cross-sectional and longitudinal analysis in the REAL.FR Study. J Nutr Health Aging 2005;9:117-120.
38. Saragat B, Buffa R, Mereu E, Succa V, Cabras S, Mereu RM, et al. Nutri- tional and psycho-functional status in elderly patients with Alzheimer’s disease. J Nutr Health Aging 2012;16:231-236.
39. Gillioz AS, Villars H, Voisin T, Cortes F, Gillette-Guyonnet S, Andrieu S, et al. Spared and impaired abilities in community-dwelling patients entering the severe stage of Alzheimer’s disease. Dement Geriatr Cogn
Nutritional Status and Cognition
JCN
Disord 2009;28:427-432.
40. Porter Starr KN, McDonald SR, Bales CW. Nutritional vulnerability in older adults: a continuum of concerns. Curr Nutr Rep 2015;4:176-184.
41. Volkert D, Chourdakis M, Faxen-Irving G, Frühwald T, Landi F, Suominen MH, et al. ESPEN guidelines on nutrition in dementia. Clin Nutr 2015;34:1052-1073.
42. Agarwal E, Miller M, Yaxley A, Isenring E. Malnutrition in the elderly:
a narrative review. Maturitas 2013;76:296-302.
43. Morley JE, Silver AJ. Nutritional issues in nursing home care. Ann In- tern Med 1995;123:850-859.
44. Fitten LJ, Morley JE, Gross PL, Petry SD, Cole KD. Depression. J Am Geriatr Soc 1989;37:459-472.
45. Phillips RM. Nutrition and depression in the community-based old- est-old. Home Healthc Nurse 2012;30:462-471.
46. Steenland K, Karnes C, Seals R, Carnevale C, Hermida A, Levey A.
Late-life depression as a risk factor for mild cognitive impairment or Alzheimer’s disease in 30 US Alzheimer’s disease centers. J Alzheim- ers Dis 2012;31:265-275.
47. Byers AL, Yaffe K. Depression and risk of developing dementia. Nat
Rev Neurol 2011;7:323-331.
48. Hardman RJ, Kennedy G, Macpherson H, Scholey AB, Pipingas A.
Adherence to a mediterranean-style diet and effects on cognition in adults: a qualitative evaluation and systematic review of longitudinal and prospective trials. Front Nutr 2016;3:22.
49. Staubo SC, Aakre JA, Vemuri P, Syrjanen JA, Mielke MM, Geda YE, et al. Mediterranean diet, micronutrients and macronutrients, and MRI measures of cortical thickness. Alzheimers Dement 2017;13:168-177.
50. Mosconi L, Murray J, Tsui WH, Li Y, Davies M, Williams S, et al.
Mediterranean diet and magnetic resonance imaging-assessed brain atrophy in cognitively normal individuals at risk for Alzheimer’s dis- ease. J Prev Alzheimers Dis 2014;1:23-32.
51. Gu Y, Brickman AM, Stern Y, Habeck CG, Razlighi QR, Luchsinger JA, et al. Mediterranean diet and brain structure in a multiethnic el- derly cohort. Neurology 2015;85:1744-1751.
52. Jack CR Jr, Bennett DA, Blennow K, Carrillo MC, Feldman HH, Friso- ni GB, et al. A/T/N: an unbiased descriptive classification scheme for Alzheimer disease biomarkers. Neurology 2016;87:539-547.