1. INTRODUCTION
Since the inertial navigation system (INS) has the advantage of calculating the attitude, velocity and position of the moving object even in the environment without the positioning infrastructure despite the large disadvantage of accumulating errors over time, it has become a basic navigation system for the airplane, submarine, and autonomous vehicle (Farrell & Barth 1999). When a person with a low-cost inertial measurement unit (IMU) is a moving object, however, it is obvious that the conventional inertial navigation algorithm alone cannot perform the accurate navigation. To solve this problem, research on pedestrian
Gyro Signal Processing-based Stance Phase Detection Method in Foot Mounted PDR
Seong Yun Cho
1†, Chan Gook Park
21
Department of Robotics Engineering, Kyungil University, Gyeongsan 38428, Korea
2
Department of Mechanical and Aerospace Engineering, Seoul National University, Seoul 08826, Korea
ABSTRACT
A number of techniques have been studied to estimate the position of pedestrians in indoor space. Among them, the technique of estimating the position using only the sensors attached to the body of the pedestrian without using the infrastructure is regarded as a very important technology for special purpose pedestrians such as the firefighters. In particular, it forms a research field under the name of Pedestrian Dead Reckoning (PDR). In this paper, we focus on a method for step detection which is essential when performing PDR using Inertial Measurement Unit (IMU) mounted on a shoe. Many researches have been done to detect the stance phase where the foot contacts the ground. Most of these methods, however, have a way to detect the specific size of the sensor signal and require thresholds for these methods. This has the difficulty of changing these thresholds if the user is different. To solve this problem, we propose a stance phase detection method that does not require any threshold value. It is expected that this result will make it easier to commercialize the technology because PDR can be implemented without user-dependent parameter setting.
Keywords: PDR, stance phase detection, gyro signal processing, threshold
dead reckoning (PDR) has been conducted for the past two decades. The PDR is based on detecting steps of a pedestrian and estimates strides based on it. Then it combines this information with walking direction to calculate the position of the pedestrian. By using the PDR algorithm instead of the conventional INS algorithm, therefore, it is possible to calculate the position of the pedestrian with small error accumulation over time (Foxlin 2005, Cho & Park 2006, Godha & Lachapelle 2008, Jimenez et al. 2010, Park & Suh 2010, Alvarez et al. 2012, Kang & Han 2015, Tian et al. 2016, Ju
& Park 2018).
Research on the PDR using a low-cost IMU has started with mounting an IMU on a shoe (Foxlin 2005, Cho & Park 2006, Godha & Lachapelle 2008, Ju & Park 2018). This is because the part of the human body that is most easily able to detect the step is the foot. Since then, many researches have been done on the detection of steps and stride estimation according to the location of a smartphone for PDR using a smartphone. In the case of holding the smartphone in the hand, in the pocket, on the waist, in the backpack, Received Feb 18, 2019 Revised Mar 29, 2019 Accepted Apr 04, 2019
†
Corresponding Author E-mail: [email protected]
Tel: +82-53-600-5584 Fax: +82-53-600-5599
Seong Yun Cho https://orcid.org/0000-0002-4284-2156
Chan Gook Park https://orcid.org/0000-0002-7403-951X
50 JPNT 8(2), 49-58 (2019)
etc., techniques of recognizing the mounting position and methods of detecting the steps were investigated in each case (Alvarez et al. 2012, Kang & Han 2015, Tian et al. 2016).
Here, the accelerometer is mainly used for detecting the step.
On the other hand, gyro is sometimes used because it can be difficult to detect a step based on accelerometer at a slow pace (Jayalath et al. 2013). However, it has not been easy to move from a variety of studies to commercialization. In the meantime, the performance of the micro-electro mechanical system (MEMS)-type inertial sensors constituting the low- cost IMU has been improved. Then the IMU’s attachment site came back to the shoes. Recently, it has been widely used to drive the PDR with the following algorithm. Based on the INS algorithm, first, the IMU output is used to calculate the attitude, velocity, and position of the foot where the IMU is attached. And detects when the foot contacts the ground.
Since the foot velocity is zero at that moment, the zero- velocity update (ZUPT) filter is driven to correct the INS errors. By using the general INS algorithm and the ZUPT filter, it is possible to calculate the position information of the pedestrian with small error accumulation (Jimenez et al.
2010, Park & Suh 2010, Ju & Park 2018). Therefore, detecting the stance phase (SP) when the foot contacts the ground became an important research theme.
Techniques for detecting the steps include peak detection, zero crossing, and flat zone detection. Among these, detecting the SP corresponds to the flat zone detection technique (Cho & Park 2006, Ju & Park 2018). Many researches related to this have been carried out using mainly accelerometer signals. A typical method is to use a bandpass filter. First, the accelerometer output is passed through a high-pass filter: the gravitational acceleration and bias components are removed through the time difference of the accelerometer output. Next, a low-pass filter is derived: the signal corresponding to the high-frequency signal is removed through the moving average of the previously processed signal, and the signal is simplified. Through signal analysis, it can be seen that the signal passed through the low-pass filter has a value close to zero during SP, and this part is detected (Cho & Park 2006). To detect near zero signals over a period of time, a specific threshold is used generally. Two problems arise here. First, there may be a section where the signal is close to zero even while the foot is moving. Second, since the walking characteristics are different for each person, the threshold value in the algorithm should be set differently for each person. So, multiple thresholds must be used in one algorithm, and different thresholds must be set for each person.
In this paper, we propose a SP detection method that does not use a threshold to solve this problem. In this method, gyro
signals are used instead of accelerometer signals, and only a low-pass filter using sliding window meaning (SWM) is used instead of the bandpass filter. The positive/negative peaks of the signal simplified by the SWM are detected, and the SP is detected based on it. No threshold is used in this process.
This makes it possible for multiple users to use an algorithm without changing parameters. This algorithm is explained in Section 2 of this paper, and the performance of the algorithm is experimentally verified in Section 3.
2. A STANCE PHASE DETECTION TECHNIQUE
The IMU, mounted on the shoe, provides gait characteristic signals along the walk through the accelerometer and gyro output. It is important to convert these signals to appropriate signals for SP detection through specific processing. In general, many techniques for detecting SP using the accelerometer signals have been investigated. However, most of these techniques require specific threshold settings. In this Section, signal processing for SP detection is performed using the accelerometer and gyro signals, respectively, and finally the most suitable signal processing technique or SP detection is proposed.
2.1 Accelerometer Signal Processing-based Approach
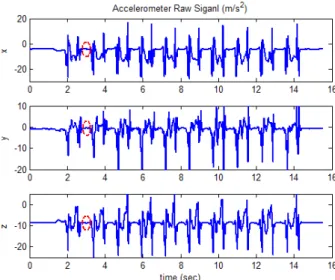
Fig. 1 shows the output of a 3-axis accelerometer when an IMU with an output frequency of 100 Hz is mounted on the right shoe and a pedestrian walks 10 steps at normal speed.
In this figure, the following two facts can be seen: First, the
accelerometer output contains the gravitational acceleration
Fig. 1. 3-axis accelerometer raw signals and first stance phase part.
component. Since the IMU is mounted so that the x-axis of the accelerometer is in the forward direction, the y-axis is in the right direction, and the z-axis is in the downward direction of the shoe, it can be seen that the gravitational acceleration is largely reflected on the z-axis output and is larger than the other two axis outputs. The reason why the x- and y-axis accelerometer outputs are not zero during the first 1 second of the Fig. 1 when the foot is stop state is that the attitude of the IMU on the foot is not leveled. Second, a walking pattern appears at each step, and a flat signal appears during the SP. In the figure, the circle represents the first SP. Considering these characteristics, signal processing is performed as shown in Fig. 2 to find the SP.
The first figure in Fig. 2 shows the result of processing the 3-axis accelerometer signals using the following equation.
, T 0
T k k k
f = f f − f (1)
where f
k= [ a
x k,a
y k,a
z k,]
Tis the 3-axis accelerometer output vector at time k and
01
1
N Ti i
i
f f f
N
== ∑
0 1
1 N T
i i
i
f N = f f
=
∑
0 1
1
N Ti i
i
f f f
N
== ∑ is the value calculated for a certain time (for example, 1 second) in the stop state before the start of navigation to remove the gravitational acceleration component.
f
SWMin the Fig. 2 shows the SWM of f
T. Here, the window size (WS) for SWM is set to 30, 50, and 100, respectively.
The SWM is used to pass a signal through a low-pass filter to remove the high-frequency component of the signal and to simplify the signal. In this figure, we can see that the WS becomes larger, the signal gets simpler, but the portion corresponding to the SP section becomes smaller. These characteristics vary according to walking-type and speed.
In this paper, after various attempts, we set WS to 50, which is half of IMU frequency. The once determined WS is used
fixedly with no change according to the walking speed, walking type, and pedestrian. Therefore, the WS determined by the experimental method is different from the threshold for avoiding use in this paper. Compared with f
T, f
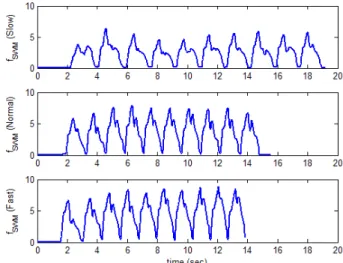
SWMhas a good shape to detect SP. That is, it is only necessary to detect the negative peaks. However, this signal has a different shape depending on the walking speed and the experimenter as shown in Figs. 3 and 4. Fig. 3 shows SWM signals with different walking speed of the same experimenter, and Fig.
4 shows SWM signals according to the experimenter. Fig.
3 shows a relatively good signal form. However, it may be shown in Fig. 4 that signals that are difficult to detect the SP appear depending on the experimenter. Therefore, if the threshold value for detecting the interval corresponding to the SP is set to a small value, the SP may be missed. On the contrary, if the threshold value is set to a large value, multiple Fig. 2. f
Tand SWM values of accelerometer signal according to WS value
when walking at normal speed. Fig. 3. SWM values of accelerometer signal according to walking speed when WS is set to 50.
Fig. 4. SWM values of accelerometer signal according to the experimenter
when WS is set to 50.
52 JPNT 8(2), 49-58 (2019)
SPs can be detected during one step. Although the method of adaptively setting the threshold value according to the walking speed may be considered, there arises a problem that different threshold values must be set depending on the pedestrians.
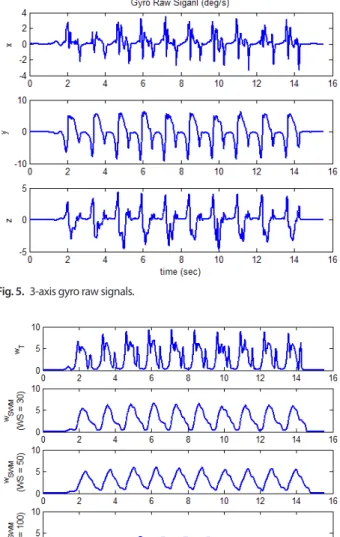
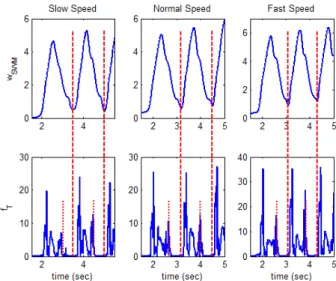
2.2 Gyro Signal Processing-based Approach
Figs. 5-8 show the gyro output and gyro signal processing results matched to Figs. 1-4. w
Tis calculated as follows.
, T 0
T k k k
w = w w − w (2)
where w
k= [ g
x k,g
y k,g
z k,]
Tis the 3-axis gyro output vector at time k and
01
1
N Ti i
i
w w w
N
== ∑
0 1
1 N T
i i
i
w w w
N =
=
∑
0 1