© 2018 The Korean Ophthalmological Society
This is an Open Access article distributed under the terms of the Creative Commons Attribution Non-Commercial License (http://creativecommons.org/licenses /by-nc/3.0/) which permits unrestricted non-commercial use, distribution, and reproduction in any medium, provided the original work is properly cited.
Original Article
Prognostic Factors for Functional and Anatomic Outcomes in Patients with Diabetic Macular Edema Treated with Dexamethasone Implant
Hyungwoo Lee, Kyung Eun Kang, Hyewon Chung, Hyung Chan Kim
Department of Ophthalmology, Konkuk University Medical Center, Konkuk University School of Medicine, Seoul, Korea
Purpose: To investigate the prognostic factors of visual and anatomic outcomes in patients with diabetic mac- ular edema (DME) treated with intravitreal injection of dexamethasone implant.
Methods: We retrospectively studied 32 eyes of 31 patients with DME for best-corrected visual acuity (BCVA), central macular thickness, and height and width of both intraretinal fluid (IRF) and subretinal fluid. Logistic regression analysis was used to examine correlations between the baseline characteristics and outcomes at 3 and 6 months.
Results: Baseline predictor of BCVA ≥20 / 40 at month 3 was short height of baseline IRF (p = 0.02), while good baseline BCVA was a predictor for month 6 (p = 0.01). Predictors of improvement in logarithm of mini- mum angle of resolution BCVA 0.2 at month 3 were the absence of baseline IRF and poor baseline BCVA (p
= 0.02 and p = 0.009, respectively), while poor baseline BCVA was the sole predictor at month 6 (p = 0.01).
Predictor of central macular thickness ≤300 μm at month 3 was younger age (p = 0.03), while the absence of IRF was the predictor for BCVA improvement at month 6 (p = 0.02). BCVA ≤20 / 100 at month 3 was predict- ed by poor baseline BCVA (p = 0.01), and increased width of total IRF was the predictor at month 6 (p = 0.02).
Predictor of loss of logarithm of minimum angle of resolution BCVA 0.2 at month 6 was increased width of total IRF at baseline (p = 0.04). Additional injection within 6 months was negatively associated with the pres- ence of baseline DME (p = 0.03).
Conclusions: The visual and anatomical outcome of DME treatment with dexamethasone implant can be pre- dicted by baseline visual acuity and IRF morphology.
Key Words: Diabetic retinopathy, Macular edema, Prognosis, Spectral-domain optical coherence tomography
Diabetic macular edema (DME) is the most common cause of vision loss in patients with diabetic retinopathy [1].
DME is thought to occur due to fluid collection induced by breakdown of the blood retinal barrier [2]. Intravitreal dexamethasone implant injection has become a popular treatment as it quells the activity of multiple inflammatory mediators [3]. Treatment outcomes are favorable even for patients refractory to anti-vascular endothelial growth fac- tor (VEGF) treatment [4]. However, intravitreal dexameth- asone implant injection does not work for all DME patients
Received: March 28, 2017 Accepted: July 12, 2017
Corresponding Author: Hyung Chan Kim, MD, PhD. Department of Ophthalmology, Konkuk University Medical Center, #120-1 Neung- dong-ro, Gwangjin-gu, Seoul 05030, Korea. Tel: 82-2-2030-8181, Fax: 82- 2-2030-5273, E-mail: [email protected]
based on our clinical experience. Due to the lack of knowledge regarding the prognostic factors after dexa- methasone implant treatment, the reason for this failure is unclear [5]. This study sought to determine reasons for the varied outcomes in patients with DME treated with dexamethasone implant. The baseline prognostic factors for visual and anatomical outcomes of DME patients after intravitreal injection of dexamethasone implant were in- vestigated based on detailed measurement of microstruc- tures. In addition, the factors associated with retreatment within 6 months after the first injection were examined.
Materials and Methods
Patients
The medical records of patients examined between April 2014 and August 2016 were retrospectively reviewed. This study followed the tenets of the Declaration of Helsinki and was approved by the institutional review board (KUH1100042).
The inclusion criteria were type 1 or type 2 diabetes mellitus, DME treated with one or more intravitreal dexamethasone implants and followed up for at least 6 months, and central macular thickness (CMT) >300 μm based on spectral-domain (SD) optical coherence tomography (OCT). The exclusion cri- teria were prior vitrectomy, panretinal laser photocoagulation within 3 months, prior laser-treatment of the macula, and ocular diseases other than diabetic retinopathy and cata-
ract. Each patient was followed monthly and received a complete ophthalmic examination including medical and ocular history, treatment history of DME, determination of glycosylated hemoglobin level, and ophthalmologic ex- amination that included best-corrected visual acuity (BCVA), fundus photography, and SD-OCT. Data obtained at baseline and 3 and 6 months were included in this study.
Dexamethasone implant containing 0.7 mg dexamethasone (Ozurdex; Allergan, Irvine, CA, USA) was injected intrav- itreally. Retreatment was performed based on the anatom- ic criteria such as CRT >175 mm on OCT or evidence of residual edema on OCT, considered intraretinal cysts or regions of retinal thickening.
Assessment of retinal microstructures observed using SD-OCT
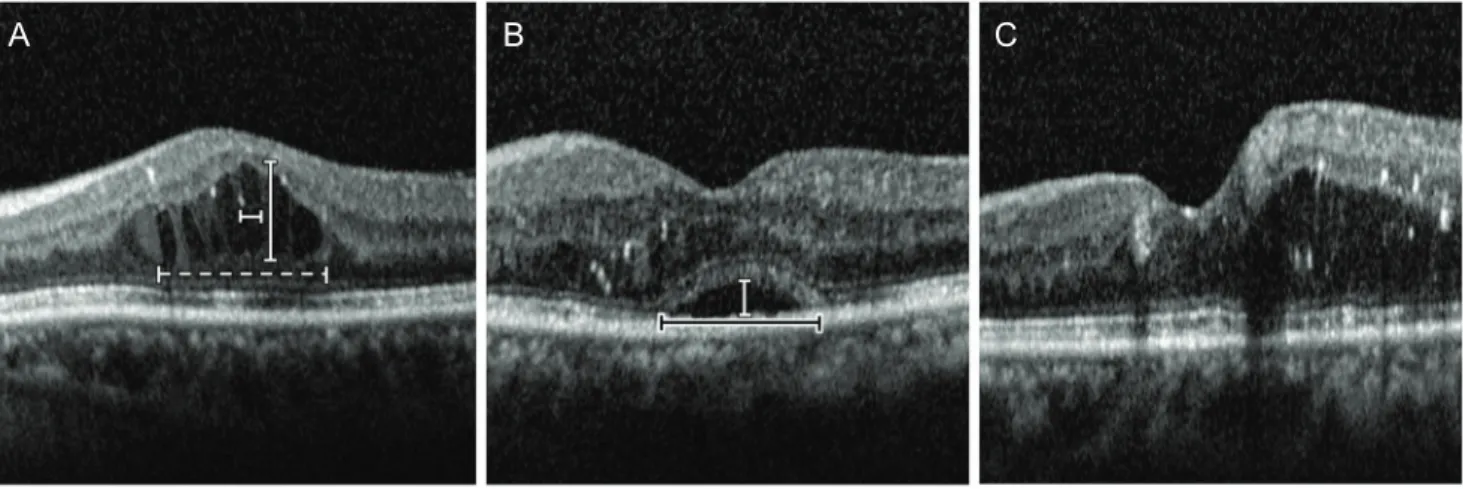
A 9-mm × 6-mm area of the macular region was exam- ined using SD-OCT with a Spectralis HRA+OCT (Heidel- berg Engineering, Heidelberg, Germany). Volume scans of 25 sections were centered on the fovea, and nine B-scan images of each section were averaged. Using a virtual cali- per in the software (Heidelberg Eye Explorer ver. 6.0), the height and width of both subretinal fluid (SRF) and intra- retinal fluid (IRF) were measured (Fig. 1A, 1B). When multiple IRFs were present, the nearest IRF from the cen- ter was selected. In addition, IRF over 100 μm in width observed only in the outer nuclear layer were considered in quantification because the IRF in the inner retinal layer
A B C
Fig. 1. Patterns of diabetic macular edema observed on optical coherence tomography. (A) Cystoid macular edema type shows prominent intraretinal fluid (IRF) in the outer nuclear layer. The height and width of IRF were measured (vertical and horizontal white bars). Total width of IRF was measured as the maximal width of IRF clusters within a 3,000-μm area (white dashed bar). (B). Serous retinal detach- ment type shows subretinal hyporeflective space. The height and width of fluid were measured (vertical white bar and horizontal black bar). (C) Diffuse retinal thickening type shows a sponge-like swelling with reduced intraretinal reflectivity.
were usually too small and/or had vague boundaries that limited assessment of their height and width. Total IRF width was measured as the maximal width of IRF clusters within a 3,000-μm circle centered at the fovea. Macular edema was separated into three groups based on SD-OCT:
diffuse retinal thickening (DRT), cystoid macular edema (CME), and serous retinal detachment (SRD) [6-10]. The CME pattern was characterized by intraretinal cystoid spaces (Fig. 1A). The SRD pattern was defined as a de- tachment of the retina with a hyporeflective space between the neurosensory retina and retinal pigment epithelium (Fig. 1B). The DRT pattern was characterized by sponge- like swelling of the macula (Fig. 1C). If DRT was com- bined with CME or SRD, it was classified as either CME or SRD. If all patterns were combined, the classification was SRD. CMT was automatically calculated using built- in software as the average retinal thickness within a 500- µm radius circle centered on the fovea, based on the vol- ume scan data containing the target circle area. Two graders (HL and KEK) blinded to the data assessed the types of DME and height and width of fluids.
Statistical analyses
The Snellen BCVA was converted to a logarithm of the minimal angle of resolution (logMAR) equivalent. To validate the agreement between the two graders, intra-class coefficient (ICC) was calculated. Repeated measures ANOVA was used to compare logMAR BCVAs at baseline, month 3, and month 6. When sphericity violations were detected using Mauchly’s test in repeated measures ANOVA, the Greenhouse-Geisser correction was applied to the degrees of freedom used in the F-test because ε was <0.75 in all cases. Mann-Whitney test was conducted to compare the parameters of CME type and SRD type. The parameters of DRT type could not be used in statistical comparison because only one eye was analyzed.
Logistic regression analyses were performed to assess the rel- evant baseline factors associated with logMAR BCVA, CMT at 3 and 6 months, and reinjection before 6 months. Baseline factors analyzed were age, duration of diabetes, history of hy- pertension, duration of DME, glycosylated hemoglobin level, number of previous bevacizumab injections, history of previ- ous cataract surgery, logMAR BCVA, CMT, presence or ab- sence of each DME type, and height and total width of both IRF and SRF. Changes of 0.1 and 50 μm logMAR BCVA in microstructures were considered as standard units of changes
in regression analyses. Individual factors were subjected to univariate logistic regression analysis and were subsequently entered in the multivariate linear regression analysis in a for- ward conditional manner if p < 0.05 was determined. All sta- tistical analyses were performed using PASW Statistics ver.
18.0 (SPSS Inc., Chicago, IL, USA). A p-value <0.05 was con- sidered statistically significant for all analyses.
Results
Baseline characteristics
A total of 32 eyes of 31 patients (21 males, 10 females;
mean age, 58.3 ± 10.7 years) were included in the present study. Seven eyes were treatment-naïve, and the other 25 eyes had received 2.5 ± 1.8 intravitreal bevacizumab injec- tions before injection of the dexamethasone implant. The mean interval between bevacizumab treatment and dexa-
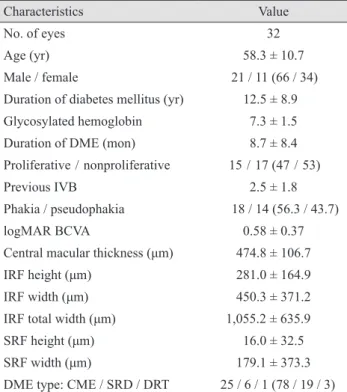
Table 1. Baseline characteristics
Characteristics Value
No. of eyes 32
Age (yr) 58.3 ± 10.7
Male / female 21 / 11 (66 / 34)
Duration of diabetes mellitus (yr) 12.5 ± 8.9
Glycosylated hemoglobin 7.3 ± 1.5
Duration of DME (mon) 8.7 ± 8.4
Proliferative / nonproliferative 15 / 17 (47 / 53)
Previous IVB 2.5 ± 1.8
Phakia / pseudophakia 18 / 14 (56.3 / 43.7)
logMAR BCVA 0.58 ± 0.37
Central macular thickness (μm) 474.8 ± 106.7
IRF height (μm) 281.0 ± 164.9
IRF width (μm) 450.3 ± 371.2
IRF total width (μm) 1,055.2 ± 635.9
SRF height (μm) 16.0 ± 32.5
SRF width (μm) 179.1 ± 373.3
DME type: CME / SRD / DRT 25 / 6 / 1 (78 / 19 / 3) Values are presented as number, mean ± standard deviation, or number (%).
DME = diabetic macular edema; IVB = intravitreal bevacizumab injection; logMAR = logarithm of the minimal angle of resolu- tion; BCVA = best-corrected visual acuity; IRF = intraretinal flu- id; SRF = subretinal fluid; CME = cystoid macular edema; SRD
= serous retinal detachment; DRT = diffuse retinal thickening.
Table 2. Characteristics according to diabetic macular edema type CharacteristicsBaselineAfter 6 months TotalCMESRDDRTp-value* TotalCMESRDDRTp-value* No. of eyes322561-322561- Previous IVB2.5 ± 1.82.5 ± 1.92.3 ± 1.53.00.98----- logMAR BCVA0.58 ± 0.370.58 ± 0.350.55 ± 0.481.00.640.41 ± 0.360.46 ± 0.390.24 ± 0.150.160.17 CMT (μm)474.8 ± 106.7474.3 ± 110.2494.3 ± 97.8368.00.68383.8 ± 116.4385.4 ± 112.0386.2 ± 152.03300.72 IRF height (μm)281.0 ± 164.9315.4 ± 139.4184.3 ± 206.100.23158.7 ± 146.6167.8 ± 150.4122.5 ± 150.71500.64 IRF width (μm)450.3 ± 371.2532.6 ± 368.0182.8 ± 210.300.01295.3 ± 271.3334.4 ± 282.7129.8 ± 179.13100.11 IRF total width1,055.2 ± 635.91,171.6 ± 542.2746.3 ± 831.300.45630.0 ± 648.8595.4 ± 584.3793.7 ± 964.25100.94 SRF height (μm)16.0 ± 32.5085.2 ± 25.40<0.0119.4 ± 63.817.7 ± 68.529.8 ± 50.100.45 SRF width (μm)179.1 ± 373.30955.5 ± 358.30<0.01110.9 ± 368.7111.4 ± 408.6127.3 ± 197.300.48 All values except the number of eyes are depicted as mean ± standard deviation. CME = cystoid macular edema; SRD = serous retinal detachment; DRT = diffuse retinal thickening, IVB = intravitreal bevacizumab injection; logMAR = logarithm of the mini- mal angle of resolution; BCVA = best-corrected visual acuity; CMT = central macular thickness; IRF = intraretinal fluid; SRF = subretinal fluid. * Mann-Whitney test for the comparison of CME parameters with SRD type. DRT type could not be included in statistical analysis because only 1 eye was included.
methasone implantation was 5.9 ± 6.6 months. Among the 25 eyes with previous bevacizumab injections, 19 were treat- ed with dexamethasone implants within 6 months after the previous bevacizumab injections, and 10 eyes were treated within 3 months. Eighteen eyes were phakic and 14 eyes were pseudophakic. Among the phakic patients, no patient received cataract surgery during the 6 months because the cataracts did not progress significantly. Other detailed base- line characteristics are depicted in Table 1. The determina- tion of DME types did not differ between the two graders.
In addition, there was significant agreement in quantifying the fluid characteristics (ICC for IRF height, 0.92; ICC for IRF width, 0.93; ICC for IRF total width, 0.89; ICC for SRF height, 0.95; ICC for SRF width, 0.95; all p < 0.05).
When comparing the number of previous bevacizumab injections and CMT of CME type with SRD type, no sig- nificant differences were found (Table 2). The parameters of DRT type could not be compared with other types be- cause only one eye was included in DRT type.
Change of BCVA and CMT
The mean baseline logMAR BCVA and CMT were 0.58
± 0.37 and 474.8 ± 106.7 μm, respectively. The mean log-
MAR BCVA significantly improved at month 3 and month 6 compared to baseline (0.38 ± 0.34, p = 0.02 and 0.41 ± 0.36, p = 0.02, respectively). BCVA was not significantly different between months 3 and 6 (p = 0.35). Mean CMT at months 3 and 6 was significantly lower than the CMT at baseline (341.4 ± 97.0 μm, p < 0.001 and 388.1 ± 117.0 μm, p
= 0.017, respectively). CMT was not statistically significant- ly different between months 3 and 6 (p = 0.153).
Predictors of good visual outcome
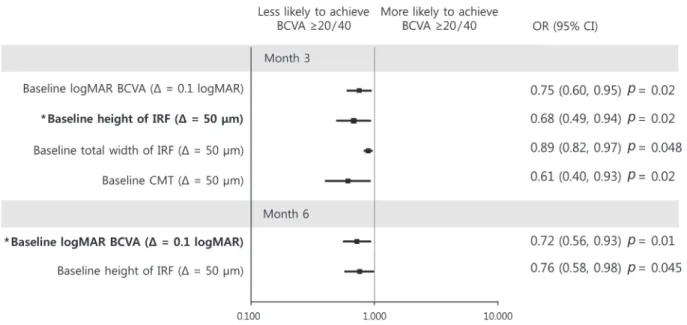
BCVA of 20 / 40 or better at month 3 was associated with good baseline logMAR BCVA (odds ratio [OR], 0.75; p = 0.02), short IRF height (OR, 0.68; p = 0.02), lower total IRF width (OR, 0.89; p = 0.048), and CMT at baseline (OR, 0.61; p = 0.02) in univariate analysis. Multivariate analysis showed that baseline IRF height was negatively associated with a good final BCVA at month 3 (OR, 0.68; p = 0.02) (Fig. 2). Conversely, at month 6, BCVA of 20 / 40 or better was associated with good baseline BCVA (OR, 0.72; p = 0.01) and short IRF height at baseline (OR, 0.76; p = 0.045) in univariate analysis. Multivariate analysis showed that good baseline BCVA was the only prognostic fac- tor of good BCVA at month 6 (OR, 0.73; p = 0.01) (Fig. 2).
Fig. 2. Graphs showing baseline predictors associated with a best-corrected visual acuity (BCVA) ≥20 / 40 at month 3 (upper) and month 6 (lower). With increment of intraretinal fluid (IRF) height at baseline, a patient was less likely to achieve BCVA ≥20 / 40 at month 3.
With increment of logarithm of the minimal angle of resolution (logMAR) BCVA at baseline, a patient was less likely to achieve a BCVA
≥20 / 40 at month 6. Error bar represents logarithmic transformations of 95% confidence intervals (CIs). OR = odds ratio; Δ = change;
CMT = central macular thickness. *Baseline factors in multivariate logistic regression model.
Predictors of improved visual acuity
Improvement of logMAR BCVA ≥0.2 at month 3 correlat- ed with poor baseline logMAR BCVA and absence of IRF at baseline in both univariate and multivariate analyses (OR, 1.42; p = 0.007 and OR, 0.13; p = 0.03, respectively, in univari- ate analysis. OR, 1.60; p = 0.009 and OR, 0.04; p = 0.02, re- spectively, in multivariate analysis) (Fig. 3). At month 6, im- provement of BCVA was only associated with poor baseline BCVA (OR, 1.37; p = 0.01) in univariate analysis (Fig. 3).
Predictors of resolution of macular edema
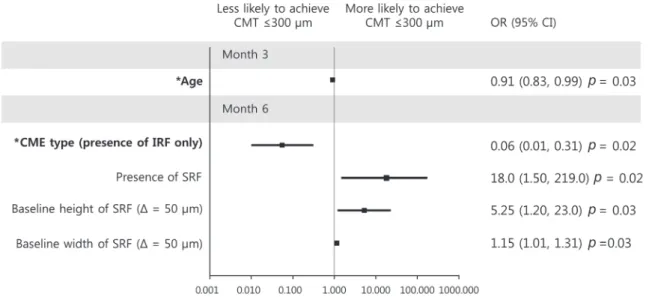
CMT ≤300 μm at month 3 was predicted only by young- er age (OR, 0.91; p = 0.03) (Fig. 4). At month 6, CMT ≤300 μm was predicted by absence of CME (OR, 0.06; p = 0.02), presence of SRD type (OR, 18.0; p = 0.02), greater SRF height (OR, 5.25; p = 0.03) and greater SRF width (OR, 1.15;
p = 0.03) at baseline in univariate analysis. The absence of IRF at baseline was the only factor persisting in multivari- ate analysis (OR, 0.06; p = 0.02) (Fig. 4).
Fig. 3. Graphs showing baseline predictors associated with an improvement of logarithm of minimum angle of resolution (logMAR) best-corrected visual acuity (BCVA) 0.2 at month 3 (upper) and month 6 (lower). At month 3, a patient with increased logMAR BCVA at baseline was more likely to gain vision, while the presence of intraretinal fluid (IRF) only at baseline was less likely to result in increased vision. For increment of logMAR BCVA at baseline, a patient was more likely to gain vision at month 6. Error bar represents logarithmic transformation of 95% confidence interval (CI). OR = odds ratio; Δ = change; CME = cystoid macular edema. *Baseline factors in multi- variate logistic regression model.
Fig. 4. Graphs showing baseline predictor variables associated with central macular thickness (CMT) ≤300 μm at 3 and 6 months. With increment of age, a patient was less likely to achieve CMT reduction at month 3. With the presence of intraretinal fluid (IRF) only at baseline, a patient was less likely to achieve CMT reduction at month 6. Error bar represents logarithmic transformation of 95% confi- dence interval (CI). OR = odds ratio; SRF = subretinal fluid; Δ = change. *Baseline factors in multivariate logistic regression model.
Predictors of poor visual outcome
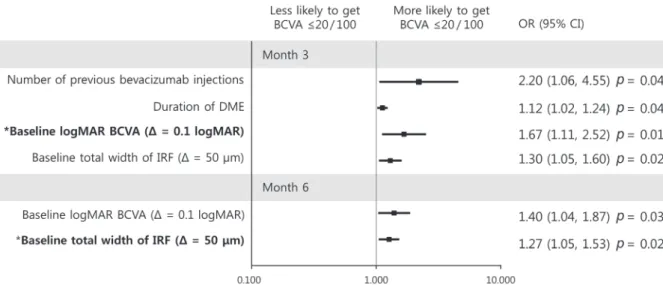
At month 3, BCVA of 20 / 100 or worse was more likely in patients who received more anti-VEGF injections and long duration of DME before dexamethasone implant in- jection (OR, 2.20; p = 0.04 and OR, 1.12; p = 0.04, respec- tively), poor baseline BCVA (OR, 1.67; p = 0.01), and in- creased total IRF width (OR, 1.30; p = 0.02). In multivariate analysis, only poor baseline BCVA persisted (OR, 1.67; p = 0.01) (Fig. 5). At month 6, univariate analysis showed that
poor BCVA was associated with poor baseline BCVA (OR, 1.40; p = 0.03) and increased total IRF width (OR, 1.27; p = 0.02). In multivariate analysis, only increased total IRF width at baseline correlated with poor visual outcome (OR, 1.27; p = 0.02) (Fig. 5).
Predictors of loss of visual acuity
At month 3, statistical analysis could not be performed because only one patient experienced vision loss of log-
Fig. 5. Graphs showing baseline predictors associated with a best-corrected visual acuity (BCVA) ≤20 / 100 at month 3 (upper) and month 6 (lower). With increment of logarithm of the minimal angle of resolution (logMAR) BCVA at baseline, a patient was more likely to achieve a BCVA ≤20 / 100 at month 3. With increment of total width of intraretinal fluid (IRF) at baseline, a patient was more likely to achieve BCVA ≤20 / 100 at month 6. Error bar represents logarithmic transformation of 95% confidence interval (CI). OR = odds ratio;
DME = diabetic macular edema; Δ = change. *Baseline factors in multivariate logistic regression model.
Fig. 6. Graphs showing baseline predictors associated with a loss of logarithm of minimum angle of resolution best-corrected visual acuity 0.2 at month 3 (upper) and month 6 (lower). At month 3, statistical analysis could not be performed because only one patient expe- rienced vision loss of logarithm of minimum angle of resolution ≥0.2. With increment of total width of intraretinal fluid (IRF) at baseline, a patient was more likely to lose vision at month 6. Error bar represents logarithmic transformation of 95% confidence interval (CI). OR
= odds ratio; Δ = change. *Baseline factors in multivariate logistic regression model.
MAR ≥0.2. Regarding loss of BCVA at month 6, only in- creased total IRF width at baseline was significantly asso- ciated in univariate regression analysis (OR, 1.20; p = 0.04) (Fig. 6).
Predictors of reinjection within 6 months
Eleven eyes (6 CME, 4 SRD, and 1 DRT) required an ad- ditional injection of dexamethasone implant within 6 months. Baseline CME type was associated with reduced reinjection within 6 months (OR, 0.13; p = 0.03). Other baseline factors showed no association with reinjection.
Area under the curve and cut-off values of predictors Area under the curve and cut-off values of prognostic factors from each multivariate logistic regression model were calculated and are presented in Table 3. All factors showed statistically significant area under the curve values for outcome prediction.
Discussion
Studies on DME using anti-VEGF treatment have shown that microstructural changes at baseline might predict the
response to treatment. However, there is little information regarding the prognostic factors after treatment with dexa- methasone implant [5].
In this study, baseline IRF showed temporary negative effect on visual and anatomical outcomes. Tall IRF at base- line was associated with good BCVA at months 3 and 6 in univariate analysis; however, the IRF did not persist in the multivariate analysis at month 6. Similarly, the negative ef- fect of IRF on BCVA improvement was no longer present after 3 months. Because bipolar cells convey the signal from the photoreceptors, their excessive stretching by IRF could induce mechanical damage of bipolar cells, leading to visual impairment [11]. Because the pathogenesis of IRF formation is related with various inflammatory cytokines as well as VEGF, sole treatment with anti-VEGF might be less effective in CME type [12]. Conversely, the ability of dexamethasone to suppress various inflammatory signals appears to resolve the negative effect of IRF in a short pe- riod of time. However, for patients with poor BCVA and those with significant loss of BCVA, the negative effect of IRF was evident until 6 months, unlike in patients with good visual prognosis. Interestingly, the associated proper- ty of IRF was not height, as shown in good visual progno- sis mentioned above, but the increased total width of IRF
≥1,700 μm. Although the reasons why the width was asso- ciated with visual loss and the negative effect was longer Table 3. AUC and cut-off values of predictors in multivariate regression model
Outcome Month Baseline predictor AUC Cut-off
BCVA ≥20 / 40 3 IRF height (μm) 0.79 ≤430
6 logMAR BCVA (Snellen) 0.79 ≤0.40 (≥20 / 50) Improvement of logMAR BCVA 0.2 or better 3 logMAR BCVA (Snellen) 0.80 ≥0.70 (≤20 / 100)
CME type 0.68 CME type: no
6 logMAR BCVA (Snellen) 0.78 ≥0.40 (≤20 / 50)
BCVA ≤20 / 100 3 logMAR BCVA (Snellen) 0.90 ≥0.52 (≤20 / 70)
6 IRF total width (μm) 0.91 ≥1,700
Deterioration of logMAR BCVA 0.2 or worse 3 Not available
6 IRF total width (μm) 0.85 ≥1,910
Central macular thickness ≤300 μm 3 Age (yr) 0.72 ≤52
6 CME type 0.73 CME type: no
Reinjection before month 6 - CME type 0.69 CME type: no
AUC = area under the curve; BCVA = best-corrected visual acuity; IRF = intraretinal fluid; logMAR = logarithm of the minimal angle of resolution; CME = cystoid macular edema.
than height are unclear, the horizontal stretch appears more harmful to the retina, including bipolar cells, than the ver- tical stretch. Another interesting finding was the possible different roles of IRF and SRF in different treatment regi- mens. For ranibizumab treatment, SRD type showed worse visual prognosis than CME or DRT types [8]. Conversely, a recent report regarding dexamethasone implant document- ed that the SRD and diffuse DME types showed significant visual improvement and CMT reduction [5]. Although di- rect comparison between previous studies and ours is diffi- cult, the quantified properties of IRF morphology might be useful to predict the visual outcome after treatment with dexamethasone implant.
Other pretreatment factors were also associated with vi- sual prognosis. Good baseline BCVA was correlated with good visual outcome; however, the amount of improvement was higher in patients with poor baseline BCVA. This in- verse correlation of BCVA improvement with baseline BCVA represents a ceiling effect, as previously described [13]. In addition, the increased number of previous an- ti-VEGF injections and long duration of DME were associ- ated with poor BCVA of 20 / 100 or less at month 3. How- ever, these negative effects were not observed at month 6.
These results indicate that the dexamethasone implant could gradually compensate for the negative effects from the sustained pathological condition of diabetes mellitus by changing the inflammatory environment of DME.
Lens status (phakic or pseudophakic) was not associated with visual outcome in our study. No patient developed significant cataract requiring cataract surgery during treat- ment. However, the relatively short follow-up period in this study might be the reason for lack of cataract progression.
Conversely, SRF was associated only with the anatomi- cal outcome of reduced CMT, not with visual outcome. The SRD type with increased SRF height and width at baseline was correlated with CMT ≤300 μm at month 6. Previous studies with anti-VEGF treatment showed no difference in CMT reduction among DME types [8,14]. However, a re- cent study on dexamethasone implant showed similar re- sults to our study, with a positive correlation between the presence of SRF at baseline and CMT reduction [5]. The favorable anatomical outcome in SRD type with dexa- methasone implant treatment might be due to the specific trait of SRF pathogenesis. SRF is supposedly the exudation due to hyperpermeability or retinal pigment epithelium (RPE) dysfunction [15,16]. Conversely, steroids stabilize the
existing retinal vasculature and maintain tight junction in- tegrity at the blood retinal barrier by promoting tight junc- tion protein expression and protecting against oxidative stress-induced disruption of tight junction proteins in reti- nal pigment epithelium cells [3]. Therefore, dexamethasone implants might reduce CMT more effectively in the envi- ronment of SRF formation than IRF formation. Interest- ingly, younger age, especially under 52 years, was the sole factor associated with good anatomical outcome at month 3 but not at month 6. Although the reason is unclear, young age has showed favorable response in functional and ana- tomical outcomes after 1 year of ranibizumab treatment [16]. Based on temporary favorable effects until 3 months in our study, the dexamethasone implant treatment could compensate for the effect of old age on anatomical outcome as treatment continues.
Reinjection within 6 months was lower in the CME type (presence of only IRF) than other types. Because IRF neg- atively affected visual outcome, lower rate of reinjection in CME type initially appeared contradictory. Other types of DME (DRT and SRD types) are thought to have increased vascular hyperpermeability, while liquefaction necrosis of the Muller cells and adjacent neural cells due to persistent edema or ischemia leads to cystoid cavity formation [17-20].
The presence of SRF and diffuse DME was reported to in- crease the reinjection of dexamethasone implant [5]. There- fore, CME type could represent functional damage with relatively low recurrence of DME than other types. Due to the small number of eyes in each DME type, further stud- ies are needed to clarify the factors for early reinjection.
The limitations of this study were its retrospective na- ture and the relatively small size of the study cohorts. The short follow-up period was only 6 months. In addition, we could not find any effect of DRT type because only one patient was DRT type. Further long-term studies with more participants are needed. However, our study has the advantage of detailed quantification of pathomorphological structures and suggesting the cut-off values of predictors.
In conclusion, increased height and total width of base- line IRF were the major morphological factors for poor vi- sual outcome of DME after intravitreal dexamethasone implant injection. Additionally, the baseline CME type was associated with poor anatomical outcome and low re- injection rate. Therefore, more active treatment might be needed for patients with increased baseline IRF.
Conflict of Interest
No potential conflict of interest relevant to this article was reported.
References
1. Klein R, Klein BE, Moss SE, et al. The Wisconsin epide- miologic study of diabetic retinopathy. IV. Diabetic macu- lar edema. Ophthalmology 1984;91:1464-74.
2. Bhagat N, Grigorian RA, Tutela A, Zarbin MA. Diabetic macular edema: pathogenesis and treatment. Surv Ophthal- mol 2009;54:1-32.
3. Dugel PU, Bandello F, Loewenstein A. Dexamethasone in- travitreal implant in the treatment of diabetic macular ede- ma. Clin Ophthalmol 2015;9:1321-35.
4. Zhioua I, Semoun O, Lalloum F, Souied EH. Intravitreal dexamethasone implant in patients with ranibizumab per- sistent diabetic macular edema. Retina 2015;35:1429-35.
5. Moon BG, Lee JY, Yu HG, et al. Efficacy and safety of a dexa- methasone implant in patients with diabetic macular edema at tertiary centers in Korea. J Ophthalmol 2016;2016:9810270.
6. Otani T, Kishi S, Maruyama Y. Patterns of diabetic macu- lar edema with optical coherence tomography. Am J Oph- thalmol 1999;127:688-93.
7. Kim BY, Smith SD, Kaiser PK. Optical coherence tomo- graphic patterns of diabetic macular edema. Am J Ophthal- mol 2006;142:405-12.
8. Seo KH, Yu SY, Kim M, Kwak HW. Visual and morpho- logic outcomes of intravitreal ranibizumab for diabetic macular edema based on optical coherence tomography patterns. Retina 2016;36:588-95.
9. Mori Y, Murakami T, Suzuma K, et al. Relation between macular morphology and treatment frequency during twelve months with ranibizumab for diabetic macular ede- ma. PLoS One 2017;12:e0175809.
10. Giocanti-Auregan A, Hrarat L, Qu LM, et al. Functional and anatomical outcomes in patients with serous retinal detachment in diabetic macular edema treated with ranibi- zumab. Invest Ophthalmol Vis Sci 2017;58:797-800.
11. Pelosini L, Hull CC, Boyce JF, et al. Optical coherence tomog- raphy may be used to predict visual acuity in patients with macular edema. Invest Ophthalmol Vis Sci 2011;52:2741-8.
12. Shimura M, Nakazawa T, Yasuda K, et al. Comparative therapy evaluation of intravitreal bevacizumab and triam- cinolone acetonide on persistent diffuse diabetic macular edema. Am J Ophthalmol 2008;145:854-61.
13. Shah SU, Harless A, Bleau L, Maturi RK. Prospective ran- domized subject-masked study of intravitreal bevacizumab monotherapy versus dexamethasone implant monotherapy in the treatment of persistent diabetic macular edema. Reti- na 2016;36:1986-96.
14. Sophie R, Lu N, Campochiaro PA. Predictors of functional and anatomic outcomes in patients with diabetic macular ede- ma treated with ranibizumab. Ophthalmology 2015;122:1395- 401.
15. Ferris FL 3rd, Patz A. Macular edema: a complication of dia- betic retinopathy. Surv Ophthalmol 1984;28 Suppl:452-61.
16. Bressler SB, Qin H, Beck RW, et al. Factors associated with changes in visual acuity and central subfield thickness at 1 year after treatment for diabetic macular edema with ran- ibizumab. Arch Ophthalmol 2012;130:1153-61.
17. Yanoff M, Fine BS, Brucker AJ, Eagle RC Jr. Pathology of human cystoid macular edema. Surv Ophthalmol 1984;28 Suppl:505-11.
18. Bringmann A, Reichenbach A, Wiedemann P. Pathomecha- nisms of cystoid macular edema. Ophthalmic Res 2004;36:241-9.
19. Spaide RF. Retinal vascular cystoid macular edema: review and new theory. Retina 2016;36:1823-42.
20. Romero-Aroca P, Baget-Bernaldiz M, Pareja-Rios A, et al.
Diabetic macular edema pathophysiology: vasogenic versus inflammatory. J Diabetes Res 2016;2016:2156273.