Original Article
Multifocal Electroretinogram Findings after Intravitreal Bevacizumab Injection in Choroidal Neovascularization of
Age-Related Macular Degeneration
Joo Youn Park, Seung Hoon Kim, Tae Kwann Park, Young-Hoon Ohn
Department of Ophthalmology, Soonchunhyang University College of Medicine, Bucheon, Korea
Purpose: To evaluate the changes in multifocal electroretinogram (mfERG) and optical coherence tomography (OCT) after intravitreal bevacizumab injection in the treatment of age-related macular degeneration (AMD).
Methods: Twenty-one eyes with choroidal neovascularization secondary to AMD were studied before and after intravitreal bevacizumab injection for best corrected visual acuity (BCVA), OCT, and mfERG.
Results: The BCVA improved, while central macular thickness and total macular volume in OCT decreased af- ter intravitreal bevacizumab injection (p = 0.03, 0.01, and 0.01, respectively). In mfERG, the amplitude of P1, and implicit time of P1 and N1 indicated a statistically significant improvement of retinal response after intravitreal bevacizumab injection.
Conclusions: There is a potential role for mfERG in evaluating the effect on retinal function of intravitreal bev- acizumab injection.
Key Words:Age-related macular degeneration, Bevacizumab, Choroidal neovascularization, Multifocal electroretinogram, Optical coherence tomography
ⓒ2011 The Korean Ophthalmological Society
This is an Open Access article distributed under the terms of the Creative Commons Attribution Non-Commercial License (http://creativecommons.org/licenses /by-nc/3.0/) which permits unrestricted non-commercial use, distribution, and reproduction in any medium, provided the original work is properly cited.
Received: July 12, 2010 Accepted: October 2, 2010
Corresponding Author: Young-Hoon Ohn, MD, PhD. Department of Ophthalmology, Soonchunhyang University College of Medicine, #1174 Jung-dong, Wonmi-gu, Bucheon 420-767, Korea. Tel: 82-32-621-5053, Fax: 82-32-621-5018, E-mail: [email protected]
Age-related macular degeneration (AMD) is the leading cause of legal blindness in people over the age of 65 years, and severe decreased visual acuity is believed to be due to choroidal neovascularization (CNV) [1,2].
Vascular endothelial growth factor (VEGF) has been im- plicated as a major stimulus for CNV in AMD, and in the breakdown of the blood retina barrier, with increased vascular permeability resulting in retinal edema [3,4].As a consequence, VEGF inhibitors have been launched recently for the treat- ment of CNV in the clinical field [5-7]. Among them, bev- acizumab (Avastin®; Genentech, San Francisco, CA, USA), a recombinant humanized monoclonal antibody to human VEGF, was approved by the U.S. Food and Drug Administration for the treatment of metastatic colorectal cancer on February, 2004. Previous studies have revealed that intravitreal bev- acizumab injection improved vision, but these studies con-
cluded from subjective changes of visual acuity and anatomi- cal changes after injection [8-11]. Recently, several studies have assessed the electrophysiological effect of intravitreal bevacizumab [12-14]. The aim of this study is to evaluate the electroretinographic changes of the macula in eyes with CNV due to AMD by means of multifocal electroretinography (mfERG), which reflects retinal function objectively [15], and optical coherence tomography (OCT), before and after intravitreal bevacizumab injection.
Materials and Methods
The present study was designed as a retrospective study of eyes with CNV secondary to AMD treated with intravitreal bevacizumab injection between March, 2008 and April, 2009. Medical records of patients who underwent intravitreal injections of bevacizumab for CNV due to AMD were reviewed.
Patients who had ocular diseases such as high myopia or dif- fuse retinal degeneration that might influence the mfERG were excluded from the study.
Each patient received three intravitreal injections of bev- acizumab (1.875 mg / 0.075 mL) at six week intervals (one at baseline, and then at six and 12 weeks later) under sterile
Ring 3
Ring 2
Ring 1
50%
Fig. 1. Stimulus array of 103 hexagonal elements; ring 1, ring 2, and ring 3 correspond to the fovea, parafovea, and perifovea, respectively. ILM = internal limiting membrane; RPE = retinal pig- ment epithelium.
A Changes in best corrected visual acuity
B Changes of central macular thickness
C Changes of total macular volume
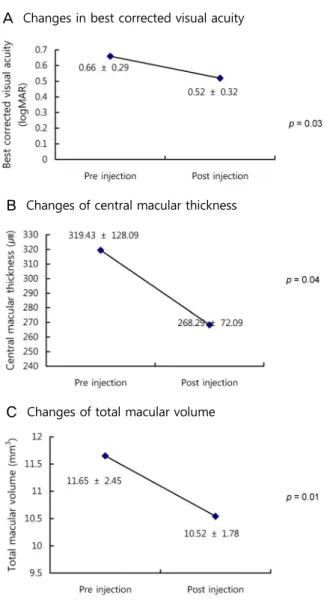
Fig. 2. Changes in best corrected visual acuity (A), central macular thickness (B), and total macular volume (C) before and after intra- vitreal injection (Wilcoxon's signed rank test, p < 0.05). logMAR
= logarithm of the minimum angle of resolution.
conditions in an operating room. Postoperative antibiotics (ofloxacin; Tarivid, Santen, Japan) were applied four times per day for seven days.
Each patient underwent a baseline screening, including slit-lamp examination and best corrected visual acuity (BCVA;
logarithm of the minimum angle of resolution [logMAR]) testing, Cirrus OCT (Carl Zeiss Meditec, Dublin, CA, USA), and mfERG. One month after completion of the three in- jections, the patients were examined. All tests were per- formed on the same day. Cirrus OCT was performed with the 512 × 128 scan pattern. Research software (Research Browser ver. V.2.0.0.62, Carl Zeiss Meditec) was used to extract central macular thickness (CMT), including a circular 1-mm radius area around the fovea; total macular volume (TMV) was cal- culated from an area of 6 × 6 mm with the midpoint centered on the fovea. These calculations were based on the retinal segmentation algorithm of the Cirrus OCT prototype device.
MfERG recordings were performed using VERIS ver. 4.2 (EDI, San Mateo, CA, USA). The patients’ pupils were di- lated using a mixture of 0.5% tropicamide and 0.5% phenyl- ephrine hydrochloride (Mydrin-P; Santen Pharmaceuticals, Osaka, Japan), and the eye to be tested was anesthetized us- ing proparacaine hydrochloride 0.5% (Alcaine; Alcon, Fort Worth, TX, USA). A Burian-Allen bipolar electrode was in- serted under 99% contrast and high luminance of 200 cd/m2. The stimulus matrix consisted of 103 hexagonal elements displayed on a CRT color monitor driven at 75 Hz. The filter setting band pass was 5 to 100 Hz and the duration of the data acquisition was 4 minutes divided into eight sessions of 30 seconds. The amplitude of each local response was estimated as the dot product between the normalized response template and each local response (scalar product method). The mfERG stimulus locations and anatomic areas corresponded roughly as follows: ring 1 to the fovea, ring 2 to the parafo- vea, and ring 3 to the perifovea (Fig. 1). The amplitude of each group was scaled to reflect the angular size of the stim-
ulus hexagon, which produces the response. These averages give a more accurate view of the relative response densities of each group. The recordings used the first-order kernel component of the mfERG, which is the largest mfERG re- sponse derived with a biphasic waveform characterized by an initial negative deflection (N1), followed by a positive peak (P1). This study included the amplitude and implicit time of N1 and P1 in rings 1, 2, and 3. To reduce errors by testers, on- ly one tester performed all tests and determined the peak points of responses.
For the statistical analysis, the results from participants were analyzed by Wilcoxon's signed rank test in SPSS ver.
14.0 (SPSS Inc., Chicago, IL, USA). In addition, Spearman rank test and linear correlation analysis were used in order to evaluate the correlation with changes of mfERG components, the best visual acuity, and changes of OCT components.
Differences and correlations were considered to be significant
A Changes of N1 amplitude after injection
B Changes of P1 amplitude after injection
Fig. 3. Changes of N1 (A) and P1 (B) amplitude in multifocal elec- troretinogram before and after intravitreal injection (Wilcoxon's signed rank test, p < 0.05).
A Changes of N1 implicit time after injection
B Changes of P1 implicit time after injection
Fig. 4. Changes of N1 (A) and P1 (B) implicit time in multifocal electroretinogram before and after intravitreal injection (Wilcoxon's signed rank test, p < 0.05).
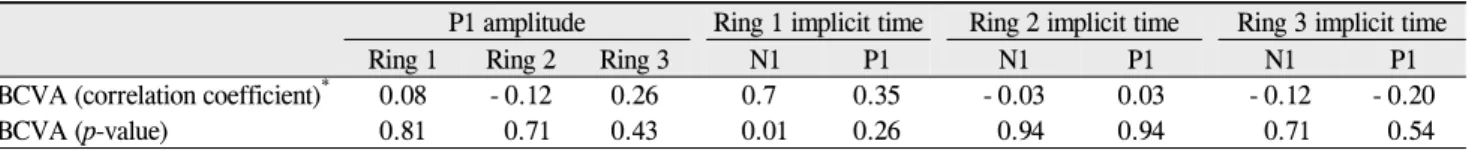
Table 1. Correlation with parameters of multifocal electroretinography and best corrected visual acuity (BCVA) P1 amplitude Ring 1 implicit time Ring 2 implicit time Ring 3 implicit time
Ring 1 Ring 2 Ring 3 N1 P1 N1 P1 N1 P1
BCVA (correlation coefficient)* 0.08 - 0.12 0.26 0.7 0.35 - 0.03 0.03 - 0.12 - 0.20
BCVA (p-value) 0.81 0.71 0.43 0.01 0.26 0.94 0.94 -0.71 -0.54
*Spearman’s Rho, p < 0.05.
Table 2. Correlation between parameters of multifocal electroretinography responses and central macular thickness (CMT)
P1 amplitude Ring 1 implicit time Ring 2 implicit time Ring 3 implicit time
Ring 1 Ring 2 Ring 3 N1 P1 N1 P1 N1 P1
CMT (correlation coefficient)* 0.03 0.32 0.19 - 0.04 - 0.3 - 0.16 - 0.34 0.39 0.28
CMT (p-value) 0.93 0.32 0.56 0.91 0.93 0.63 0.29 0.21 0.37
*Spearman’s Rho, p < 0.05.
when p < 0.05.
Results
Twenty eyes (14 patients) with CNV secondary to AMD were included. The mean patient age was 55.9 ± 13.9 years.
Before injection, the mean best corrected visual acuity (BCVA) was 0.66 ± 0.29 (logMAR ± SD). The mean BCVA improved to 0.52 ± 0.32 (logMAR ± SD) after treatment (p =
0.03) (Fig. 2A). The mean CMT measured by OCT at base- line was 319.43 ± 128.09 μm. At one month post injection, the mean CMT measurement had decreased to 268.29 ± 72.09 μm (Fig. 2B). Statistically significant difference was found between the CMT at baseline and after treatment (p = 0.04).
TMV was 11.65 ± 2.45 mm3 before treatment and decreased to 10.52 ± 1.78 mm3 after treatment. There was significant improvement in TMV after injection (p = 0.01) (Fig. 2C).
In mfERG, the amplitude of N1 in rings 1 to 3 changed after
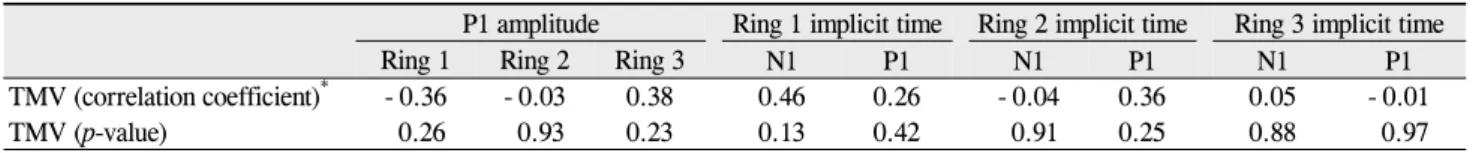
Table 3. Correlation between parameters of multifocal electroretinography and total macular volume (TMV)
P1 amplitude Ring 1 implicit time Ring 2 implicit time Ring 3 implicit time
Ring 1 Ring 2 Ring 3 N1 P1 N1 P1 N1 P1
TMV (correlation coefficient)* - 0.36 - 0.03 0.38 0.46 0.26 - 0.04 0.36 0.05 - 0.01
TMV (p-value) 0.26 0.93 0.23 0.13 0.42 0.91 0.25 0.88 0.97
*Spearman’s Rho, p < 0.05.
treatment, but no statistically significant differences were found (ring 1, p = 0.18; ring 2, p = 0.27; ring 3, p = 0.55) (Fig. 3A).
The amplitude of P1 in rings 1 to 3 increased after injection with statistical significance (ring 1, p = 0.03; ring 2, p = 0.04;
ring 3, p = 0.02) (Fig. 3B). From ring 1 to 3, the implicit time of N1 and P1 decreased after injection compared with base- line, and statistical analysis revealed significant difference (P1: ring 1, p = 0.02; ring 2, p = 0.01; ring 3, p = 0.03; N1: ring 1, p = 0.01; ring 2, p = 0.02; ring 3, p = 0.01) (Fig. 4).
There appeared to be a linear relationship between changes of N1 implicit time in ring 1 and the BCVA however, other factors had no significant difference (Table 1). The correla- tion between CMT and mfERG values was not significant (Table 2). The TMV correlated with the implicit time of N1 and P1 in ring 1, P1 in ring 2, and N1 in ring 3, but without statistical significance. A reverse correlation was seen be- tween TMV and amplitude in rings 1 and 2, but not at a sig- nificant level (Table 3).
Discussion
Bevacizumab is a recombinant humanized monoclonal an- tibody to human VEGF that binds to VEGF and blocks it from binding to its receptors in tumor tissues. Intravitreal bevacizumab injection is increasingly used as an off-label therapy in ophthalmology, and shows benefits in the im- provement of visual acuity and anatomical changes of many eye diseases [8-14,16].
As we hypothesized, visual acuity and anatomical changes were associated with functional changes of the retina, thus we used mfERG, which assesses retinal function, to confirm functional changes after injection. The use of mfERG en- ables topographic mapping of retinal function in the central 30° of the retina. Recent studies revealed that the human mfERG response is dominated by cells of the outer retina, such as the photoreceptors and the ON- and OFF-bipolar cells, than cells from the inner retina [17,18].Accordingly, mfERG response is useful in evaluating cone cells in pro- portion to bipolar cells, while the amplitude and implicit time show retinal functions principally [19].Any damage to the receptor that destroys the cell or reduces its responsiveness will lead to a decrease in the mfERG response amplitude.
The result showed that intravitreal bevacizumab injection has clinical benefit in CNV secondary to AMD in terms of visual acuity, CMT, TMV, and mfERG response. These find- ings are similar to those of previous studies [8-14,16]. Before injection, the amplitude of P1 and N1 decreased to less than
normal values, representing impaired retinal function. The amplitude of P1 increased in rings 1, 2, and 3 after injection, and the changes of amplitude were significantly different. On the other hand, the amplitude of N1 showed no significant change after injection. The changes of the P1 amplitude were more significant than those of N1. The P1 amplitude is be- lieved to be linked to the number and function of photo- receptor cells [19-22]. Damage of the photoreceptor outer segment will reduce the P1 amplitude and result in delays of its implicit time [18]. In this study we assumed that bipolar and other outer retina cells have more of an effect on P1 waveforms than N1 waveforms [22,23]. Unlike previous studies [12-14], we evaluated not only the change of the am- plitude, but the change of the implicit time after intravitreal bevacizumab injection. The implicit times of P1 and N1 were prolonged before and after injection compared with normal values. The delayed P1 implicit time was due to delay in bi- polar cell response of the outer retina [19]. It is also possible that the delay in the N1 implicit time reflected damage to the inner retinal layers, as well as the outer retina [22].In our study the implicit times of P1 and N1 in rings 1, 2, and 3 showed statistically significant improvement compared with amplitude. Implicit time has been shown to be more sensitive than amplitude in CNV as well as other conditions, such as diabetes [24], retinitis pigmentosa [25,26], and macular dys- trophy [27]. The implicit time is thought to be more susceptible than the amplitude to injury of photoreceptors and the outer plexiform layer [19,22,23,28].Although mfERG responses after injection improved compared with the baseline, the am- plitude and implicit time were in the sub-normal range.
Analysis showed that intravitreal bevacizumab injection contributed to improvement of retinal function, but did not result in complete recovery.
In a study on 18 eyes with AMD by Moschos et al. [13], there was improvement of visual acuity, mfERG response, and OCT parameters after intravitreal bevacizumab in- jection, but there was no correlation between values. Maturi et al. [14] studied nine patients with AMD after injection and found patients to have significantly higher amplitude com- pared with baseline, but no correlation was found between amplitude and visual acuity or CMT. Also, these findings show that BCVA, CMT, TMV, the amplitude, and implicit time of mfERG had no obvious correlation, except for the implicit time of N1 in ring 1 and the BCVA.
From the results, we observed less correlation between mfERG responses and improvement of visual acuity and ana- tomical changes, as mfERG waveforms reflect not only the
photoreceptor layer, but also bipolar and other cells in the in- ner retina. Also, the amplitude and implicit time can be influ- enced by injury or atrophy of the retina, particularly of the photoreceptor layer and retinal pigment epithelium. Such in- juries may alter retinal function, which cannot be measured by changes of visual acuity and anatomy. Therefore, measuring only visual acuity or anatomical changes might miss information regarding retinal function that might be observed if the ob- jective parameter was included. Evaluation with retinal func- tion can offer more comprehensive information in order to make detailed assessments of effective treatment.
In conclusion, intravitreal bevacizumab injection improved patients’ visual acuity and caused anatomical changes in CNV secondary to AMD. Furthermore, intravitreal injection of bevacizumab resulted in improvement of mfERG responses, especially the implicit time compared with amplitude. There is a potential role for mfERG in assessing the functional changes of the central retina after intravitreal bevacizumab injection.
To better evaluate objective changes of retinal functions using mfERG after intravitreal bevacizumab injection, fur- ther prospective randomized controlled clinical trials will be needed, with scheduled re-injections and longer follow-up intervals.
Conflict of Interest
No potential conflict of interest relevant to this article was reported.
References
1. Friedman DS, O'Colmain BJ, Muñoz B, et al. Prevalence of age-related macular degeneration in the United States. Arch Ophthalmol 2004;122:564-72.
2. Kroll P, Meyer CH. Which treatment is best for which AMD patient? Br J Ophthalmol 2006;90:128-30.
3. Adamis AP, Shima DT. The role of vascular endothelial growth factor in ocular health and disease. Retina 2005;25:
111-8.
4. Ferrara N. Vascular endothelial growth factor: basic science and clinical progress. Endocr Rev 2004;25:581-611.
5. Cohen SY. Anti-VEGF drugs as the 2009 first-line therapy for choroidal neovascularization in pathologic myopia. Retina 2009;29:1062-6.
6. Modarres M, Naseripour M, Falavarjani KG, et al. Intravitreal injection of 2.5 mg versus 1.25 mg bevacizumab (Avastin) for treatment of CNV associated with AMD. Retina 2009;29:319- 24.
7. Tatar O, Yoeruek E, Szurman P, et al. Effect of bevacizumab on inflammation and proliferation in human choroidal neovascularization. Arch Ophthalmol 2008;126:782-90.
8. Schouten JS, La Heij EC, Webers CA, et al. A systematic re- view on the effect of bevacizumab in exudative age-related macular degeneration. Graefes Arch Clin Exp Ophthalmol 2009;247:1-11.
9. Avery RL, Pieramici DJ, Rabena MD, et al. Intravitreal bev- acizumab (Avastin) for neovascular age-related macular
degeneration. Ophthalmology 2006;113:363-372.e5.
10. Rich RM, Rosenfeld PJ, Puliafito CA, et al. Short-term safety and efficacy of intravitreal bevacizumab (Avastin) for neo- vascular age-related macular degeneration. Retina 2006;26:495- 511.
11. Kim YH, Kim ES, Yu SY, Kwak HW. Long-term effect of in- travitreal bevacizumab for CNV secondary to age-related macular degeneration. J Korean Ophthalmol Soc 2008;49:1935-40.
12. Karanjia R, Eng KT, Gale J, et al. Electrophysiological effects of intravitreal Avastin (bevacizumab) in the treatment of exu- dative age-related macular degeneration. Br J Ophthalmol 2008;92:1248-52.
13. Moschos MM, Brouzas D, Apostolopoulos M, et al. Intravitreal use of bevacizumab (Avastin) for choroidal neovascularization due to ARMD: a preliminary multifocal-ERG and OCT study.
Multifocal-ERG after use of bevacizumab in ARMD. Doc Ophthalmol 2007;114:37-44.
14. Maturi RK, Bleau LA, Wilson DL. Electrophysiologic find- ings after intravitreal bevacizumab (Avastin) treatment. Retina 2006;26:270-4.
15. Berrow EJ, Bartlett HE, Eperjesi F, Gibson JM. The electro- retinogram: a useful tool for evaluating age-related macular disease? Doc Ophthalmol 2010;121:51-62.
16. Oh SB, Cho WB, Moon JW, Kim HC. Effects and prognostic factors of intravitreal bevacizumab injection on choroidal neo- vascularization from age-related macular degeneration. J Korean Ophthalmol Soc 2009;50:202-10.
17. Maturi RK, Yu M. Multifocal electroretinography and its clin- ical application. In: Ciulla TA, Regillo CD, Harris A, editors.
Retina and optic nerve imaging. Philadelphia: Lippincott Williams & Wilkins; 2003. p. 213-30.
18. Hood DC, Frishman LJ, Saszik S, Viswanathan S. Retinal ori- gins of the primate multifocal ERG: implications for the hu- man response. Invest Ophthalmol Vis Sci 2002;43:1673-85.
19. Hood DC. Assessing retinal function with the multifocal technique. Prog Retin Eye Res 2000;19:607-46.
20. Marmor MF, Tan F, Sutter EE, Bearse MA Jr. Topography of cone electrophysiology in the enhanced S cone syndrome.
Invest Ophthalmol Vis Sci 1999;40:1866-73.
21. Kretschmann U, Stilling R, Rüther K, Zrenner E. Familial macular cone dystrophy: diagnostic value of multifocal ERG and two-color threshold perimetry. Graefes Arch Clin Exp Ophthalmol 1999;237:429-32.
22. Li J, Tso MO, Lam TT. Reduced amplitude and delayed la- tency in foveal response of multifocal electroretinogram in early age related macular degeneration. Br J Ophthalmol 2001;85:287-90.
23. Kondo M, Miyake Y, Horiguchi M, et al. Clinical evaluation of multifocal electroretinogram. Invest Ophthalmol Vis Sci 1995;36:2146-50.
24. Schneck ME, Bearse MA Jr, Han Y, et al. Comparison of mfERG waveform components and implicit time measure- ment techniques for detecting functional change in early dia- betic eye disease. Doc Ophthalmol 2004;108:223-30.
25. Hood DC, Holopigian K, Greenstein V, et al. Assessment of local retinal function in patients with retinitis pigmentosa us- ing the multi-focal ERG technique. Vision Res 1998;38:163-79.
26. Seeliger M, Kretschmann U, Apfelstedt-Sylla E, et al. Multifocal electroretinography in retinitis pigmentosa. Am J Ophthalmol 1998;125:214-26.
27. Miyake Y, Horiguchi M, Tomita N, et al. Occult macular dystrophy. Am J Ophthalmol 1996;122:644-53.
28. Hood DC, Odel JG, Chen CS, Winn BJ. The multifocal electroretinogram. J Neuroophthalmol 2003;23:225-35.