Original Article
Introduction
Social networks have been considered as an important social factor associated with cardiovascular disease (CVD) in terms of social contacts, social sup- port, or social isolation
1). A recent meta-analysis showed that the function of social networks (content
The Association between Social Network Betweenness and Coronary Calcium: A Baseline Study of Patients with a High Risk of Cardiovascular Disease
Won-tak Joo1, Chan Joo Lee2, Jaewon Oh2, In-Cheol Kim3, Sang-Hak Lee2, Seok-Min Kang2, Hyeon Chang Kim4, Sungha Park2 and Yoosik Youm5
1Department of Sociology, University of Wisconsin-Madison, Madison, WI, USA
2 Cardiology Division, Severance Cardiovascular Hospital and Cardiovascular Research Institute, Yonsei University College of Medicine, Seoul, Republic of Korea
3 Division of Cardiology, Department of Internal Medicine, Dongsan Medical Center, Keimyung University College of Medicine, Daegu, Republic of Korea
4Department of Preventive Medicine, Yonsei University College of Medicine, Seoul, Republic of Korea
5Department of Sociology, Yonsei University, Seoul, Republic of Korea
Aim: The association of social networks with cardiovascular disease (CVD) has been demonstrated through various studies. This study aimed to examine the association between social network between- ness –a network position of mediating between diverse social groups–and coronary artery calcium.
Methods: The data of 1,384 participants from the Cardiovascular and Metabolic Disease Etiology Research Center – High Risk Cohort, a prospective cohort study enrolling patients with a high risk of developing CVD (clinicaltrials.gov: NCT02003781), were analyzed. The deficiency in social network betweenness was measured in two ways: only-family networks, in which a respondent had networks with only family members, and no-cutpoint networks, in which the respondent does not function as a point of bridging between two or more social groups that are not directly connected.
Results: Participants who had higher coronary artery calcium scores (CACSs) were likely to have a smaller network size (p<0.001), only-family networks (p<0.001), and no-cutpoint networks (p< 0.001). Multiple logistic regression analyses revealed no significant association between network size and CACS. Only no-cutpoint networks had a significant relationship with CACS >400 (odds ratio, 1.72; 95% confidence interval, 1.07 – 2.77; p=0.026). The association was stronger among older (age
>60 years) and female respondents.
Conclusion: Deficiency in social network betweenness is closely related to coronary calcium in par- ticipants with a high risk of CVD. To generalize these results to a general population, further study should be performed.
See editorial vol. 25: 124-125
Key words: Coronary calcium score, Social networks, Cardiovascular disease, Risk factor
Address for correspondence: Sungha Park, Division of Cardi- ology, Severance Cardiovascular Hospital, Yonsei University College of Medicine, 50-1 Yonsei-ro, Seodaemun-gu, Seoul 03722, Republic of Korea
E-mail: [email protected] Received: March 13, 2017
Accepted for publication: June 1, 2017
Copyright©2018 Japan Atherosclerosis Society
This article is distributed under the terms of the latest version of CC BY-NC-SA defined by the Creative Commons Attribution License.
Won-tak Joo and Chan Joo Lee contributed equally to this work.
tomatic old cerebrovascular accident, or
>30% steno- sis in at least one major coronary artery); patients with rheumatoid arthritis aged
>40 years and taking meth- otrexate and steroid; patients with atrial fibrillation with CHA2DS2-VASc score ≥1; and kidney trans- plant recipients at
>3 months after transplantation.
People aged
>20 years who met at least one of the inclusion criteria were enrolled. The exclusion criteria were as follows: a history of acute coronary syndrome;
symptomatic coronary artery disease or symptomatic peripheral; heart failure; with a life expectancy of
<6 months; pregnant women; a history of contrast allergy and related adverse effects. A total of 1,958 partici- pants were enrolled from November 2013 to May 2016 at the Severance Hospital in Seoul, Republic of Korea. The Institutional Review Board of the Yonsei University Health System Clinical Trial Center approved the study protocol (4-2013-0581), and writ- ten informed consent was obtained from all partici- pants. Among the participants, 312 did not undergo a coronary artery calcium scanning, and 16 did not par- ticipate in the social network survey or provided incomplete information about their networks. After excluding 23 participants with missing values in socio- economic status, 20 in health behaviors or medical history, and 213 in laboratory analyses (203 with missing lipid profile data), we examined 1,384 partici- pants in the final analyses.
Social Network Betweenness
The CMERC adopted a social network module called name generator from a nationwide study in the United States
8). The Korean version of name generator has been used in nationwide social surveys in South Korea
9), and proved to capture important network properties for health in a comparative study of the USA and South Korea
10). The module started as fol- lows: “From time to time, most people discuss things that are important to them with others. For example, these may include good or bad things that happen to you, prob- lems you are having, or important concerns you may have. Looking back over the last 12 months, who are the people with whom you most often discussed things that were important to you ? ” The participants listed the real names of up to five people, and reported the type of relationship with each person (e.g., spouse, child, neighbor). The participants also reported the emo- tional closeness between network members within each pair (“How emotionally close are NAME1 and NAME2 to each other ? ”) on a five-level scale (do not know each other, not close, somewhat close, very close, or very much close).
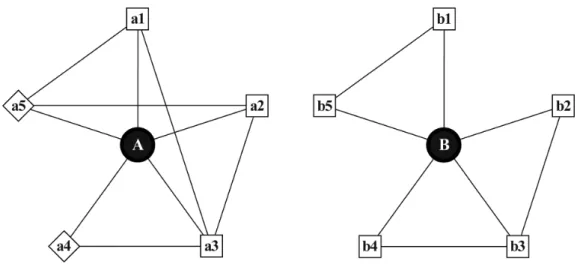
Fig. 1 illustrates two possible networks, where circles represent participants, squares represent social provided by social networks, such as emotional or
instrumental support) strongly affected the onset and development of CVD; however, there is little evidence on the effects of the structure of social networks (objective features of social networks, such as fre- quency of contacts or network size)
2). Despite the var- ied results concerning network structure, investigation of the detailed features of network structure has been consistently demanded because these determine the potential role and function of social networks
3).
Social network betweenness is a network structure in which a member can indirectly bridge between two or more social actors or groups that have no direct social connections to each other
4). For example, a per- son who maintains intimate relationships with the two social groups of neighbors and university alumni can better take advantage of social networks than those connected with only neighbors or only alumni, because this person can (i) draw more diverse resources and information from people of two different back- grounds, and (ii) feel a sense of freedom from crossing over various social groups
5). Whereas a few studies have examined the social determinants of coronary artery calcium, such as psychosocial stress
6)or marital status
7), there were no research that explicitly exam- ined the relationship to structural features of social networks. By adopting an elaborate social network module that reveals thorough information about a person’s important social network members, we inves- tigated the association between social network struc- ture and coronary artery calcium, with a focus on the limitations in social network betweenness.
Methods Study Population
This study analyzed the data from Cardiovascu- lar and Metabolic Disease Etiology Research Center – High Risk Cohort (CMERC-HI). Briefly, CMERC- HI is a prospective cohort study aimed at developing more specific preventive strategies for patients with a high risk of CVD (clinicaltrials.gov NCT02003781).
The inclusion criteria of the cohort were as follows:
high-risk patients with hypertension [estimated glo- merular filtration rate (eGFR)
>60 mL/min/1.73 m
2with target organ damage, or eGFR ≤60 mL/min/1.73 m
2]; patients with diabetes mellitus with albuminuria;
anuric patients with end-stage renal disease (ESRD) who were undergoing dialysis; relatives of patients with acute myocardial infarction (men
<55 years old;
women
<65 years old); patients with asymptomatic
atherosclerotic CVD (abdominal aorta diameter ≥3
cm or ankle-brachial index
<0.9, or carotid plaque or
carotid intima-media thickness ≥0.9 mm, or asymp-
not act as a cutpoint so were categorized into a NC network group. When counting the number of groups in networks, we only considered very close or very much close social connections among network members.
Those who have OF or NC networks are expected to have little diversity in their social interactions, and lit- tle potential to draw resources from different social pools.
Acquisition of Computed Tomographic Images for Coronary Artery Calcium and Image Analysis
The patients were scanned by using a 320-detec- tor row computed tomography (CT) scanner (Aquil- lion ONE; Toshiba Medical Systems Corporation, Tokyo, Japan). A non-enhanced prospective electro- cardiogram-gated CT scan was performed to measure the coronary artery calcium score (CACS) with the following parameters: rotation time 275 ms, slice col- limation 0.5 mm, slice thickness 3.0 mm, tube voltage 100 kV, and automatic tube current modulation (SURE Exposure 3D standard; Toshiba Medical Sys- tems Corporation, Otawara, Japan). Images were ana- lyzed in a core workstation by using dedicated soft- ware (TeraRecon V. 4.4.11.82.3430.Beta, Foster City, CA, USA). CACS was calculated by using the Agatston method
12, 13).
network members from a family (e.g., parent, child, relative), diamonds represent non-family network members (e.g., friend, neighbor), and lines show the social connections. Network size was defined as the total number of social network members. A and B have five network members each; thus, their network size is 5. The deficiency in social network betweenness was measured by using two binary indicators. First, if a participant did not enumerate any non-family mem- bers in his or her network list, he or she was consid- ered to have only-family (OF) networks. Compared with A’s networks of three family members [a1, a2, a3]
and two non-family members [a4, a5], B’s networks are limited in the family. Participants who listed no social network member were assumed to have OF net- works in this study. Second, if a respondent did not function as a cutpoint of his or her networks, he or she was considered to have no-cutpoint (NC) networks.
In network theory, a cutpoint is a person whose dele- tion breaks up the remaining group into two or more disconnected pieces
11). A’s networks show an example of NC networks: A’s network members are all con- nected to at least one other network member even when respondent A is missing, whereas B’s networks are divided into the two groups of [b1, b5] and [b2, b3, b4] when respondent B is deleted. Participants who listed no or only one social network member can-
Fig. 1. Two possible social networks. Circles represent participants, squares represent social network members from a family (e.g., parent, child, relative), diamonds represent non-family net- work members (e.g., friend, neighbor), and lines show the social connections. Network size was defined as the total number of social network members. Only-family networks (OF) do not include any non-family member. Compared to A’s networks, B’s networks are limited in the family. A cutpoint is a person whose deletion breaks up the remaining group into two or more disconnected pieces. If a respondent did not function as a cutpoint of his or her net- works, he or she was considered to have no-cutpoint (NC) networks. A’s networks show an example of NC networks: A’s network members are all connected to at least one other net- work member even when respondent A is missing, whereas B’s networks are divided into the two groups of [b1, b5] and [b2, b3, b4] when respondent B is deleted.
assessment of causal effects, we adopted the coarsened exact matching (CEM) method in Model Cs
16). Unlike other matching methods based on propensity scores, CEM matches observations with those with “exactly”
the same values of covariates, and performs regression analyses using a subsample of matched observations where the treated and untreated groups are weighted to have the same sample size. Since it is hard to find observations with exactly the same covariates in a given sample, CEM “coarsens” covariates to a small number of categories before matching. Under the assumption that this set of variables determine the present social networks, we can consider the associa- tions between CACS and networks from CEM as causal. As it was hard to retain enough sample size for statistical inference when treating with multivalued treatment, we did not test a CEM model with three dummy variables for network betweenness. In this analysis, continuous variables were coarsened into three groups, and categorical variables were adopted as orig- inal categories. As covariates for matching, we examined those that had significant bivariate relationships with network betweenness (age, diabetes, depression, SBP, LDL-cholesterol, glucose, eGFR, education, income, working, and marriage). When doing regression analy- ses after finding a subsample of matched observations, we used the same set of covariates as other multiple logistic regression analyses except that the categorical variables that were not coarsened during matching were excluded. Third, we restricted our sample to those with social network size
>1 and performed the same logistic regression analyses in Model Ds. Since social network betweenness can arise from at least two social network members, some sociologists emphasized a qualitative difference between those who have so small networks (≤1) to cultivate network betweenness and the others with big networks
17). By restricting our sam- ple to those with social network size
>1, we could focus on the disadvantage of deficiency in network betweenness among participants whose networks were big enough to have network betweenness. The analy- ses were performed by using STATA 14 (StataCorp LP, College Station, TX, USA).
Results
Table 1 shows the clinical characteristics of par- ticipants according to CACS. Participants who were included in a higher CACS group were more likely to be older, male, currently smoking, having diabetes, a sedentary lifestyle, ESRD or a history of receiving kid- ney transplantation, higher SBP, lower DBP, and higher level of fasting plasma glucose. These participants had lower serum cholesterol, possibly because more statin Statistical Analysis
The participants were divided into four groups according to CACS, as follows: (i) 0, (ii) 1 – 100, (iii) 101 – 400, and (iv)
>400. Bivariate relationships were considered among CACS and various characteristics.
Continuous variables were expressed as mean
±SD, and compared by using one-way analysis of variance (ANOVA). Categorical variables were expressed as number and percentage, and compared with the chi- square test. In multiple logistic regression analyses, the odds of CACS
>400 were computed according to network size and deficiency in network betweenness with covariates of age, sex, smoking, history of hyper- tension, history of diabetes, ESRD, exercise assessed by using the International Physical Activity Question- naire
14), depression assessed with Beck Depression Inventory
15), statin use, body mass index (BMI), sys- tolic blood pressure (SBP), low-density lipoprotein (LDL) cholesterol, triglyceride, fasting glucose, eGFR, level of education, household income, working status, marital status, and number of co-habitants. Five mod- els were examined with different sets of social network variables: model 1 with network size; model 2 with network size and OF networks; model 3 with network size and NC networks; model 4 with network size, OF, and NC networks; and model 5 with three dummy variables for those who had OF networks alone, NC networks alone, and both OF and NC networks. Based on the results from model 5, we also did the Wald test (H
0:
βOF alone+βNC alone=βOF+NC) to examine if there was a multiplicative association of OF and NC net- works. If the sum of coefficients for OF alone and NC alone is significantly larger than that for both OF and NC, the association can be considered multiplicative.
Using subsamples of age ≤60 years, age
>60 years,
male, or female, we re-examined models 2 and 3 and
reported the ORs for OF networks and NC networks
as figures. Additionally, we considered several models
to address the robustness of the results. First, as prob-
lems in the coronary artery could reversely affect social
networks, we considered only long-lasting social net-
works and re-examined the associations between CACS
and the deficiency in social network betweenness in
model As and Bs. Based on the information about how
many years the participants had known their social
network members, we eliminated recently-formed social
networks and re-calculated network size and between-
ness using only long-lasting network members based
on two different thresholds ( ≥5 years or ≥10 years),
and tested if the associations of network betweenness
were sustained. By removing those young networks,
we aimed to rule out the associations due to the net-
work changes caused by the present health condition
from our prediction. Second, for a more accurate
Table 1. Characteristics of participants by coronary artery calcium score (N=1384)
Variable Category Coronary calcium score (AU)
0 (n=545) 1-100 (n=364) 101-400 (n=266) >400 (n=209) P
Age, year 54.9±412.0 61.1±10 63.9±10.2 63.3±10.6 <0.001
Sex, n (%) Male 259 (48%) 212 (58%) 144 (54%) 145 (69%)
<0.001
Female 286 (52%) 152 (42%) 122 (46%) 64 (31%)
Current smoker, n (%) 213 (39%) 172 (47%) 130 (49%) 119 (57%) <0.001
Hypertension, n (%) 456 (84%) 307 (84%) 229 (86%) 184 (88%) 0.451
Diabetes, n (%) 153 (28%) 150 (41%) 139 (52%) 119 (57%) <0.001
End-stage renal disease, n (%) 84 (15%) 47 (13%) 34 (13%) 58 (28%) <0.001
Kidney transplantation, n (%) 36 (7%) 19 (5%) 19 (7%) 30 (14%) 0.001
Exercise, MET minute/week 1928.6±2493.9 2224.2±3211.8 1887.0±2747.6 1535.5±2155.1 0.032
Depression, n (%) 34 (6%) 27 (7%) 24 (9%) 24 (11%) 0.096
Statin use, n (%) 235 (43%) 188 (52%) 154 (58%) 119 (57%) <0.001
Body mass index, kg/m2 25.0±3.8 25.5±3.6 25.3±3.4 24.8±3.9 0.079
Systolic blood pressure, mmHg 123.7±14.8 129.1±16.4 130.7±18.1 132.2±21.8 <0.001 Diastolic blood pressure,
mmHg 76.8±10.3 77.2±10.4 74.3±9.5 73.9±10.1 <0.001
Total cholesterol, mg/dL 179.7±35.3 172.9±35.7 166.5±35.9 162.7±34.5 <0.001
HDL-cholesterol, mg/dL 50.9±13.2 48.0±12.5 48.5±22 45.6±11.9 <0.001
LDL-cholesterol, mg/dL 101.0±30.5 95.1±28.8 90.1±27.6 86.6±27.9 <0.001
Triglyceride, mg/dL 133.7±71.5 140.8±76.9 144.7±104.7 142.3±83.5 0.251
Fasting glucose, mg/dL 107.2±28.5 112.6±29.6 116.5±31 120.7±41.4 <0.001
Estimated GFR,
ml/min/1.73 m2 68.4±36.1 66.2±33.6 64.2±30.9 53.0±32.5 <0.001
Education, n (%) ≤Middle school 132 (24%) 111 (30%) 94 (35%) 71 (34%)
0.013
High school 192 (35%) 110 (30%) 82 (31%) 71 (34%)
≥College 221 (41%) 143 (39%) 90 (34%) 67 (32%)
Household income, n (%) <US$3000 64 (12%) 50 (14%) 52 (20%) 37 (18%)
0.013
US$3001-6000 140 (26%) 75 (21%) 66 (25%) 39 (19%)
≥US$6000 122 (22%) 94 (26%) 46 (17%) 40 (19%)
DK or refusal 219 (40%) 145 (40%) 102 (38%) 93 (44%)
Current worker, n (%) 298 (55%) 180 (49%) 104 (39%) 93 (44%) <0.001
Married, n (%) 432 (79%) 304 (84%) 220 (83%) 155 (74%) 0.034
Number of household members 1.3±1.3 1.2±1.2 1.0±1.2 1.0±1.2 <0.001
Network size 2.2±1.4 2.0±1.4 1.9±1.4 1.7±1.3 <0.001
Only-family networks, n (%) 283 (52%) 214 (59%) 180 (68%) 154 (74%) <0.001
No-cutpoint networks, n (%) 332 (61%) 242 (66%) 198 (74%) 173 (83%) <0.001
Data are presented as mean (SD) for continuous variables or n (%) for categorical variables. The p-values are from ANOVA tests for continuous variables or chi-square tests for categorical variables.
AU, Agatston unit; MET, metabolic equivalent of task; DK, do not know.
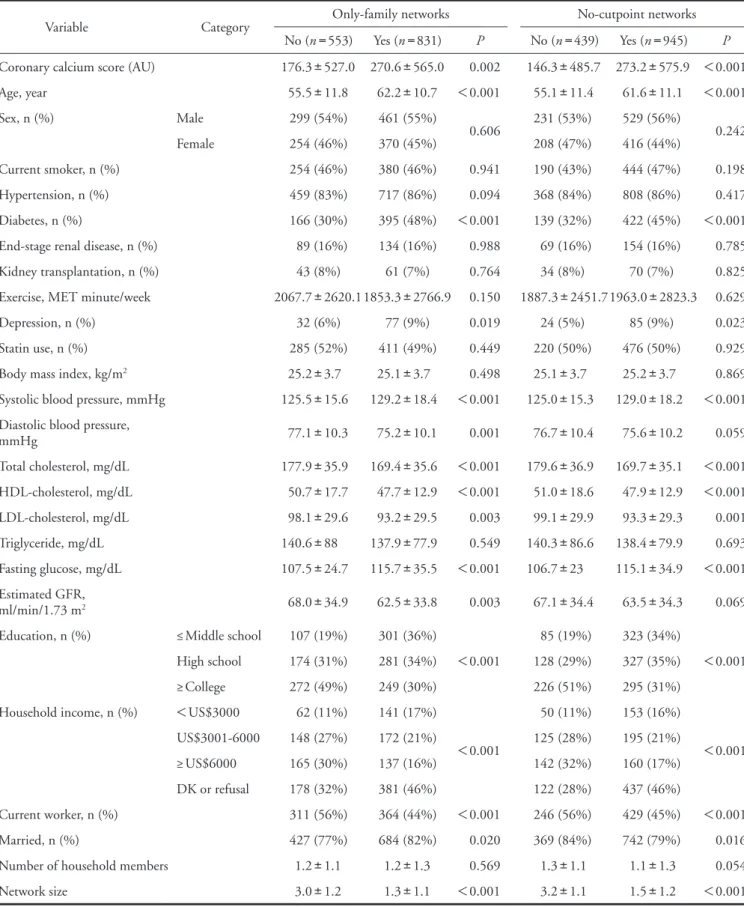
Table 2. Characteristics of participants by social network betweenness (N=1384)
Variable Category Only-family networks No-cutpoint networks
No (n=553) Yes (n=831) P No (n=439) Yes (n=945) P Coronary calcium score (AU) 176.3±527.0 270.6±565.0 0.002 146.3±485.7 273.2±575.9 <0.001
Age, year 55.5±11.8 62.2±10.7 <0.001 55.1±11.4 61.6±11.1 <0.001
Sex, n (%) Male 299 (54%) 461 (55%)
0.606 231 (53%) 529 (56%)
0.242
Female 254 (46%) 370 (45%) 208 (47%) 416 (44%)
Current smoker, n (%) 254 (46%) 380 (46%) 0.941 190 (43%) 444 (47%) 0.198
Hypertension, n (%) 459 (83%) 717 (86%) 0.094 368 (84%) 808 (86%) 0.417
Diabetes, n (%) 166 (30%) 395 (48%) <0.001 139 (32%) 422 (45%) <0.001
End-stage renal disease, n (%) 89 (16%) 134 (16%) 0.988 69 (16%) 154 (16%) 0.785
Kidney transplantation, n (%) 43 (8%) 61 (7%) 0.764 34 (8%) 70 (7%) 0.825
Exercise, MET minute/week 2067.7±2620.11853.3±2766.9 0.150 1887.3±2451.71963.0±2823.3 0.629
Depression, n (%) 32 (6%) 77 (9%) 0.019 24 (5%) 85 (9%) 0.023
Statin use, n (%) 285 (52%) 411 (49%) 0.449 220 (50%) 476 (50%) 0.929
Body mass index, kg/m2 25.2±3.7 25.1±3.7 0.498 25.1±3.7 25.2±3.7 0.869
Systolic blood pressure, mmHg 125.5±15.6 129.2±18.4 <0.001 125.0±15.3 129.0±18.2 <0.001 Diastolic blood pressure,
mmHg 77.1±10.3 75.2±10.1 0.001 76.7±10.4 75.6±10.2 0.059
Total cholesterol, mg/dL 177.9±35.9 169.4±35.6 <0.001 179.6±36.9 169.7±35.1 <0.001 HDL-cholesterol, mg/dL 50.7±17.7 47.7±12.9 <0.001 51.0±18.6 47.9±12.9 <0.001 LDL-cholesterol, mg/dL 98.1±29.6 93.2±29.5 0.003 99.1±29.9 93.3±29.3 0.001
Triglyceride, mg/dL 140.6±88 137.9±77.9 0.549 140.3±86.6 138.4±79.9 0.693
Fasting glucose, mg/dL 107.5±24.7 115.7±35.5 <0.001 106.7±23 115.1±34.9 <0.001 Estimated GFR,
ml/min/1.73 m2 68.0±34.9 62.5±33.8 0.003 67.1±34.4 63.5±34.3 0.069
Education, n (%) ≤Middle school 107 (19%) 301 (36%)
<0.001
85 (19%) 323 (34%)
<0.001
High school 174 (31%) 281 (34%) 128 (29%) 327 (35%)
≥College 272 (49%) 249 (30%) 226 (51%) 295 (31%)
Household income, n (%) <US$3000 62 (11%) 141 (17%)
<0.001
50 (11%) 153 (16%)
<0.001
US$3001-6000 148 (27%) 172 (21%) 125 (28%) 195 (21%)
≥US$6000 165 (30%) 137 (16%) 142 (32%) 160 (17%)
DK or refusal 178 (32%) 381 (46%) 122 (28%) 437 (46%)
Current worker, n (%) 311 (56%) 364 (44%) <0.001 246 (56%) 429 (45%) <0.001
Married, n (%) 427 (77%) 684 (82%) 0.020 369 (84%) 742 (79%) 0.016
Number of household members 1.2±1.1 1.2±1.3 0.569 1.3±1.1 1.1±1.3 0.054
Network size 3.0±1.2 1.3±1.1 <0.001 3.2±1.1 1.5±1.2 <0.001
Data are presented as mean±SD for continuous variables or n (%) for categorical variables. The p-values are from ANOVA tests for continuous variables or chi-square tests for categorical variables.
AU, Agatston unit; MET, metabolic equivalent of task; DK, do not know.
more likely to have OF networks but less likely to have NC networks. Those who had smaller networks were more likely to have both OF and NC networks.
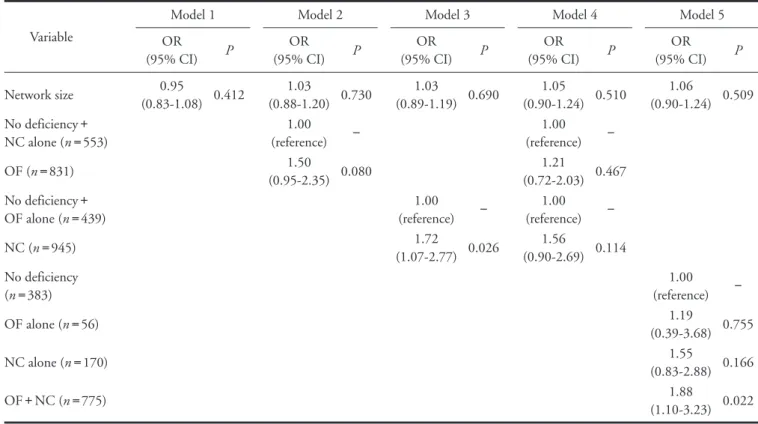
Table 3 shows the results of multiple logistic regression analyses for identifying whether each social network component was a determinant for CACS
>
400. The association between CACS and network size (odds ratio [OR], 0.95; 95% confidence interval [CI], 0.83 – 1.08; p
=0.412) or OF networks (OR, 1.50; 95% CI, 0.95 – 2.35; p
=0.080) was not statisti- cally significant at the 0.05 level; however, NC net- works had significant association with CACS
>400 when separately considered in model 3 (OR, 1.72;
95% CI, 1.07 – 2.77; p
=0.026). When including two types of deficiency in network betweenness together in model 4, both had p-values
>0.05. When examining three dummy variables (OF networks alone, NC net- works alone, and both OF and NC networks) in model 5, participants who had both OF and NC networks had significantly greater odds of CACS
>400 than those with no deficiency in network betweenness (OR, users were included in the higher CACS group. Con-
cerning socio-economic status, participants with higher CACS were less educated, not married, and living with fewer household members; however, household income and working status were significantly different across CACS categories with no consistent patterns. Con- cerning social network characteristics, participants with higher CACS had significantly smaller (p
<0.001) OF (p
<0.001) and NC (p
<0.001) networks.
Table 2 shows the association between deficiency of social network betweenness and other covariates.
Participants with OF or NC networks were more likely to be older and have diabetes, depression, higher SBP, higher total cholesterol, lower HDL-cholesterol, lower LDL-cholesterol, and higher fasting plasma glucose lev- els. eGFR was positively associated with OF networks, whereas current smokers were more likely to have NC networks. Concerning socio-economic status, deficiency in both types of social network betweenness was related to a lower level of education, lower household income, and not working status. Married participants were
Table 3. Multiple logistic regression analyses of coronary artery calcium score >400 (N=1384)
Variable
Model 1 Model 2 Model 3 Model 4 Model 5
OR
(95% CI) P OR
(95% CI) P OR
(95% CI) P OR
(95% CI) P OR
(95% CI) P
Network size 0.95
(0.83-1.08) 0.412 1.03
(0.88-1.20) 0.730 1.03
(0.89-1.19) 0.690 1.05
(0.90-1.24) 0.510 1.06
(0.90-1.24) 0.509 No deficiency+
NC alone (n=553)
1.00
(reference) −
1.00
(reference) −
OF (n=831) 1.50
(0.95-2.35) 0.080 1.21
(0.72-2.03) 0.467 No deficiency+
OF alone (n=439)
1.00
(reference) −
1.00
(reference) −
NC (n=945) 1.72
(1.07-2.77) 0.026 1.56
(0.90-2.69) 0.114 No deficiency
(n=383)
1.00
(reference) −
OF alone (n=56) 1.19
(0.39-3.68) 0.755
NC alone (n=170) 1.55
(0.83-2.88) 0.166
OF+NC (n=775) 1.88
(1.10-3.23) 0.022 All models were controlled for age, sex, smoking, hypertension, diabetes, ESRD, exercise, depression, statin use, BMI, SBP, LDL-cholesterol, glu- cose, eGFR, education, income, working, marriage, and number of co-habitants.
Model 1 evaluated the association of network size. Model 2 included network size and OF. No deficiency+NC alone was reference of OF. Model 3 included network size and NC. No deficiency+OF alone was a reference to NC. Model 4 included network size, OF, and NC. No deficiency+NC alone was a reference to OF. No deficiency+OF alone was a reference to NC. Model 5 used three dummy variables for social network betweenness (OF alone, NC alone, and OF+NC) comparing with “no deficiency” as reference.
OF, only-family networks; NC, no-cutpoint networks
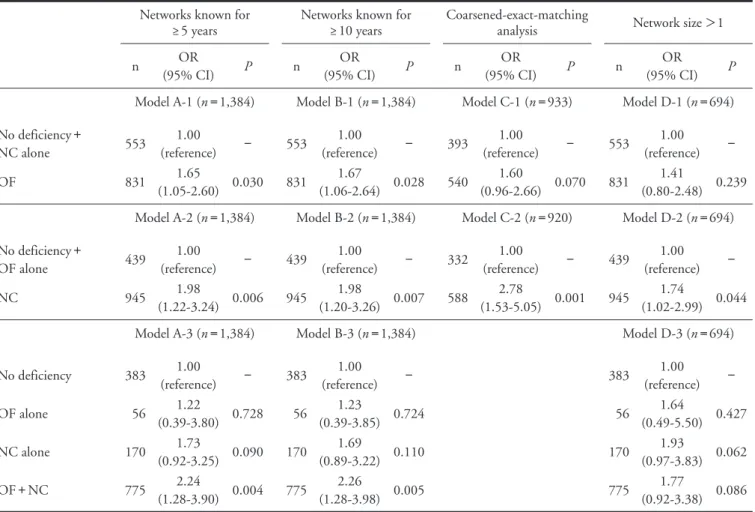
cant associations of OF networks (OR, 1.67; 95% CI, 1.06 – 2.64; p
=0.028), NC networks (OR, 1.98; 95%
CI, 1.20 – 3.26; p
=0.007), and both OF and NC net- works (OR, 2.26; 95% CI, 1.28 – 3.98; p
=0.005). Sec- ond, according to the CEM analyses in model C-1 to C-2, the p-value for OF networks reached
>0.05 (OR, 1.60; 95% CI, 0.96 – 2.66; p
=0.070), whereas NC networks (OR, 2.78; 95% CI, 1.53 – 5.05; p
=0.001) were significantly associated with CACS
>400. Lastly, in model D-1 to D-3 in which those with no or only one network member were excluded, OF networks (OR, 1.41; 95% CI, 0.80 – 2.48; p
=0.239) and both OF and NC networks (OR, 1.77; 95% CI, 0.92 – 3.38;
p
=0.086) did not show significant associations with CACS
>400, whereas NC networks (OR, 1.74; 95%
CI, 1.02 – 2.99; p
=0.044) were significantly associated 1.88; 95% CI, 1.10 – 3.23; p
=0.022). Even though
we did not find any evidence for the multiplicative association between OF and NC networks from the Wald test (
χ2=0.00, p
=0.98), we could observe that the ORs for those with both OF and NC networks was the largest among three types of deficiency in net- work betweenness.
The results of robustness checks are shown in Table 4. First, when considering social networks known for ≥5 years in model A-1 to A-3, OF networks (OR, 1.65; 95% CI, 1.05 – 2.60; p
=0.030), NC networks (OR, 1.98; 95% CI, 1.22 – 3.24; p
=0.006), and both OF and NC networks (OR, 2.24; 95% CI, 1.28 – 3.90; p
=0.004) showed significant associations with CACS
>400. When adopting the threshold of ≥10 years in model B-1 to B-3, we also observed signifi-
Table 4. Robustness checks for the multiple logistic regression analyses of coronary artery calcium score >400 Networks known for
≥5 years Networks known for
≥10 years Coarsened-exact-matching
analysis Network size >1
n OR
(95% CI) P n OR
(95% CI) P n OR
(95% CI) P n OR
(95% CI) P Model A-1 (n=1,384) Model B-1 (n=1,384) Model C-1 (n=933) Model D-1 (n=694) No deficiency+
NC alone 553 1.00
(reference) − 553 1.00
(reference) − 393 1.00
(reference) − 553 1.00
(reference) −
OF 831 1.65
(1.05-2.60) 0.030 831 1.67
(1.06-2.64) 0.028 540 1.60
(0.96-2.66) 0.070 831 1.41
(0.80-2.48) 0.239 Model A-2 (n=1,384) Model B-2 (n=1,384) Model C-2 (n=920) Model D-2 (n=694) No deficiency+
OF alone 439 1.00
(reference) − 439 1.00
(reference) − 332 1.00
(reference) − 439 1.00
(reference) −
NC 945 1.98
(1.22-3.24) 0.006 945 1.98
(1.20-3.26) 0.007 588 2.78
(1.53-5.05) 0.001 945 1.74
(1.02-2.99) 0.044
Model A-3 (n=1,384) Model B-3 (n=1,384) Model D-3 (n=694)
No deficiency 383 1.00
(reference) − 383 1.00
(reference) − 383 1.00
(reference) −
OF alone 56 1.22
(0.39-3.80) 0.728 56 1.23
(0.39-3.85) 0.724 56 1.64
(0.49-5.50) 0.427
NC alone 170 1.73
(0.92-3.25) 0.090 170 1.69
(0.89-3.22) 0.110 170 1.93
(0.97-3.83) 0.062
OF+NC 775 2.24
(1.28-3.90) 0.004 775 2.26
(1.28-3.98) 0.005 775 1.77
(0.92-3.38) 0.086 All models were controlled for age, sex, smoking, hypertension, diabetes, ESRD, exercise, depression, statin use, BMI, SBP, LDL-cholesterol, glu- cose, eGFR, education, income, working, marriage, and number of co-habitants.
Model As used 5 years and model Bs used 10 years as thresholds of network duration, respectively. In Model Cs using the coarsened-exact-matching method, observations were matched based on age, diabetes, depression, SBP, LDL-cholesterol, glucose, eGFR, education, income, working, and marriage. Continuous variables were coarsened into three groups, and categorical variables were adopted as original categories. Model Ds were logis- tic regressions which used subsamples with social network size >1.
OF, only-family networks; NC, no-cutpoint networks
In previous studies, the disadvantage of poor social networks was considered to parallel the deficiency in social support, which could directly cause the onset and progression of CVD
20), or have indirect effects through buffering the negative influence of acute stress
21)and depressive symptoms
22). In this study, more detailed properties of social networks were investigated by adopting the network structure of betweenness.
First, network betweenness captures the accessibility to diverse origins of social resources, which is a differ- ent aspect from the content or size of networks. For example, diverse networks more effectively provide medical information and first-hand experience about certain diseases, and are known to have special impor- tance for those with health problems
23). Considering that the sample of this study was at a high risk of CVD, the strong disadvantage for those without net- work betweenness is not surprising. Second, various sources represent the diversity in the activities they per- form with their network members. Network between- ness allows the potential to enjoy at least two different activities and thoughts, which affords a stronger sense of freedom and accomplishment than being confined to a narrow social space. Those benefits are reported to have more importance for the subjective well-being of the older population
5), as retirement status and little participation in organizational activities make them more dependent on selective interpersonal relationships
24). The strong correlation between network betweenness and depression, and the stronger associations of between- ness with the CACS older adults observed in this study are consistent with previous findings.
Among the two types of deficiency in social net- work, between and no-cutpoint networks had stronger and more robust associations with CACS than only- family networks. Even though these two had no sig- nificant associations with CACS at a level of 0.05 when included together in the same model due to a strong correlation between themselves (
χ2=599.24, p
<0.001), no-cutpoint networks were significantly associated with CACS in all models for robustness checks, whereas only-family networks showed little evidence of associations in the models using the CEM method and the subsample with two or more social networks. Considering that family members are the first sources of immediate support for people with health problems
25), the associations of only-family net- works could largely originate from the previous health status, which was partly proved in the results from the matching analyses. Furthermore, the results from the subsample with network size
>1 implicate that the disadvantage of only-family networks is not critical among those who have big networks, but mixed with the fundamental restriction of small network size. The with CACS
>400 in model D-2.
To examine the difference by age and sex, we re- assessed models 2 and 3 in Table 3 by using subsam- ples of age ≤60 years, age
>60 years, male, or female.
As seen in Fig. 2, there was no difference in the associ- ations of OF networks by age and sex. However, NC networks were more disadvantageous for older (OR, 2.64; 95% CI, 1.27 – 5.51; p
=0.009) and female (OR, 6.34; 95% CI, 2.02 – 19.96; p
=0.002) participants.
Discussion
The key findings from this study were as follows:
(i) social network betweenness was closely related with health and socio-economic status; (ii) no-cutpoint net- works, in which network members form a connected group even when excluding a respondent, were signifi- cantly associated with a higher risk of CACS
>400;
and (iii) the disadvantage of no-cutpoint networks was larger for older and female participants. While previ- ous studies have investigated whether biomarkers such as pulse wave velocity or inflammatory markers were associated with the presence of subclinical atheroscle- rosis
18, 19), the novelty of this study is that sociological factors may be closely related with subclinical athero- sclerosis, characterized by coronary artery calcification.
Fig. 2. ORs and 95% CIs for only-family networks and no- cutpoint network from multiple logistic regression anal- yses of coronary calcium score >400 in total partici- pants and subgroups. We predicted ORs for only-fam- ily networks or no-cutpoint networks after controlling for age, sex, smoking, hypertension, diabetes, ESRD, exercise, depression, statin use, BMI, SBP, LDL-cho- lesterol, glucose, eGFR, education, income, working, marriage, number of co-habitants, and network size.
capture variations in economic status. Future studies are required to collect more thorough data of eco- nomic and medical backgrounds for unbiased esti- mates of network effects on CVD. Fourth, this study assumed that CACS
>400 is a surrogate marker of CVD. Although higher CACS is closely correlated with having more other cardiovascular risk factors and CACS
>400 is known as a good predictor of future CVD in the western population, clinical implication of CACS
>400 needs to be further validated in the Asian population
27).
Conclusion
Participants who had higher coronary artery cal- cium score were likely to have a smaller network size and deficiencies in social network betweenness (only- family network, and no-cutpoint network). Especially, no-cutpoint networks had a significant and robust relationship with CACS
>400, a powerful surrogate marker of future CVD.
Funding
This research was supported by a grant from the Korea Health Technology R&D Project through the Korea Health Industry Development Institute funded by the Ministry of Health and Welfare, Republic of Korea (grant no. HI13C0715), and the National Research Foundation of Korea Grant funded by the Korean Government (NRF-2014S1A3A2044496).
Conflict of Interest
The authors have no conflict of interest to dis- close.
References
1) Valtorta NK, Kanaan M, Gilbody S, Ronzi S, and Han- ratty B: Loneliness and social isolation as risk factors for coronary heart disease and stroke: systematic review and meta-analysis of longitudinal observational studies. Heart, 2016; 102: 1009-1016
2) Barth J, Schneider S, and von Känel R: Lack of social sup- port in the etiology and the prognosis of coronary heart disease: a systematic review and meta-analysis. Psychoso- matic medicine, 2010; 72: 229-238
3) Berkman LF, Glass T, Brissette I, and Seeman TE: From social integration to health: Durkheim in the new millen- nium. Social Science & Medicine, 2000; 51: 843-857 4) Burt RS: Structural holes: the social structure of competi-
tion, Harvard University Press, Cambridge, MA, 1992 5) Cornwell B: Good health and the bridging of structural
holes. Social Networks, 2009; 31: 92-103
6) Janssen I, Powell LH, Jasielec MS, Matthews KA, Hollen-
robust results from the analyses of no-cutpoint net- works, on the other hand, show that they could be more strong indicators for CACS than only-family networks. Additionally, no-cutpoint networks were more accurate in detecting the bridging potential of participants, as these are based on direct information about the social network structure. Despite its impor- tance, there are few studies on the relationship between network betweenness and CVD because of the short- age of data about the details of network structure
3). While a recent study showed that older women are more likely to establish their social autonomy via social network betweenness
26), we observed a similar pattern that no-cutpoint networks were more unfavorable for the CACS of older and female participants. Cumula- tive findings from future studies on network structure and CVD may provide a clearer explanation about the sex difference in the associations of network between- ness.
This study has several limitations. First, owing to
the cross-sectional design, we do not know the causal-
ity of social network betweenness with the progression
of coronary artery calcium and/or the development of
cardiovascular disease. For addressing this issue, we re-
calculated network indices using only long-lasting social
networks and observed robust associations between
CACS and both types of deficiency in social network
betweenness. If we assume that the formation of long-
lasting social networks precedes the progression of
coronary artery calcification, the results possibly impli-
cate the causal effects of network betweenness. In
addition, we also found the significant associations of
no-cutpoint networks from the CEM analyses. How-
ever, these results cannot fully support our causal
inference since we do not have the accurate informa-
tion about the temporal order among variables, and
examined the outcome and covariates at the same time
point. As CMERC-HI is a prospective cohort study,
the prognostic implications of social network between-
ness in this cohort can be clarified in the future. Sec-
ond, as the study population comprised subjects with
a relatively high risk of developing CVD, the results of
this study are vulnerable to generalizability. Third, the
results showed that age and socio-economic status
were different according to CACS. Considering that
age and income had strong associations with both
social network betweenness and cardiovascular out-
come, we could expect that our estimates could be
biased from residual confounding. Even though we
controlled for age and income in all multiple regres-
sion models, 1) there could be some omitted informa-
tion such as medical access which might be limited to
those with younger age and higher income, and 2) our
indicators for income could be crude to sufficiently
Sexual Dysfunction: Implications of Partner Betweenness for Men. American journal of sociology, 2011; 117: 172- 208
18) Nagasawa SY, Ohkubo T, Masaki K, Barinas-Mitchell E, Miura K, Seto T, El-Saed A, Kadowaki T, Willcox BJ, Edmundowicz D, Kadota A, Evans RW, Kadowaki S, Fujiyoshi A, Hisamatsu T, Bertolet MH, Okamura T, Nakamura Y, Kuller LH, Ueshima H, and Sekikawa A:
Associations between Inflammatory Markers and Subclin- ical Atherosclerosis in Middle-aged White, Japanese- American and Japanese Men: The ERA-JUMP Study. J Atheroscler Thromb, 2015; 22: 590-598
19) Torii S, Arima H, Ohkubo T, Fujiyoshi A, Kadota A, Takashima N, Kadowaki S, Hisamatsu T, Saito Y, Miya- gawa N, Zaid M, Murakami Y, Abbott RD, Horie M, Miura K, and Ueshima H: Association between Pulse Wave Velocity and Coronary Artery Calcification in Japa- nese men. J Atheroscler Thromb, 2015; 22: 1266-1277 20) Rosengren A, Wilhelmsen L, and Orth-Gomér K: Coro-
nary disease in relation to social support and social class in Swedish men. European Heart Journal, 2004; 25:
56-63
21) Uchino BN, and Garvey TS: The availability of social support reduces cardiovascular reactivity to acute psycho- logical stress. Journal of Behavioral Medicine, 1997; 20:
15-27
22) Frasure-Smith N, Lespérance F, Gravel G, Masson A, Juneau M, Talajic M, and Bourassa MG: Social support, depression, and mortality during the first year after myo- cardial infarction. Circulation, 2000; 101: 1919-1924 23) Thoits PA: Mechanisms linking social ties and support to
physical and mental health. Journal of Health and Social Behavior, 2011; 52: 145-161
24) Fredrickson BL, and Carstensen LL: Choosing social part- ners: how old age and anticipated endings make people more selective. Psychology and Aging, 1990; 5: 335-347 25) Schulz R, and Quittner AL: Caregiving for children and
adults with chronic conditions: introduction to the special issue. Health Psychology, 1998; 17: 107
26) Cornwell B: Independence through social networks:
Bridging potential among older women and men. The Journals of Gerontology Series B: Psychological Sciences and Social Sciences, 2011; 66: 782-794
27) Zaid M, Fujiyoshi A, Kadota A, Abbott RD, and Miura K: Coronary Artery Calcium and Carotid Artery Intima Media Thickness and Plaque: Clinical Use in Need of Clarification. J Atheroscler Thromb, 2017; 24: 227-239 berg SM, Sutton-Tyrrell K, and Everson-Rose SA: Pro-
gression of coronary artery calcification in black and white women: do the stresses and rewards of multiple roles matter ? Annals of Behavioral Medicine, 2012; 43:
39-49
7) Smith TW, Uchino BN, Florsheim P, Berg CA, Butner J, Hawkins M, Henry NJ, Beveridge RM, Pearce G, and Hopkins PN: Affiliation and control during marital dis- agreement, history of divorce, and asymptomatic coronary artery calcification in older couples. Psychosomatic Medi- cine, 2011; 73: 350
8) Burt RS: Network items and the general social survey.
Social Networks, 1984; 6: 293-339
9) Kim J, Kim S, and Kim H: Korean General Social Survey 2003-2014, Sungkyunkwan University Press, Seoul, 2016 10) Youm Y, Laumann EO, Ferraro KF, Waite LJ, Kim HC,
Park Y-r, Chu SH, Joo W-t, and Lee JA: Social network properties and self-rated health in later life: comparisons from the Korean social life, health, and aging project and the national social life, health and aging project. BMC geriatrics, 2014; 14: 102
11) Wasserman S: Social network analysis: Methods and applications, Cambridge university press, 1994
12) Agatston AS, Janowitz WR, Hildner FJ, Zusmer NR, Viamonte M, and Detrano R: Quantification of coronary artery calcium using ultrafast computed tomography.
Journal of the American College of Cardiology, 1990; 15:
827-832
13) Nakazato R, Dey D, Gutstein A, Le Meunier L, Cheng VY, Pimentel R, Paz W, Hayes SW, Thomson LE, and Friedman JD: Coronary artery calcium scoring using a reduced tube voltage and radiation dose protocol with dual-source computed tomography. Journal of Cardiovas- cular Computed Tomography, 2009; 3: 394-400
14) Craig CL, Marshall AL, Sjöström M, Bauman AE, Booth ML, Ainsworth BE, Pratt M, Ekelund U, Yngve A, and Sallis JF: International physical activity questionnaire:
12-country reliability and validity. Medicine & Science in Sports & Exercise, 2003; 35: 1381-1395
15) Jo SA, Park MH, Jo I, Ryu SH, and Han C: Usefulness of Beck Depression Inventory (BDI) in the Korean elderly population. International Journal of Geriatric Psychiatry, 2007; 22: 218-223
16) Iacus SM, King G, and Porro G: Causal inference without balance checking: Coarsened exact matching. Political Analysis, 2012: 1-24
17) Cornwell B, and Laumann EO: Network Position and