Evaluating the Competitiveness of
Asian Construction Companies through Patent Analysis
1)Ji, Woojong1 Lee, Dongmin2 Lim, Hyunsu3 Pyo, Kiyoun4
Lee, Dongyoun1 Lee, Hak-Ju1 Park, Insung1 Kang, Kyung-In5*
Ph.D. candidate, School of Civil, Environmental and Architectural Engineering, Korea University, 145, Anam-ro, Seongbuk-gu, Seoul 02841, Korea1
Ph.D., Department of Civil and Environmental Engineering, University of Michigan, Ann Arbor, MI 48109, United States 2 Assistant Professor, Department of Architecture, Soonchunhyang University, 22 Soonchunhyang-ro, Shinchang-myeon, Asan-si,
Chungchengnam-do 31538, Korea 3
Master’s course, School of Civil, Environmental and Architectural Engineering, Korea University, 145, Anam-ro, Seongbuk-gu, Seoul 02841, Korea4
Professor, School of Civil, Environmental and Architectural Engineering, Korea University, 145, Anam-ro, Seongbuk-gu, Seoul 02841, Korea 5
Abstract
In evaluating the competitiveness of construction companies and their development strategies, patents are a useful and objective source of technical information. In this study, the cutting-edge technologies of construction industries of China, Japan, and South Korea were investigated based on the data of patent applications filed by a total of 15 construction companies (five companies from each country). The related technologies were classified into six core technology groups based on their keywords. After that, we used four patent analysis methods: time series analysis, IP (Intellectual Property) emergence level analysis, spiral module analysis, and OS (Object-Solution) Matrix analysis, to identify the promising technologies/vacant technologies for global construction companies in China, Japan, and South Korea, and to analyze the technical competitiveness of the three countries. The findings of this study showed that each country can claim a relative technological advantage over the others. Overall, 3D printing and offsite construction technology, data acquisition technology, AR and VR technology are expected to be promising in the Asian region. The present study contributes to the body of knowledge by expanding our understanding of technological innovation for the competitiveness of companies and the technology development strategies pursued by the construction industries of China, Japan, and South Korea.
Keywords : construction technology, patent analysis, technological competiveness, technology trend analysis, technology forecasting
1. Introduction
In the fiercely competitive global construction bidding environment, the competitiveness of construction companies is becoming more and more important[1]. Competitiveness in the construction
Received : December 12, 2019 Revision received : March 10, 2020 Accepted : March 17, 2020
* Corresponding author: Kang, Kyung-In
[Tel: 82-2-921-5920, E-mail: [email protected]]
ⓒ2020 The Korea Institute of Building Construction, All rights reserved.
field means having better abilities and capabilities than one’s competitors, enabling a company to construct a building either with a better quality or at a lower cost. It involves two factors: one is the results a company has achieved in the past, and the other is its potential capacity[1]. A company’s competitiveness is highly likely to influence the development strategies it pursues in the future. Taking the aforementioned factors into consideration, it is a pressing and vital task to conduct an objective diagnosis of the current
technological competitiveness of construction companies, and to suggest a direction to move forward based on such diagnosis.
One of the indicators of a company’s technological competitiveness is the intellectual property rights that it holds. For this reason, an analysis of patents is an important way of evaluating and understanding the technology and competitiveness of a company. Patent analysis has been used as an indicator of technology innovation and the ability of a company to establish a future strategy [2-4].
In particular, Cho. et al.[5] show that a patent analysis can provide implications in terms of evaluation of a company's competitiveness. With this in mind, this study attempted to perform quantitative and qualitative analyses on patents for the assessment of patent-holding companies. For this research, we selected a total of 15 companies from three countries (five from Korea, five from China and five from Japan) based on ENR (Engineering News-Record). In selecting the companies, we considered revenue to evaluate the competitiveness of companies based on their patents.
Through an analysis of 15 patent-holding companies from the three Asian countries studied, we attempted to predict the future development prospect of the Asian countries, and provide an innovation strategy for each country.
It is expected that at a global level, the findings of the patent analysis performed in this study can be utilized by construction companies that seek to prepare a strategy for technological development and to improve their competitiveness in preparation for global competition.
Also, at the national level, they can be reflected in the establishment of government policy or R&D strategies.
2. Literature review
2.1 Previous studies evaluating the competitiveness ofcompanies
The concept of competitiveness is much broader
than performance or efficiency. The competitiveness of a company means it has better abilities and capabilities than its competitors, which implies that the company has both achieved more than its competitors and has a brighter future potential[1].
When we consider that a company has competitiveness in the construction industry, the company is highly likely to win a bid or get more construction orders compared to its competitors. This is highly related to a company’s technological innovation. Innovation may increase the company’s social reputation and financial benefits, through reducing the cost of constructing a building. Innovations also improve the technical feasibility of construction projects that would otherwise appear to facetechnical barriers[6].
This study evaluated the competitiveness of companies by analyzing their patents and suggested the direction of R&D for the future and a strategy for technological development. Various previous studies have evaluated the competitiveness of the construction companies using different methodologies. Competitive positioning and performance assessment[7-8], system dynamics model for competitiveness[9], sustainability performance and competitiveness[10], critical aspects of corporate strategy[11], and application of competitive intelligence techniques[8] have been pursued in recent years.
However, research is needed to analyze the competitiveness of a company in terms of its technological aspects, mainly based on its technical patents, since a construction project is dependent on the newest technologies the company holds.
Recently, a technical outlook through a patent analysis has been presented. Construction technology research development, a patent analysis for forecasting promising technology[5], a patent map analysis of precast concrete[12], and a patent analysis of construction inventions based on TRIZ[13] are among the examples. These studies have demonstrated that a patent analysis is useful in identifying future promising technology. However, they mostly focused
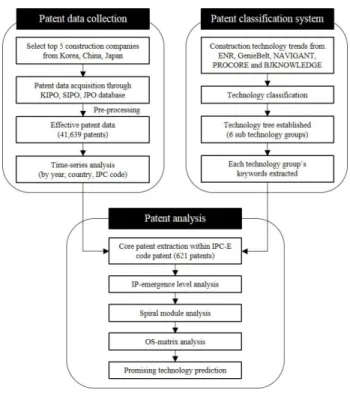
Figure 1. Research methodology
Korea Japan China Total
Raw data 5,795 51,555 2,348 59,698
Pre-processing 3,893 35,543 2,203 41,639
IPC-A 179 1,264 14 1,457
IPC-B 514 3,426 329 4,269
IPC-C 535 1,165 79 1,779
IPC-D 22 17 0 39
IPC-E 1,596 23,424 1,407 26,427
IPC-F 438 2,464 108 3,010
IPC-G 438 2,988 198 3,624
IPC-H 171 794 68 1,033
Table 2. Results of patent data pre-processing
on quantitative and subjective approach, and in this study, a more detailed trend analysis was performed using both qualitative and quantitative methods.
3. Patent Analysis
3.1 Data Acquisition & Pre-processing
To select representative global construction companies from South Korea, China, and Japan, we use the ranking list of "2015 ENR Top 250 International Contractors." Among the companies from the three countries on the list, we screened out the companies by researching the total number of patent applications each company has made within the region. Finally, five global construction companies were selected from each country to represent China, Japan, and South Korea, respectively. Data on the patent applications filed by the 15 construction companies were collected.
Data on patents published and registered by the companies from 1980 to 2016 were also collected. The patent data were collected through databases of KIPO, JPO, and SIPO as each country's patent authority.
Tables 1 and 2 show the searched database and search range as well as the results of the valid data pre-processing by eliminating redundant data and noise patentsin each IPC section.
Class. Details
Patent database KIPO, JPO, SIPO
Search period January 1, 1980 - June 30, 2016
Search domain
Patent applications of 15 construction companies, consisting of five companies each
from Japan, China, and South Korea
Search range Title, Abstract, Claim, IPC Code Table 1. Searched DB and search range.
3.2 Patent analysis methodology
The study is organized as follows, and Figure 1 provides a flowchart of this research. First, we collected patent data of the 15 companies(5 from each selected country). The patent data were collected through each country’s patent authority database and then pre-processed. Next, time series analysis of the effective (pre-processed) patent data by year, country, and IPC code was performed. Following this, a technology tree of recent construction technology was created to cluster core patent data by classified group.
The patent data analyzed were limited to those applied and registered from 2011-2016, and the patent search section was also limited to IPC-E (fixed structure
and construction technology related patents) to analyze the latest construction technology trends. Then,the patent trend and technology maturity were analyzed at a three-year interval through IP (Intellectual Property) emergence level analysis, and spiral module analysis was used to investigate quantitative patent trend distribution.
Next, the patent trend by core and vacant technologies was analyzed through OS (Object- Solution) matrix analysis at a two-year interval to provide a technology development strategy that would improve the competitiveness of each country’s construction companies. Lastly, we discussed future construction technology and R&D strategies for Asian countries based on our analysis results.
3.3 Analysis of patent application of nation-company and IPC code-nation by year
3.3.1 Nation-Year
Figure 2 shows the overall patent application trend of the 15 global construction companies studied.
Among the South Korean companies, patent applications peaked in 2012 (301 cases). For the companies in China, patent applications peaked in 2014 (559 cases) while for the Japanese companies they peaked in 1992 (2,970 cases). Japan outpaced both China and South Korea by a wide margin. In the comparison of the patent application trends of the companies in the three countries, the South Korean companies showed a gradual increase from 1990 to 2012, while the Japanese companies showed a gradual decrease after dramatic growth between 1990 and 1992 during the economic bubble period. China showed dramatic growth in patent applications from the mid-2000s.
3.3.2 IPC Code by year
The International Patent Classification (IPC) divides patents into eight distinctive technology sections and
Figure 2. Nation-Year data of overall patent application trends of 15 global construction companies.
gives a classification code to each section, as shown in Table 3. The purpose of this is to promote technology development through the systematic classification, search, distribution, and management of a vast set of patents in order to allow for efficient searching and management. As of January 2014, the IPC consists of 8 sections, 129 classes, 638 subclasses, and 7,391 main groups, and 64,046 subgroups [14].
IPC Code Classification
IPC-A Daily necessities, agriculture IPC-B Performing operations: transporting
IPC-C Chemistry, metallurgy
IPC-D Textiles, paper
IPC-E Fixed structure, construction
IPC-F Mechanical engineering; lighting; heating; weapons;
blasting
IPC-G Physics
IPC-H Electricity
Table 3. IPC's patent classification system
Since all patent literature around the world is classified according to the IPC, it is easy to analyze patent literature and information collected from the patent authorities in China, Japan, and South Korea based on this uniform technology classification system. IPC divides patents into eight discrete sections: A (daily necessities, agriculture), B (performing operations:
Figure 3. South Korea’s patent trends from 1985 to 2016.
Figure 4. China’s patent trends from 1985 to 2016.
Figure 5. Japan’s patent trends from 1985 to 2016.
transporting), C (chemistry, metallurgy), D (textiles, paper), E (fixed structures, construction), F (mechanical engineering, lighting), G (physics), and H (electricity). Figures. 3~5 illustrate the patent application trend by country from 1985 to 2016 subdivided into eight sections of the IPC. In comparison with the companies from Japan, the
Chinese and South Korean companies showed far lower numbers of patent applications.
For this reason, a scale calibration of the number of applications by country was performed so that visibility could be improved to enable us to observe the trend of each section of the IPC. According to the results of a categorization of 83,278 preprocessed patent cases into eight IPC sections on a chronological basis, the overall patent application trend and the IPC-E section's patent application trend tended to be proportional to each other. Furthermore, construction companies of the three countries all showed an overwhelmingly higher number of patent applications in the IPC-E section (construction including buildings, roads, and railways), which implies that these categories are the core technology section related to the construction field. Therefore, in the following chapter, a tech-tree was established for the IPC-E section, and core technologies were extracted to perform more qualitative patent analysis.
3.4 Tech-tree Organization
The establishment of a qualitative patent classification system through the creation of a technology tree system was preceded by quantitative and qualitative evaluation and analysis of patents held by construction companies of each country. First, we collected construction technology trend data analyzed by research institutes specialized in construction technology trends, including ENR, GenieBelt, NAVIGANT, PROCORE and BJKNOWLEDGE, and derived core construction technology categories by section. We created a technology tree, as shown in Table 4, based on consultations with eight experts who had more than 10 years of experience as field-site managers. The importance and frequency of these keywords that were mined within the category concerned were also considered.
The constructed technology classification system consisted of three levels. The first category is
'construction technology'. The second category consists of a total of 6 sub-technologies: Data Acquisition and Visualization (A), Virtual Reality and Augmented Reality (B), 3D Printing and Offsite Construction Technology (C), Wearable Device and Mobile Device Technology (D), Knowledge Technology (E), and Robotics and Knowledge-based System Technology (F). The third category consists of keywords related to each category. After that, out of all the patent applications we extracted each company's core patents which fall into the above technology classification system, and classified them accordingly. Based on the extraction and classification, we carried out an IP emergence level analysis, a spiral module analysis, and an OS-Matrix analysis.
1st category 2rd category Main Keywords
Construction technology
Data acquisition &
visualization (A)
Data, monitoring, sensor, image, scan, acquisition,
visualization Virtual reality &
augmented reality(B)
Augmented, virtual, camera, reality, simulation 3D printing and
offsite construction technology (C)
Print, prefab, modular, prefabricated, lean Wearable device &
mobile device technology (D)
Wearable, suit, mobile, watch, smart, tablet, reminder, safety, vest
Internet of things technology (E)
Track, health, tracking, NFC, GPS, Wi-Fi, Bluetooth, communication,
ubiquitous, Beacon transmission, RFID Robotics and
knowledge-based system Technology(F)
robot, automation, automatic-, integration,
equipment, self- Table 4. Tech-tree for patent analysis.
3.5 Patent analysis
A patent analysis was performed based on the tech-tree shown in Section 3.3 for patents held by 15 construction companies from China, Japan, and South Korea. To perform the analysis, we limited the search range to those that belonged to IPC-E (fixed structure, construction) section and the time scope to a period
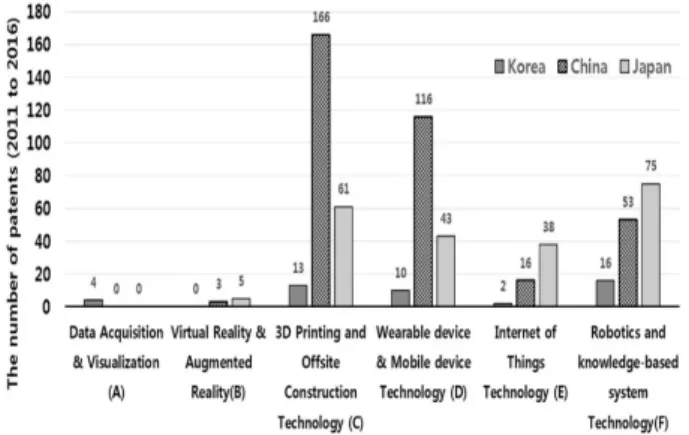
Figure 6. Results of extraction and classification of core patents by country from 2011 to 2016
from 2011 to 2016 to analyze the latest R&D trends.
This analysis was performed through the following steps. First, text mining was performed for pre-processed valid patents of the IPC-E section to extract core patents corresponding to the technology tree from title, abstract, main body, and claims. Based on the above technology tree, classification was then carried out and shown in Figure 6. To investigate detailed changes and trends of each period, we divided those patent data classified through IP emergence level analysis and spiral module analysis into two three-year periods: 2011-2013 versus 2014-2016.
Based on the core categories, we analyzed the overall patent application increase rate of three countries; the respective patent application increase rate of China, Japan, and South Korea; and each tech segment's patent increasing or decreasing trend, application market share, and technology concentration by country. Lastly, an OS matrix analysis in chronological order was performed by dividing the patent classification period from 2011 and 2016 into two-year periods to derive vacant and promising technology fields.
3.5.1 IP emergence level analysis
We analyzed emerging technology fields based on
Figure 7. Trends in core patents by country at three-year interval.
Figure 8. Promising IP emergence level of 15 construction companies in China, Japan, and South Korea.
the absolute increase in the number of patents and relative increase rates through an IP emergence level analysis, and the quantitative growth pattern of core patents of each section at a three-year interval (Figure 7). It was found from the extracted patent data that there were a total of 621 core patents registered by the 15 companies between 2011 and 2016. Comparing the total number of core patents between the two periods, the patent applications grew to 366 cases or 43.5% (2014~2015) from 255 cases (2011~2013).
To be more specific, a dramatic increase in patent applications by Chinese companies was shown, which was about 193.3% higher in the second period compared to the first period (90 cases to 264 cases).
This means that China is at the forefront of construction technology development among the three countries (China, Japan, and South Korea). In the meantime, the five Japanese construction companies showed a 44.8% decline compared to the first period.
The five South Korean companies had the smallest number of patent applications among the three Asian countries (22 cases in total, or 7% of the number of Chinese and Japanese companies’patents combined).
Also, South Korean companies showed the lowest increase in patent applications in the second period compared to the first period (22 cases → 23 cases).
Figure 8 shows the results of an IP emergence level analysis by category of all the 15 construction companies from Korea, China, and Japan during two 3-year periods from 2011 to 2016. According to the analysis results, a slight increase was shown in acquisition and visualization, virtual reality and augmented reality, and Internet of things in the second period (2014-2016) compared to the first three-year period (2011-2013).
On the other hand, an approximately 20% decline was shown in robotics knowledge-based system technology in the second period compared to the first period (80 cases→64 cases). However, a nearly 120% increase in 3D printing and offsite construction technology was shown in the second period (75 cases→165 cases). A 56.1% increase in wearable and mobile device technology was revealed in the following period (66 cases→103 cases).
The abovementioned technologies – offsite construction technology, and wearable and mobile device technology – seemed to attract a higher level of attention.
It is believed that these technology fields have the greatest potential for applicability to the building construction field and for technological development.
3.5.2 Spiral module analysis (technology concentration analysis by country) at three-year intervals We analyzed the technology concentration trend by field in the patent registration of each country through
a spiral analysis to segment and visualize core patents by country. Figure 9 shows the schematized classification results of all the core patents that the top 15 construction companies held in each of the three-year periods. These spiral modules underwent calibration for each country for effective visualization.
In Figure 9, the combined number of patents held by the top 15 construct companies in the fields of data acquisition and visualization technology, virtual and augmented reality was less than 10 cases in both the three-year periods. The number of patents was comparatively fewer than that in other technological categories. In the field of 3D printing and offsite construction technology, the total number of patent applications from all three countries showed a dramatic increase, from 75 cases to 165 cases. This implies that this category would be a technological field with considerable potential as a core patent field. Yet both IoT technology and robotics and knowledge -based technology showed steady growth. Korea's top five construction companies showed a relatively lower quantitative performance in terms of patent applications in core patent fields compared to the Chinese and Japanese companies. Yet it can be confirmed that the companies steadily concentrated their competence on 3D printing and offsite construction technology and robotics and knowledge- based technology, both in the first and the second three-year periods. The Chinese companies showed a whopping growth of 315% in these technological fields between the first period and the second period. In particular, the number of patents in prefabrication and modular construction in 3D printing and offsite construction technology showed a sharp increase, from 33 cases to 153 cases, representing the highest technology concentration. Besides, there were only three patent applications in IoT technology in the first three-year period, but this was increased to 13 cases (almost four times) in the second three-year period. Also, the number of patent applications in wearable device
a) 3 Countries total
b) China
c) South Korea
d) Japan
Figure 9. Spiral module of 15 construction companies
and mobile device technology, robotics, and knowledge-based technology was doubled. However, there was no patent application in data acquisition or
a) China
b) South Korea
c) Japan
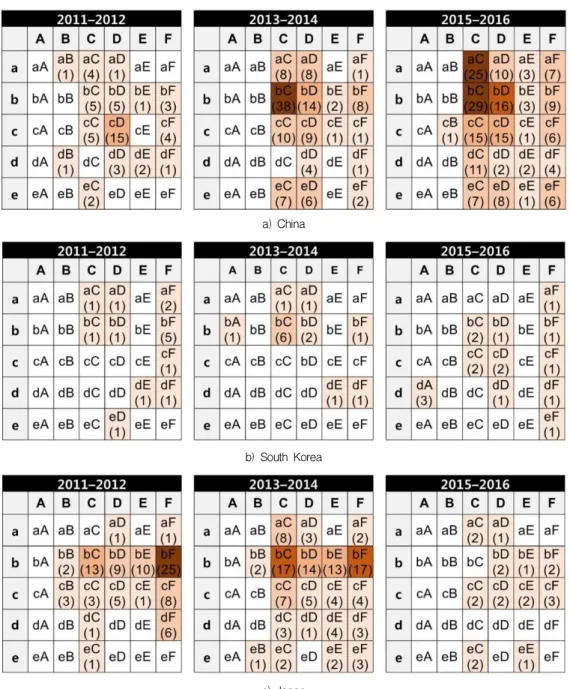
Figure 10. OS-matrix of three countries
visualization technology, although virtual and augmented reality technology showed modest performance compared to the first period, indicating that technological concentration was very low. Among the Japanese companies, robotics and knowledge-based technology showed the highest technology concentration in the first period, while data acquisition and visualization and virtual/augmented reality technology continued to show weak performance in the second period. The technology
development trend of the second period showed a reduction throughout all construction technology categories compared to the first three-year period. In particular, looking at the increases and decreases in the absolute number of patent applications, the most dramatic change was shown in robotics and knowledge-based technology. These technological fields saw the highest concentration in the first three-year period, but this was decreased by over 50 percent, from
56 to 19 cases. Although other technology fields also showed a declining trend, they continued to have a certain number of patent applications, which implies that companies have a constant interest in the technological fields.
3.5.3 OS-matrix based Promising vacant technology The OS matrix analysis technique is a patent analysis technique that can visualize vacant and core technology trends and distributions by dividing the object and solution for each core patent and placing them on the matrix. In this analysis, the OS matrix of core patents extracted from each country from 2011 to 2016 was created at a two-year interval to analyze the research development direction and technological development rate. The core patents obtained were categorized at a two-year interval into two categories:
object and solution. They were arranged and schematized on a two-dimensional matrix, as shown in Figure 10.
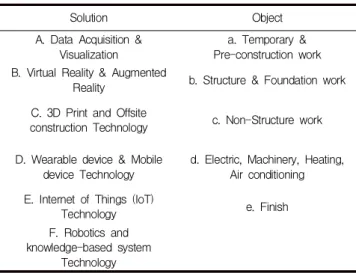
The object and solution categories in Table 5 were derived through a literature review and consultation with a group of 10 experts working as on-site managers.
Solution Object
A. Data Acquisition &
Visualization
a. Temporary &
Pre-construction work B. Virtual Reality & Augmented
Reality b. Structure & Foundation work C. 3D Print and Offsite
construction Technology c. Non-Structure work
D. Wearable device & Mobile device Technology
d. Electric, Machinery, Heating, Air conditioning E. Internet of Things (IoT)
Technology e. Finish
F. Robotics and knowledge-based system
Technology
Table 5. Classification table of object & solution
The matrix consists of a horizontal axis showing the solutions to a task related to the core categories in the technology tree above, and a vertical axis showing
the objects categorized in five construction phases: a, Temporary and Pre-construction work; b, Structure and Foundation work; c, Non-Structure work; d, Electric, Machinery, Heating, Air conditioning; and e, Finish.
3.5.4 OS matrix analysis
For the analysis, the 6-year period was divided into three sub-periods: 2011-2012, 2013-2014, and 2015-2016. The findings of time-series OS-Matrix analysis are shown as below. In the matrix of each country, each cell, an intersection of the 'Object' row and the 'Solution' column, indicates the number of patent applications corresponding to one of the core technologies that fall under one of the five construction phases.
The number of patent applications under Structure and Foundation work (bA, bB, bC, bD, bE, bF) was estimated to be 21 cases for South Korea, 133 cases for China, and 127 cases for Japan. As the number of patents in this technological field accounted for 45.2% of a total of 621 core patents, it could be interpreted that the companies have a keen interest in the solution providing field. Notably, the number of patents utilizing 3D printing and offsite construction technology (bC) was 111 cases or 39.5% of the Structure and Foundation work, which implies that this technology field is promising for the future. In terms of vacant technology fields, patents in the OS-Matrix axis related to data acquisition technology and AR and VR technology that the 15 Asian companies hold were minimal throughout all construction phases except for the 2015-2016 period. Thus, they are considered as vacant and also promising technology fields, which implies that it is urgent to secure technological competitiveness in these fields through patent application and technology development. Unlike the traditional manufacturing industry, most construction work is performed manually, by people, outdoors in a physically harsh environment, making the sensing, acquisition, and processing of data relatively more
difficult. Because of these characteristics of the construction industry, the top 15 construction companies in the Asian countries have not paid attention to applying the concept of big data collection and handling to construction field sites. It can be predicted that they need to secure competitiveness in the construction industry through affiliation with other industrial sectors and investment in convergence research and development in the future.
Korean construction companies showed a scant number of patent applications throughout all periods, indicating that they were in an initial stage of technology development in each field. When examining them by period, the number of patent applications remained very minimal, ranging from one case to a maximum of 6 cases throughout the entire period from 2011 to 2016. From the analysis of the 2011-2012 period and the 2015-2016 period, the maximum number of patent applications in robotics and knowledge-based system technology made by South Korean companies was only five related to the all the five construction phases.
In contrast, the Chinese and Japanese construction companies belonged to a leading group with a high level of technology index. They showed a remarkably rapid growth from 2013 to 2016 in terms of both the quantitative and qualitative sides of technology competence. Both China and Japan showed an increasing trend throughout all construction phases in the structure and foundation work field utilizing 3D printing and offsite construction technology. Given this, it can be predicted that technology development will be actively carried out in this field, and there will be a steady number of patent applications, and more advanced patent applications.
In particular, China, which had the highest number of patent applications among these three Asian countries, had an overwhelmingly high number of patent applications and a growth trend in 3D printing and offsite construction technology. In addition, China
showed a steady increase in both temporary and pre-construction work utilizing 3D printing and offsite construction technology, and in temporary and pre-construction work using wearable and mobile device technology.
This indicates that, as China’s construction technology further develops, its utilization and application at construction sites is increasing. If we look at the details of related patent applications, 3D printing and offsite construction technologies such as cartridged concrete, wood, metal powder are also being developed.
In addition, Chinese companies are attempting to develop improved construction technology using 3D printing technology to apply to building construction, construction materials, and construction machinery manufacturing, to name a few. It will be worth paying attention to China's future construction technology growth and competitiveness in these fields.
4. Discussion
If we can predict future technology competence based on the number of patent applications, it is evident that China is in one of the outstanding technology leading groups that are at the forefront of construction technology development, while Japan and South Korea are following suit. South Korean global construction companies belong to a latecomer group, given that they lagged slightly behind Japanese and Chinese global construction companies in terms of the level and development speed of construction technology. The number of patents applied for by the top five South Korean construction companies is remarkably fewer than those of Japan and China. As such, more active efforts for technology development and research and development activities are required to help Korean construction companies to catch up with and possibly overtake Japanese and Chinese construction companies.
However, the top five South Korean companies
showed a steady increase in their overall number of patent applications, reflecting the fact that technology development and research and development activities have been carried out in the construction field on a gradual basis. Therefore, the construction companies should collaborate with the technology companies to foster construction technology and construction management technology converged with cutting-edge future technology, including a total management and control system for construction sites through a smart home service and smartphones. This can be realized through IoT technology, mobile device technology, and advanced IT infrastructures, which are known to have great potential in the future. Also, as 3D printing technology is becoming more sophisticated and attracting more attention, the country is now expanding this technology into a variety of fields of industry. For this reason, the government needs to provide active support and make an investment to help South Korean construction companies become one of the technology leading groups by continuing to actively develop source technologies in 3D printing and offsite construction.
Japan, which led quantitative growth among the three Asian countries until the early 1990s, showed a declining trend after 1992. This was because while Japan achieved phenomenal growth in the bubble economy of 1990, the economic recession that began in 1992 led to a decrease in construction investment.
Since then, the annual number of patent applications filed with the Japanese patent authority has been decreasing. Patents held by Japanese construction companies in the technology field were shifting from quantitative growth to qualitative growth. This is because due to government policy, Japanese construction companies have strengthened their screening system to exclude as many patents that are unlikely to get registered as possible.
As the same time, Japanese construction companies have had a steady interest in 3D printing and offsite
construction technology, wearable and mobile device technology, and IoT technology. This seems to be closely related to the direction of Japan's construction industry policies. Since 2016, the Ministry of Land, Infrastructure, Transport and Tourism of Japan has been actively fostering i-Construction to utilize ICT in the measurement, construction, and test fields in order to prepare for the fourth industrial revolution and improve productivity at construction sites. It is now pursuing productivity improvements and technology advancement in the construction industry by establishing its own data platform that allows construction companies to share vast amounts of data. As such, Japanese construction companies seem to be able to maintain highly advanced technology competitiveness through the synergy created by a combination of the technology competence and technology innovation of the Japanese construction industry.
China has emerged as one of the technology leading countries, and has recently shown the most remarkable qualitative and quantitative growth. Primarily, it showed a rapid increase in the number of patent applications and seemed to be the most actively involved in research and development activities from 2014 to 2016. It is expected to achieve innovation in the construction industry's production methods by leading technology competitiveness in pre-fabrication technology in the construction and civil engineering technology fields, mainly based on quantitative and qualitative technology growth in 3D printing and offsite construction technology.
This rise of China is boosted by its technology competence in the next-generation construction field, its price competitiveness in the order market, its government's active support for overseas expansion, and its vast and robust domestic construction market.
For this reason, it is worth paying attention to the Chinese construction industry's competitiveness and potential.
5. Conclusion
This study carried out a quantitative and qualitative analysis of each country's construction industry competitiveness based on patent applications filed by 15 construction companies (top five companies from each of Korea, China, and Japan). The research scope was limited to the patent applications filed with KIPO, SIPO, and JPO from 1980 to 2016, and the status of construction technology of each country. The technology classification system of core construction technologies was established through a literature review and keyword text mining. Technologies with IPC-E code, a construction industry patent field, were extracted and classified. After that, qualitative and quantitative analyses were carried out by measuring IP emergence levels of extracted core patents and spiral module and OS matrix analysis.
The analysis found the Japanese companies led the building markets until 1990s but are in a period of decline; in Korea and China, they are in a growth period. In particular, China showed a rapid increase in the number of patent applications, with the most related patents among the main markets. Because of China’s overwhelming growth rate in terms of the number of applications, Japan and Korea were thought to be more advantageous in securing their competitiveness by further developing the technology fields specialized in by each country. For example, Korea has an excellent IoT and IT infrastructure.
Therefore, site management and control systems through smart home service and smartphones will have good potential competitiveness compared to the other two countries.
On the other hand, Japanese construction companies should leverage their strengths in 3D printing and offsite construction technology, since their flexible policies and long history of research into 3D and offsite construction could provide a specialty and vast amount of data.
The OS-matrix analysis identified the following three fields as vacant: construction efficiency enhancement using monitoring technology, safety management using information modeling technology, and energy reduction at the construction phase using monitoring and information modeling technology. As such, these technological fields could present an opportunity for the Asian countries.
The findings of this research will provide a direction for building construction technology investment, and objective data for decision making by governments or global construction countries.
The limitations of this study are as follows. First, it had a limited data analysis range. Of all the patent applications, this study only chose the patent applications that belonged to the IPC-E section (fixed structure, construction) as subjects for quantitative and qualitative analyses. It showed 63.5% or 26,427 cases out of a total of 41,639 patent applications of the 15 selected construction companies from South Korea, China, and Japan. As such, it can be said that the IPC-E section is representative of the technology competitiveness of construction companies. However, it does not correctly reflect the characteristics of modern technology development, in which there are a variety of convergences with technology fields of other industries such as IT, electricity, and communication. Second, since this study could not receive data on citation index and impact factor of patent literature of the three countries from each country's patent authorities, it was not possible to carry out a quantitative analysis on inter-country technology innovation activities based on the technology impact and technological importance of the patents. Therefore, follow-up studies that address the abovementioned limitations should be carried out in the future.
Funding
This research was supported by a grant (20AUDP
B106327-06) from Architecture & Urban Development Research Program funded by Ministry of Land, Infrastructure and Transport of Korean Government.
ORCID
Woojong Ji, http://orcid/0000-0002-1499-1955 Dongmin Lee, https://orcid.org/0000-0002-3176-5327 Hyunsu Lim, https://orcid.org/0000-0002-3364-5118 Kiyoun Pyo, https://orcid.org/0000-0002-8086-2465 Dongyoun Lee, http://orcid/0000-0003-1929-3563 Hak-Ju Lee, http://orcid/0000-0001-6884-1111 Insung Park, http://orcid/0000-0002-5798-8457 Kyung-In Kang, https://orcid.org/0000-0003-4117-2039
References
1. Orozco F, Serpell A, Molenaar K. Competitiveness factors and indexes for construction companies: findings of Chile Revista de la construcción. 2011 Apr;10(1):91-107. https://doi.org/10.
4067/S0718-915X2011000100009
2. Kim JE, Lee SJ. Patent databases for innovation studies: A comparative analysis of USPTO, EPO, JPO and KIPO.
Technological Forecasting and Social Change. 2015 Mar;92:332 –45. https://doi.org/10.1016/j.techfore.2015.01.009
3. Lei XP, Zheng J, Gui J, Xiong JH. Research on the relative compet itiveness of companies based on patent analysis. Proceeding of 2010 International Conference on Management and Service Sci ence; 2010 Aug 24-26; Wuhan, China. Wuhan(China): IEEE; 201 0. p. 1–4. https://doi.org/10.1109/ICMSS.2010.5576221 4. Feng X, Fuhai, L. Patent text mining and informetric-based pate
nt technology morphological analysis: an empirical study. Tech nology Analysis & Strategic Management. 2012 Apr;24(5):467–7 9. https://doi.org/10.1080/09537325.2012.674669
5. Cho HP, Lim HS, Lee DM, Cho HH, Kang KI. Patent analysis for forecasting promising technology in high-rise building constru ction. Technological Forecasting and Social Change. 2018 Mar;
128:144–53. https://doi.org/ 10.1016/j.techfore.2017.11.012 6. Slaughter ES. Models of construction innovation. Journal of Cons
truction Engineering and Management. 1998 May;124(3):226–3 1. https://doi.org/10.1061/(ASCE)0733-9364(1998)124:3(226) 7. Horta IM, Camanho AS. Competitive positioning and performa
nce assessment in the construction industry. Expert Systems wit h Applications. 2014 Mar;41(4):974–83. https://doi.org/10.101 6/j.eswa.2013.06.064
8. Safa M, Shahi A, Haas CT, Fiander-McCann D, Safa M, Hipel K, MacGillivray S. Competitive intelligence (CI) for evaluation of
construction contractors. Automation in Construction. 2015 Nov;59:149–57. https://doi.org/10.1016/j.autcon.2015.02.00 9. Gilkinson, N., and Dangerfield, B. Some results from a system dynamics model of construction sector competitiveness.
Mathematical and Computer Modelling. 2013 May;57(9–10):
2032–2043. https://doi.org/10.1016/j.mcm.2011.09.011 9. Tan Y, Ochoa JJ, Langston C, Shen L. An empirical study on the
relationship between sustainability performance and business competitiveness of international construction contractors. Jour nal of Cleaner Production. 2015 Apr;93:273–8. https://doi.org/
10.1016/j.jclepro.2015.01.034
10. Pícha J, Kovář P, Kessler F, Tomek A. Key aspects of corporate strategy in international construction. Procedia Engineering. 20 17;196:506–11. https://doi.org/10.1016/j.proeng.2017.07.231 11. Yu WD, Cheng ST, Shie YL, Lo SS. Benchmarking technological
competitiveness of precast construction through patent map analysis. Proceedings of International Symposium on Automation and Robotics in Construction 2006; 2006 Oct 03-05; Tokyo, Japan. Tokyo (Japan): Waseda University; 2006.
p. 3-5. https://doi.org/10.22260/ISARC2006/0025
12. Cheng ST, Yu WD, Wu CM, Chiu RS. Analysis of construction inv entive patents based on TRIZ. Proceedings of International Sym posium on Automation and Robotics in Construction 2006; 200 6 Oct 03-05; Tokyo, Japan. Tokyo (Japan): Waseda University;
2006. p. 3-5. https://doi.org/10.22260/ISARC2006/0028 13. World Intellectual Property Organization. International Patent
Classification (IPC) - IT support area - Edition 20140101 – Statistics. WIPO- World Intellectual Property Organization.
[updated 2014 Jan 01; cited 2019 Oct 11]. Available from:
https://www.wipo.int/classifications/ipc/en/ITsupport/Versi on20140101/transformations/stats.html