1)
* 정회원, 영산대학교 건축학부 전임강사, 공학박사
** 정회원, 한국원자력안전기술원 선임연구원, 공학박사
2)
E-mail : [email protected]
•본 논문에 대한 토의를 2003년 9월 30일까지 학회로 보내 주시면 2004년 1월호에 토론결과를 게재하겠습니다.
Abstract
In this paper, a damage detection method using mode shapes of truss structures is presented. The theory is formulated based on the changes in the modal strain energy in a truss type structures due to damage. To examine the feasibility, the theory is applied to an experimental data of a 1:6 scale model of a typical hexagonal truss structure. The experiment consists of 17 damage scenarios subjected to three different types of damage. The damage evaluation results show that the proposed method detects successfully damage in truss elements and also show that the performance of proposed method can be significantly impacted by the noise in the measurement data for small damage.
요 지
본 논문에서는 모드형상을 이용한 트러스 구조물의 손상탐지 방법을 소개하였다. 트러스 부재에 대한 손상 탐지 이론은 손상 전과 손상 후의 모달 변형에너지의 차이점을 이용하여 정립하였으며, 이론의 타당성을 조 사하기 위하여 1:6 축척의 6각형 트러스 구조물의 실험 데이터에 이론을 적용하였다. 손상 실험은 총 17가 지의 시나리오로 구성되어 있으며, 손상 타입은 3가지로 구성되어있다. 17가지 실험 데이터에 대한 손상평 가 결과, 본 연구에서 제안한 방법으로 트러스 부재의 손상을 성공적으로 탐지할 수 있었으며, 비교적 작은 손상의 경우 계측 데이터의 노이즈가 손상탐지 성능에 많은 영향을 미친다는 것을 확인하였다.
Keywords : Damage Detection, Truss Structures, Mode Shapes, Modal Strain Energy 핵심 용어 : 손상탐지, 트러스 구조물, 모드형상, 모달 변형에너지
트러스 구조물 내 손상부위 추적에 관한 실험적 검증
Experimental Verification of Nondestructive Damage Detection in a Truss Structure 박 수 용* 최 상 현**
Park, Soo-Yong Choi, Sang-Hyun
1. Introduction
Preventing deterioration while maintaining the serviceability of structures has emerged as a prominent problem in structural engineering.
To date, numerous nondestructive damage evaluation (NDE) methods have been proposed and developed using various experimental and theoretical techniques. Some of the well known experimental techniques include ultrasonics, radiography, magnetic particle, dye penetrant, and eddy current.(1) These techniques have been applied to small-scale systems and a specific portion of large-scale structures.
However, since these "local" methods can only be applied to the detection of damage on a local scale and to accessible portions of the structure, alternative methods that can be applied to the entire structure, the so-called global NDE methods using dynamic responses of a structure, are gaining acceptance. The basic idea behind these vibration-based global methods is that changes in the physical properties of a structural system alter the dynamic response characteristics of the structure.
During the past decade, a great deal of research has been conducted in the area of NDE of structural systems via changes in their vibrational characteristics.(2)~(4) The NDE methods developed to date can be classified into four levels, according to the specificity of the information provided by a given approach:(5) (i) Level I methods, i.e.
those methods that only identify if damage has occurred,(6) (ii) Level II methods, i.e.
those methods that identify if damage has occurred and simultaneously determine the location of damage,(7) (iii) Level III methods,
occurred, determine the location of damage as well as estimate the severity of damage,(8) (iv) Level IV methods, i.e. those methods that identify if damage has occurred, determine the location of damage, estimate the severity of damage, and evaluate the impact of damage on the structure. In many studies, the resonant frequencies were used to identify damage and estimate the amount of damage.
(2),(8)
The shifts of frequencies, however, are very difficult to measure when a small amount of damage is introduced to a relatively large/
massive structure. However, the changes of mode shapes are more sensitive to damage than those of frequencies. One potential solution to this problem is the damage index method. This method has been corroborated using numerically simulated data(9) and field data on a full-scale plate girder bridge(10). To date, no evidence of the performance of the method with regard to truss structures has been reported.
The objective of this study is to examine the feasibility of NDD theory in truss type structures. In this paper, to explore the systematic use of modal parameters (i.e., mode shapes) in NDE on such a large/complex structure, especially on a 3-D truss type structure, the following tasks are performed:
first, the nondestructive damage detection theory is formulated; second, the theory is applied to an experimental data of a 1:6 scale model of a hexagonal truss structure; and third, the feasibility of the damage detection method is investigated and discussed.
2. Nondestructive Damage Detection Theory
a typical element j and mode i of a truss structure be given by
Fij = kj(Δij)2
∑N E
j = 1kj(Δij)2
(1)
where kj represents the stiffness of jth element, Δij represents the deformation of jth element in ith mode, and NE is the number of elements. Let the corresponding parameter of a damaged structure be characterized by asterisk, then Eq. (1) becomes
F*ij= k*j(Δ*ij)2
∑
N E
j = 1k*j(Δ*ij)2
(2)
where Fij* and Fij are related by
F*ij= Fij+ dFij (3)
If we set A= kj(Δij)2= AjEj
Lj (Δij)2 and
B = ∑
N E
j = 1kj(Δij)2= ∑
N E j = 1
AjEj
Lj (Δij)2, and
assume that the structure is damaged in only a single location, then from Eq. (1)
dFij= dA
B - AdB
B2 = A
B
(
dAA - dBB)
(4)Since dA=dB and B >> A, the second term dB/B can be neglected. If we set X=kj, Y=(Δij)2, and dK=dkj, then Eq. (4) can be rewritten as
dFij= 1
B
[
∂A∂X ∂X∂K dK + ∂A∂Y ∂Y∂K dK]
(5)where ∂A
∂X = ( Δij)2, ∂X
∂K = 1 , ∂A
∂Y = kj,
and ∂Y
∂K= ∂(( Δij)2)
∂K =
∂(( KP)2)
∂K = - 2( Δij)2 kj
in which the force P = kj(Δij)= K(Δij) . On substitutingB, ∂A
∂X, ∂X
∂K, ∂A
∂Y , and ∂Y
∂K into Eq. (5), we obtain
dFij=-Fij dK
kj (6)
Substitute Eq. (6) into Eq. (3) and solve for damage index βj
βj= kj k*j =
f*ij fij +1
2 (7)
where fij= (Δij)2/∑
N E
j = 1(Δij)2 and f*ij= (Δ*ij)2/∑N E
j = 1(Δ*ij)2.
In field application of Eq. (7), however, a false indication of damage may result if the element is at or near a node point of ith mode, because the modal energy of that element is very small relative to that of other elements.
To overcome this limitation, we simply add unity to both side on the term fij*/fij. This scheme is equivalent to one to one mapping from domain Ω(0, 1) to Ω(1, 2). Then Eq. (7) can be rewritten as:
βj= f*ij+1 fij+1 + 1
2 (8)
(a) Test Setup The following expression will be the convenient
form of damage index βj if several modes(NM) are used
βj=
(
∑NMi = 1f*ij)
+ 1(
∑NMi = 1fij)
+ 1+ 12 (9)
Next, we establish the criteria for damage localization based on statistical reasoning. The values, β1, β2, β3,..., βNE for each element, are considered as realization of a random variable.
The standardized damage indicator is given by
Zj= βj- μβ
σβ
(10)
where μβ and σβ represent mean and standard deviation of the damage index, βj, respectively.
The final step in damage localization is classification. Classification analysis addresses itself to the problem of assigning an object to one of a number of possible groups on the basis of observations made on the objects.
There are two groups: undamaged elements and damaged elements. The observations made on the objects are the βj's. Many techniques are available to accomplish the classification of objects. In this paper, the method of classification utilizes the Neyman- Pearson criteria.(11) Let Ho be the hypothesis that structure is not damaged at member j, and let H1 be the hypothesis that structure is damaged at member j. The following decision rules may be used to assign damage to member j: (1) choose H1 if Zj ≥ λ and (2)
choose Ho if Zj < λ where λ is a threshold which assigns a level of significance.
3. Application to a Laboratory Model of a Truss Structure
3.1 Description of the space truss
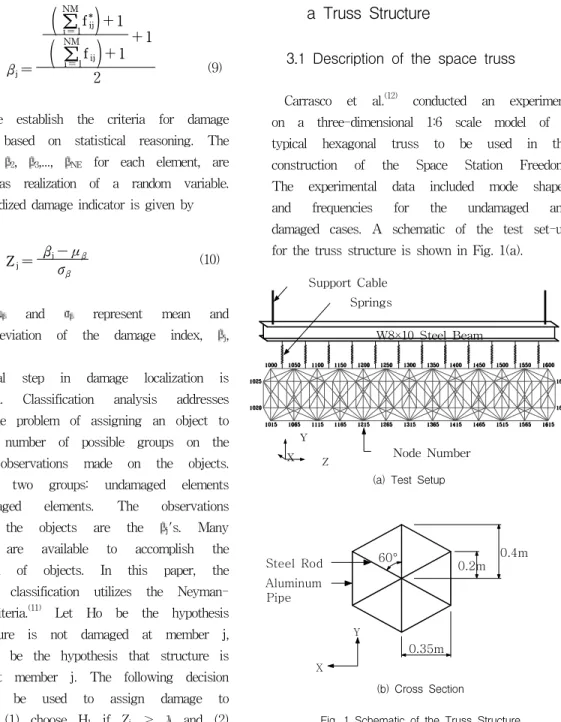
Carrasco et al.(12) conducted an experiment on a three-dimensional 1:6 scale model of a typical hexagonal truss to be used in the construction of the Space Station Freedom.
The experimental data included mode shapes and frequencies for the undamaged and damaged cases. A schematic of the test set-up for the truss structure is shown in Fig. 1(a).
(b) Cross Section
Fig. 1 Schematic of the Truss Structure W8×10 Steel Beam Support Cable
Node Number Springs
X Y
Z
60°
X Y
0.35m 0.2m Steel Rod 0.4m
Aluminum Pipe
The test structure was suspended using twelve soft springs from a W8x10 steel beam which was in turn suspended from a mezzanine ceiling of the laboratory. The W8x10 beam was suspended with two steel cables attached at each end. The springs have an average stiffness coefficient of 0.063 kN/m.
The structure is 4.83m long and consists of twelve evenly spaced bays. The model has a total of 300 elements and 91 nodes.
A typical cross-section of the truss is shown in Figure 1(b). All elements, excluding the elements contained inside the hexagon, are aluminum pipes with an outside radius of 8.56mm and a wall thickness of 2.2mm. The elements contained within the hexagon are threaded steel rods with a radius of 3.2mm.
3.2 Summary of the test
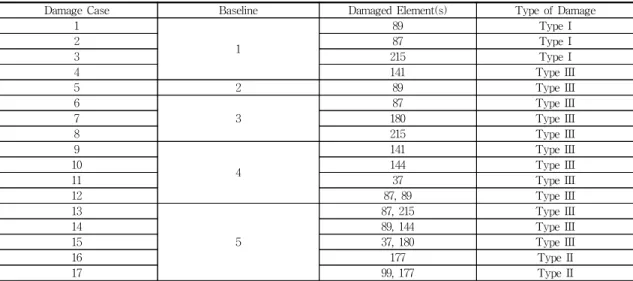
The experiment consisted of 17 damage scenarios and the structure was subjected to three different types of damages (see Table 1). Type I damage corresponded to a 180° x
1.6mm wide cut located at the center of the element. Type II damage corresponded to the removal of 1/3 of the top half of the element.
The removed section was located at the center of the damaged element. Type III damage corresponded to a complete cut through the center of the element.
Fig. 2 shows a collection of all elements that were damaged. Mode shapes from the 17 damage scenarios and 5 undamaged baselines were measured. In each case, it was determined that there were five fundamental vibrational modes for the truss structure that could be used for the purpose of damage detection.
Fig. 2 Inflicted damage locations for damage scenarios 1-17
Z Y
141 144
180 215
177
89 87
37
99
Table 1 Inflicted Damage
Damage Case Baseline Damaged Element(s) Type of Damage
1
1
89 Type I
2 87 Type I
3 215 Type I
4 141 Type III
5 2 89 Type III
6
3
87 Type III
7 180 Type III
8 215 Type III
9
4
141 Type III
10 144 Type III
11 37 Type III
12 87, 89 Type III
13
5
87, 215 Type III
14 89, 144 Type III
15 37, 180 Type III
16 177 Type II
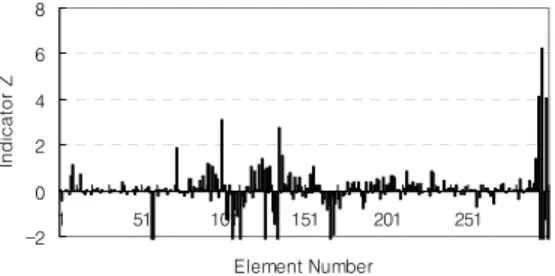
17 99, 177 Type II
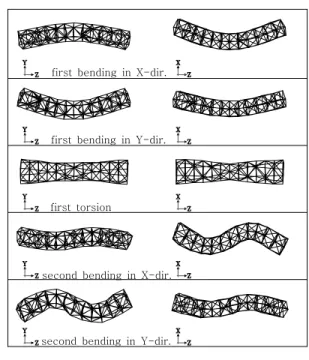
The selected modes can be described as follows:
(1) the first bending in the X-direction; (2) the first bending in the Y-direction; (3) the first torsion; (4) the second bending in the X-direction; and (5) the second bending in the Y-direction. A visualization of these modes is provided in Fig. 3. The apparatus, test set-up, data collection, and analysis of the measured data are described in great detail in the reference.(12)
3.3 Damage detection
The location of potential damage in a given structure is implemented in the following manner.
First, the damage index for each element j is calculated using Eq. (9). Note that in this example all five modes are simultaneously used for the damage localization. Next, the normalized damage indicator, Zj, is calculated using Eq. (10). Finally, pre-assigned decision rules are applied if the structure is damaged or not damaged at element j: (a) the element is damaged if Zj ≥ 3; (b) the element is not damage
if Zj < 3. In this study, damage threshold value to be λ=3 which assigns a 99% significance level. The damage localization results for the 17 damage cases are shown in Fig. 4 through Fig. 20. Table 2 summarizes results of the predicted damage locations.
Fig. 3 Measured mode shapes for baseline structure Table 2 Damage Location for Laboratory Experiment
Damage Scenario Damage Location(s)
Case Damage Type Inflicted Predicted
1 Type I 89 100,294,296,299
2 Type I 87 57,58,72
3 Type I 215 137,294,296
4 Type III 141 1,103,225,227,228
5 Type III 89 57,58,89,259
6 Type III 87 87
7 Type III 180 180,295,296,298,299
8 Type III 215 215,286
9 Type III 141 57,58,141,255,256,257
10 Type III 144 144
11 Type III 37 -
12 Type III 87,89 87,89
13 Type III 87,215 87,215
14 Type III 89,144 89,144
15 Type III 37,180 26,180,295,296,298,299
16 Type II 177 177,289,292
first bending in X-dir.
first bending in Y-dir.
first torsion
second bending in X-dir.
second bending in Y-dir.
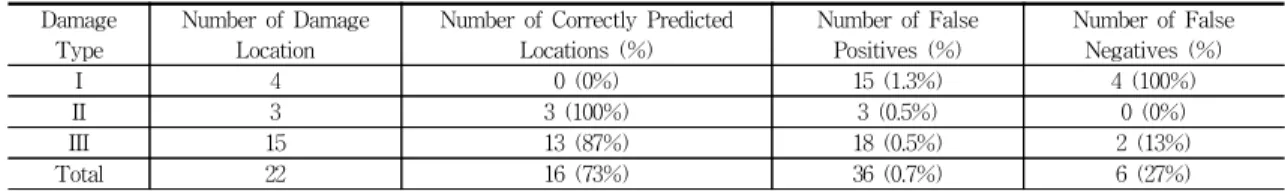
The performance of the method is summarized in Table 3 according to the type of damage.
The performance of the method is a function of the number of damaged locations. Here three indicators are utilized to evaluate the performance of this method. These include (1) the probability of localization, (2) the false positive error rate, and (3) the false negative error rate. The probability of localization is the rate of correct localization of at which we correctly localize a damaged member. The false positive error rate can be defined as the ratio of the number of locations that we incorrectly designate as being damaged to the total number of locations that are indeed not damaged. The false negative error rate can be defined as the ratio of damaged locations that are missed to the total number of damaged locations. In an ideal situation, the probability of localization should be unity, and the false positive and the false negative rates should be zero. In the present application, the consequence of a false negative is much greater than that of a false positive.
The probability of localization varies from zero to one. For the Type I damage (Damage Cases 1 to 4), which corresponded to a 180° x 1.6mm wide cut located at the center of the element, the proposed method fails to detect the correct locations of damage. Note that Type I damage was inflicted at Members 87, 89, 141, and 215. These locations of damage
were repeated in Type III damage (completely cut at the center of the element) where perfectly detected (see Table 2). The poor performance on smaller damage cases (Type I damage) might be attributed to the noise contained in the mode shapes. In other words, the noise level of the measurement system exceeds the level of damage. For the Type II damage (Damage Cases 16 and 17), the proposed method correctly finds all damage locations. For the Type III damage (Damage Cases 5 to 15), there are two locations of false negative error at Member 37 (Damage Cases 11 and 15). Note that Member 37 is one of the hexagonal member in the middle of the structure. This location has very low strain energy and the sensitivity calculated by Eq. (1) is negligible. In overall, 16 locations are correctly detected for the 22 inflicted locations.
4. Summary and Conclusions
The objective of this study was to examine the feasibility of the nondestructive damage detection theory in large/complex structures via systematic use of modal parameters (i.e., mode shapes). The theory was formulated to localize the damage in 3-D truss type structures. The theory was applied to an experimental data of a 1:6 scale model of a typical hexagonal truss which subjected to three different types of damage.
Table 3 Performance of Method for the Laboratory Experiment Damage
Type
Number of Damage Location
Number of Correctly Predicted Locations (%)
Number of False Positives (%)
Number of False Negatives (%)
I 4 0 (0%) 15 (1.3%) 4 (100%)
II 3 3 (100%) 3 (0.5%) 0 (0%)
III 15 13 (87%) 18 (0.5%) 2 (13%)
Total 22 16 (73%) 36 (0.7%) 6 (27%)
From the results obtained, the following conclusions are drawn: (1) the nondestructive damage detection scheme proposed in this study can be applied successfully to truss type structures; (2) damage detection results might be better if several modes are used simultaneously; and (3) the experimental study shows that the performance of proposed method might be significantly impacted by the noise in the measurement data, especially when small amount of damage is introduced.
Fig. 9 Damage Localization Result for Case 6 -2
0 2 4 6 8
1 51 101 151 201 251
Element Number
Indicator Z
Fig. 5 Damage Localization Result for Case 2 -2
0 2 4 6 8
1 51 101 151 201 251
Element Number
Indicator Z
Fig. 4 Damage Localization Result for Case 1 -2
0 2 4 6 8
1 51 101 151 201 251
Element Number
Indicator Z
-2 0 2 4 6 8
1 51 101 151 201 251
Element Number
Indicator Z
-2 0 2 4 6 8
1 51 101 151 201 251
Element Number
Indicator Z
Fig. 8 Damage Localization Result for Case 5 -2
0 2 4 6 8
1 51 101 151 201 251
Element Number
Indicator Z
Fig. 7 Damage Localization Result for Case 4 -2
0 2 4 6 8
1 51 101 151 201 251
Element Number
Indicator Z
Fig. 11 Damage Localization Result for Case 8 -2
0 2 4 6 8
1 51 101 151 201 251
Element Number
Indicator Z
Fig. 12 Damage Localization Result for Case 9 -2
0 2 4 6 8
1 51 101 151 201 251
Element Number
Indicator Z
Fig. 13 Damage Localization Result for Case 10 -2
0 2 4 6 8
1 51 101 151 201 251
Element Number
Indicator Z
Fig. 14 Damage Localization Result for Case 11 -2
0 2 4 6 8
1 51 101 151 201 251
Element Number
Indicator Z
Fig. 15 Damage Localization Result for Case 12 -2
0 2 4 6 8
1 51 101 151 201 251
Element Number
Indicator Z
Fig. 16 Damage Localization Result for Case 13 -2
0 2 4 6 8
1 51 101 151 201 251
Element Number
Indicator Z
Fig. 17 Damage Localization Result for Case14 -2
0 2 4 6 8
1 51 101 151 201 251
Element Number
Indicator Z
Fig. 18 Damage Localization Result for Case 15 -2
0 2 4 6 8
1 51 101 151 201 251
Element Number
Indicator Z
Fig. 19 Damage Localization Result for Case 16 -2
0 2 4 6 8
1 51 101 151 201 251
Element Number
Indicator Z
Fig. 20 Damage Localization Result for Case 17 -2
0 2 4 6 8
1 51 101 151 201 251
Element Number
Indicator Z
References
1. Askeland, D.R. (1994), The Science and Engineering of Materials. PWS Publishing Company, Boston, Massachusetts.
2. Gudmunson, P. (1982), "Eigenfrequency Changes of Structures Due to Cracks, Notches or Other Geometrical Changes," J. Mech. Phys. Solids, 30(5), 339-353.
3. Pandey, A.K. and Biswas, M. (1994), "Damage Detection in Structures Using Changes in Flexibility," J. of Sound and Vibration, 169(1), 3-17.
4. Toksoy, T. and Aktan, A.E. (1994), "Bridge- ondition Assessment by Modal Flexibility,"
Experimental Mechanics, 34(3), 271-278.
5. Rytter, A. (1993), Vibrational Based Inspection of Civil Engineering Structures. Ph.D. Dissertation, University of Aalborg, Aalborg, Denmark.
6. Crohas, H. and Lepert, P. (1982), "Damage Detection Monitoring Method for Offshore Platforms Is Field Tested," Oil and Gas J., 80(8), 94-103.
7. Chance, J., Tomlinson, G.R., and Worden, K. (1994),
"A Simplified Approach to the Numerical and Experimental Modeling of the Dynamics of a Cracked Beam," Proceedings of the 12th International Modal Analysis Conference, Honolulu, Hawaii, pp. 778-785.
8. Stubbs, N., and Osegueda, R. (1990), "Global Damage Detection in Solids-Experimental Verification," Int. J. Anal. Exp. Modal Analysis, 5(2), 81-97.
9. Park, S., Stubbs, N., Bolton, R. (1998), "Damage Detection on a Steel Frame using Simulated Modal Data," Proceedings of the 16th International Modal Analysis Conference, Santa Barbara, California, pp. 616-622.
10. Stubbs, N., Kim, J., Farrar, C.R. (1995),
"Field Verification of a Nondestructive Damage Localization and Severity Estimation Algorithm,"
Proceedings of the 13th International Modal Analysis Conference, Bethel, Conn., pp. 210-218.
11. Gibson, J.D. and Melsa, J.L. (1975), Introduction to Nonparametric Detection with Applications, Academic Press, New York.
12. Carrasco, C.J., Osegueda, R.A., and Ferregut, C.M. (1996) Modal Tests of a Space Truss Model and Damage Localization Using Modal Strain Energy. Report No. Fast 96-01, University of Texas at El Paso, El Paso, Texas.
(접수일자 : 2003년 1월 5일)