Bacterial Community Structure Shift Driven by Salinity: Analysis of DGGE Band Patterns from Freshwater to Seawater of Hyeongsan River, Korea
Bo Ram Beck1, Wilhelm Holzapfel1, Cher Won Hwang2 and Hyung Ki Do1*
1East Sea Rim Marine and Fisheries Research Institute,2Global Leadership School, Handong Global University, Pohang 791-708, Korea Received November 15, 2012 /Revised March 11, 2013 /Accepted March 19, 2013
The influence of a gradual increase in salinity on the diversity of aquatic bacterial in rivers was demonstrated. The denaturing gradient gel electrophoresis (DGGE) was used to analyze the bacterial community shift downstream in the Hyeongsan River until it joins the open ocean. Four water sam- ples were taken from the river showing the salinity gradients of 0.02%, 1.48%, 2.63%, and 3.62%. The samples were collected from four arbitrary stations in 2.91 km intervals on average, and a DGGE analysis was performed. Based on the results of this analysis, phylogenetic similarity identification, tree analysis, and a comparison of each station were performed. The results strongly suggested that the response of the bacterial community response was concomitant to gradual changes in salinity, which implies that salt concentration is a major factor in shifting the microbiota in aquatic habitats.
The results also imply a huge diversity in a relatively small area upstream from the river mouth, compared to that in open oceans or coastal regions. Therefore, areas downstream towards a river mouth or delta are could be good starting points in the search for new bacterial species and strains (“biotypes”).
Key words : Salinity, bacteria, bacterial community shift, microbial diversity
*Corresponding author
*Tel:+82-54-260-1302, Fax:+82-54-260-1319
*E-mail : [email protected]
This is an Open-Access article distributed under the terms of the Creative Commons Attribution Non-Commercial License (http://creativecommons.org/licenses/by-nc/3.0) which permits unrestricted non-commercial use, distribution, and reproduction in any medium, provided the original work is properly cited.
Journal of Life Science 2013 Vol. 23. No. 3. 406~414 DOI : http://dx.doi.org/10.5352/JLS.2013.23.3.406
Introduction
The structure of a diverse microbial population in one en- vironment can be altered or shifted by changes in key envi- ronmental factors such as temperature, nutrients, humidity, pH or even interactions between microbial species [19]. On a larger scale, spatial differences – water depth for an exam- ple – and seasonal changes can also be factors that shift structures of bacterial communities [2, 16]. Among those fac- tors affecting bacterial community structures, the salinity gradient is a factor of dramatic impact within aquatic envi- ronments [9]. Compared to factors such as temperature, pH or nutrition which may change inconsistently by seasonal shift, pollution or any diverse activity that may modify con- ditions of aquatic environments, salinity is a definite factor that continuously increases upstream as freshwater streams flow toward the open ocean.
Salinity may thus be expected to be a major factor influ-
encing the shift of bacterial community structures in water habitats. On this basis, denaturing gradient gel electro- phoresis (DGGE) technique was used in this study to ana- lyze selected environmental water samples from the Hyeongsan river, Pohang, South Korea. DGGE is an effective molecular method because it is based on the inspection of hypervariable regions of bacterial 16S ribosomal RNA (rRNA) genes composed of distinguishable nucleotide se- quences among bacterial species. Each 16S rRNA gene has a different melting temperature (Tm) value which enables separation of heterogenic genomic DNA (gDNA) containing rRNA genes extracted from respective environmental sam- ples [1]. In addition, since DGGE is done by direct gDNA extraction and polymerase chain reaction (PCR), using uni- versal primers for particular bacterial groups, there is no re- quirement for cultivation of these bacteria. Thus, it is widely being used to investigate bacterial community structures.
Moreover, DGGE band patterns can be presented in a semi-quantitative manner when whole experimental proce- dures are quantitatively conducted, resulting in a very useful property to determine any change in bacterial population as the environment changes [14, 15].
In this study, the impact of increasing salinity on a bacte- rial community structure downstream in the Hyeongsan riv- er, Pohang, was determined, and diversity of bacterial spe-
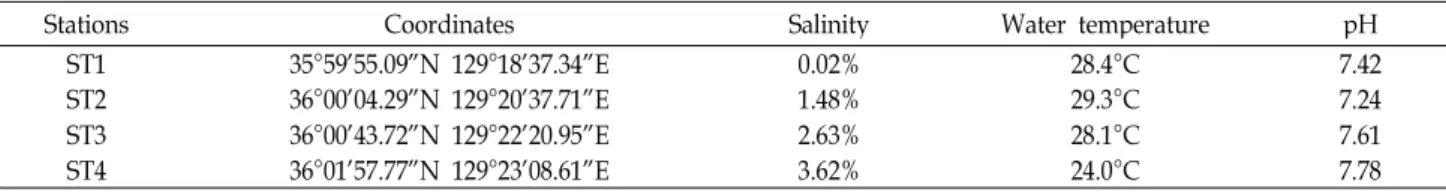
Table 1. Information of sampling stations selected for analyzing the bacterial community shift downstream of Hyeongsan river, Pohang, South Korea
Stations Coordinates Salinity Water temperature pH
ST1 35°59’55.09”N 129°18’37.34”E 0.02% 28.4°C 7.42
ST2 36°00’04.29”N 129°20’37.71”E 1.48% 29.3°C 7.24
ST3 36°00’43.72”N 129°22’20.95”E 2.63% 28.1°C 7.61
ST4 36°01’57.77”N 129°23’08.61”E 3.62% 24.0°C 7.78
cies within joining regions between a river and the ocean is demonstrated.
Materials and Methods Locations and sample collection
Four water samples were collected from Hyeongsan river on July 19th, 2010, starting upstream to downstream where the river joins the open ocean of Youngil Bay, Pohang, South Korea. Salinity and temperature were measured at each sta- tion during sampling with a salinity meter (TDS/salt meter, Dae yun metric industry), and pH of each sample was meas- ured with pH meter (Orion 2 Star, Thermo Scientific) after sampling. The average atmospheric temperature on the sam- pling day was 29.4°C, and the highest atmospheric temper- ature was recorded as 34.1°C, and lowest as 24.9°C. Four sites where the samples were collected were named arbitra- rily from station 1 (ST1) to station 4 (ST4) (Table 1). The total distance between sampling sites (ST1 to ST4) was 8.73 km, and from ST1 to ST2 3.02 km, ST2 to ST3 2.94 km, and ST3 to ST4 2.77 km. The average estimated distances be- tween each station was 2.91 km. For the purpose of repeti- tion of sampling at these stations, the coordinates of each station were noted (Table 1).
Total DNA extraction from collected water samples
500 ml of each sample was filtered through a 0.2 μm pore membrane filter (Whatman®, UK) using a vacuum chamber.
Filters concentrated with biomass of samples were finely chopped and placed in 1.7 ml microtubes (Axygen, Inc.
USA). Whole gDNA of each sample was extracted using Xanthogenate-SDS (XS) buffer DNA extraction protocol as described in a previous study by Tillett et al. [18]. Samples in XS buffer were incubated at 70°C for 2 hr in a water bath for the XS buffer and samples to react fully. After purifica- tion, the final DNA extracts were dissolved in Tris-EDTA (TE, 10 mM Tris-HCl pH 7.4, 1mM EDTA pH 8.0) buffer for further experiments and quantification.
PCR of gDNA templates
In order to proceed with DGGE analysis, gDNA extracts from each station were amplified by PCR. Combination of 341f (5’-CCT ACG GGA GGC AGC AG-3') attached with 40mer GC-clamp (5'-CGC CCG CCG CGC CCC GCG CCC GTC CCG CCG CCC CCG CCC G-3') on its 5’ end, and 907r (5'-CCG TCA ATT CCT TTG AGT TT-3') were used for PCR primers to about 607 bp sized PCR products [13].
For each reaction tube, 12 ng of gDNA isolates were used as template DNA for PCR and one reaction tube without any template as a negative control. The first cycle was exe- cuted at 95°C for 10 minutes, for denaturation of the templates. The next 28 cycles were performed at 95°C for 1 minute, 54°C for 1 minute and 72°C for 1 minute. The last cycle was performed at 72°C for 10 minutes for final extension. 2 μl of each PCR product were examined by agar- ose gel electrophoresis, and a 100 bp DNA ladder (Bioneer, Korea) was used as size marker. Electrophoresis was per- formed with 2% agarose gel, post-stained with ethidium bro- mide for visualization of PCR products.
Semi-quantitative DGGE analysis
To conduct DGGE semi-quantitatively, the result from agarose gel electrophoresis was analyzed with Spot-Denso method provided by AlphaImager 2200™ Software (Alpha Innotech Corporation). Duplicates of 2 μl of 100 bp DNA ladder, loaded together with PCR products, were used as control, and the auto-background was used to set back- ground level.
Quantified PCR products were adjusted to 220 ng for each loading sample and loaded into 6% polyacrylamide gel com- posed of denaturing gradient formed with urea and de- ionized formamide, with the top solution of 40% denaturants and bottom solution of 70% denaturants. Four repeated DGGE runs were conducted in order to set the best gradient, using DGGE gel gradients as 25%:75%, 30%:70%, 35%:70%
and 40%:70%. DGGE was performed with a DCode™
Universal Mutation Detection System (Bio-Rad Laboratories, Hercules, USA) at 60°C and 60 V for 16.6 hr, giving 1000
v·h [20]. After electrophoresis, the gel was stained by GelStar®Nucleic Acid Gel Stain (Lonza Rockland, USA) and visualized under UV illumination.
Band excision, nested PCR of excised bands and nucleotide sequencing
Bands visualized by UV illumination were depicted by AlphaImager 2200™ Software. Based on this, bands were numbered, and gel containing DNA bands were excised by using autoclaved clean razor blades. Excised gels were brief- ly washed twice with 70% ethanol. Using clean pipette tips, excised gel pieces were fragmentized. Then, 40 μl of de- ionized distilled water were placed into each tube containing excised bands and incubated overnight at 4°C.
To proceed on nested PCR, a combination of 341f primer without GC-clamp and 907r primer were used as a primer set. For efficiency and increased specificity of PCR, two nu- cleotide sequences of 5’ end of 907r primer (nest907r: 5'-GTC AAT TCC TTT GAG TTT-3') were deleted, in order to serve as reverse primer for nested PCR. 1 μl of eluted DNA from the excised bands was used as template. Again, PCR prod- ucts were examined by 2% agarose gel electrophoresis.
Amplified bands were sent to Solgent Company (Dajeon, Korea) for nucleotide sequencing, comprising both 341f without GC-clamp and nest907r, for both forward and re- verse nucleotide sequencing. Advanced system for sequence analysis service (ASSA service) performed by Solgent Company provided basic local alignment search tool (BLAST) results of sequenced PCR products. Species of high- est matching score were taken as reference organisms.
However, when uncultured species showed similar scores in BLAST results, those with more taxonomic details were taken as final results.
Phylogenetic analysis of the DGGE results
A phylogenetic tree was drawn to see the diversity of mi- crobiota using partial 16S rRNA gene sequences of DGGE bands. Sequences obtained from bands were directly used.
Ten initial nucleotides of each band sequence were deleted in order to reduce initial N sequences for better alignment process. Clustal X2 was used to align sequences for tree drawing, and resulting alignment files (*.aln) were loaded in Seaview 4 in order to draw trees [3, 10]. Tree drawing was taken with Bio-NJ (Neighbor Joining) with bootstrap of 1000 replicates. A tree for relatedness of each station was made by creating a table of banding patterns. Bands were taken as 1, and blanks as 0 to create binary codes. Then,
the binary codes of each station were loaded in Seaview 4 and a tree was drawn with options of NJ and bootstrap of 1000 replicates.
Results PCR and DGGE
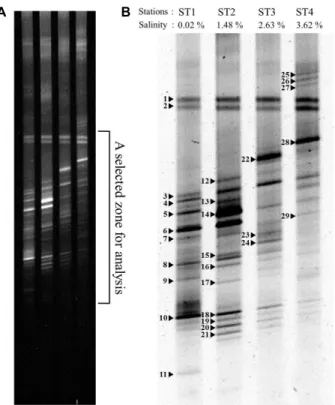
The PCR product bands of each station appeared slightly above the 600 bp indicator of the DNA ladder with an estimated PCR product size of 607 bp (Fig. 1). No band was detected from the negative control, a PCR reaction tube without any template, suggesting that there was no bacterial contamination during the PCR process (Fig. 1, N). It appears that a severe gradient curve was formed during DGGE gel construction. Despite the presence of this gradient curve, two bands (band 1 and 2) from every station were not affected. The captured image of the gel was magnified and colour-reversed for better data presentation because visible bands were concentrated in the central portion of the gel (Fig. 2A). The DGGE results suggested satisfactory semi- quantitative performance since the intensity of common bands such as 18 to 21 changed (Fig. 2B). Interestingly, intensities of bands 8, 16, 18, 19, 20 and 21 gradually decreased as the salinity of each station increases. The DGGE results were arranged in a table for qualitative display with their BLAST identification (Table 2).
Band sequencing and identification of partial 16S rDNA genes
PCR products from excised bands were successfully sequenced to proceed with BLAST analysis. However, some smaller peaks were detected within dominating peaks (data not shown) indicating possible minor contamination during DNA elution from the excised gel fragments even though
Fig. 1. PCR results of GC-341f/907r set of selected stations of Hyeongsan river. M: 100 bp DNA ladder, ST1: station 1, ST2: station 2, ST3: station 3, ST4: station 4, N: Without any template.
Fig. 3. Relatedness of bacterial community structures of each station. The tree is obtained based on binary codes of Table 3. This suggests that the bacterial community structures of each station are shifted gradually manner as salinity increases.
A B
Fig. 2. DGGE results of four stations selected from Hyeongsan river. (A) The DGGE result of whole gel. (B) A reversed image of the selected zone of (A). All numbers are equiv- alent to HSR-numbered series. Bands are skewed by gra- dient curve formed in the gel. However, bands 1 and 2 were not affected by gradients but could be more suc- cessfully sequenced as other excised bands.
fragments were washed twice with 70% ethanol. The for- ward sequences were used as final results and reverse se- quences were used as references. No significant disagree- ment between forward and reverse sequences was found at phylum level from comparison of forward and reverse sequences. Selected species as representatives for each band
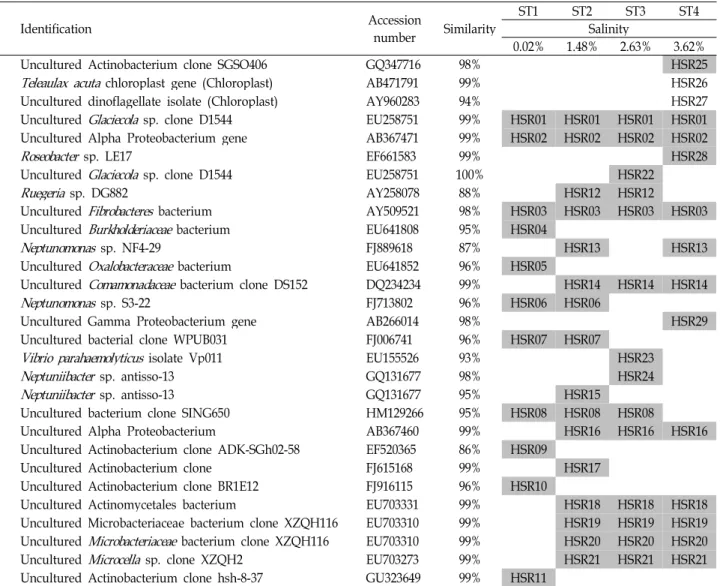
were categorized by stations and all numbers given for each band of the DGGE result were equivalent to the HSR series (referring to Hyeongsan river) (Table 2).
Relatedness of four stations of Hyeongsan river
A neighbor joining tree was drawn from the binary codes of each station and the branches representing each of the four stations resulted in order with respect to their locations, upstream to downstream (Table 3, Fig. 3). Starting from sta- tion 1, the station next in line branched out. The distance of each station from its closest root ranged from 0.103 to 0.172, suggesting a gradual shift of bacterial community structure. However, the distance of station 1 from the origi- nating root was 0.287 and should be omitted because station 1 was the initial station in this study.
Phylogenetic tree analysis of total species
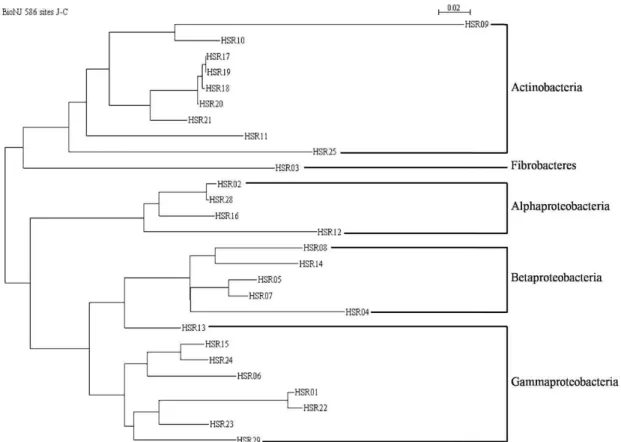
A phylogenetic tree of total sequenced bands was created to indicate the diversity of microbiota in the examined area in this study (Fig. 4). Two sequenced bands, HSR26 and HSR27, were identified as eukaryotic chloroplast genes, and were therefore excluded (Table 2, ST4). Phyla were grouped according to their similarity of 16S rDNA sequences except HSR13 which was identified asNeptunomonas sp., a member of the Gammaproteobacteria. HSR13 appeared in a cluster of Betaproteobacteria, but it was counted as Gammaproteobacteria as the BLAST result suggests. Interestingly, HSR07 and HSR08, which were originally unidentified bacteria accord- ing to reference sequences FJ006741 and HM129266, ap- peared within theBetaproteobacteria cluster. Therefore, HSR07 and HSR08 were counted as Betaproteobacteria.
Table 2. Identification of excised bands and their information
Identification Accession
number Similarity ST1 ST2 ST3 ST4
Salinity
0.02% 1.48% 2.63% 3.62%
Uncultured Actinobacterium clone SGSO406 GQ347716 98% HSR25
Teleaulax acuta chloroplast gene (Chloroplast) AB471791 99% HSR26
Uncultured dinoflagellate isolate (Chloroplast) AY960283 94% HSR27
Uncultured Glaciecolasp. clone D1544 EU258751 99% HSR01 HSR01 HSR01 HSR01
Uncultured Alpha Proteobacterium gene AB367471 99% HSR02 HSR02 HSR02 HSR02
Roseobacter sp. LE17 EF661583 99% HSR28
Uncultured Glaciecolasp. clone D1544 EU258751 100% HSR22
Ruegeria sp. DG882 AY258078 88% HSR12 HSR12
Uncultured Fibrobacteresbacterium AY509521 98% HSR03 HSR03 HSR03 HSR03
Uncultured Burkholderiaceaebacterium EU641808 95% HSR04
Neptunomonas sp. NF4-29 FJ889618 87% HSR13 HSR13
Uncultured Oxalobacteraceaebacterium EU641852 96% HSR05
Uncultured Comamonadaceaebacterium clone DS152 DQ234234 99% HSR14 HSR14 HSR14
Neptunomonas sp. S3-22 FJ713802 96% HSR06 HSR06
Uncultured Gamma Proteobacterium gene AB266014 98% HSR29
Uncultured bacterial clone WPUB031 FJ006741 96% HSR07 HSR07
Vibrio parahaemolyticus isolate Vp011 EU155526 93% HSR23
Neptuniibacter sp. antisso-13 GQ131677 98% HSR24
Neptuniibacter sp. antisso-13 GQ131677 95% HSR15
Uncultured bacterium clone SING650 HM129266 95% HSR08 HSR08 HSR08
Uncultured Alpha Proteobacterium AB367460 99% HSR16 HSR16 HSR16
Uncultured Actinobacterium clone ADK-SGh02-58 EF520365 86% HSR09
Uncultured Actinobacterium clone FJ615168 99% HSR17
Uncultured Actinobacterium clone BR1E12 FJ916115 96% HSR10
Uncultured Actinomycetales bacterium EU703331 99% HSR18 HSR18 HSR18
Uncultured Microbacteriaceae bacterium clone XZQH116 EU703310 99% HSR19 HSR19 HSR19 Uncultured Microbacteriaceaebacterium clone XZQH116 EU703310 99% HSR20 HSR20 HSR20
Uncultured Microcella sp. clone XZQH2 EU703273 99% HSR21 HSR21 HSR21
Uncultured Actinobacterium clone hsh-8-37 GU323649 99% HSR11
Columns ST1 to ST4 represent the sampling stations and show a band pattern of the DGGE results for qualitative presentation.
Accession numbers are obtained from NCBI data bank. HSR26 and HSR27 were identified as eukaryotic chloroplast 16S rDNA sequences.
Table 3. Binary codes for the four sampling stations (see Table 1) based on band patterns, 1 for a band and 0 for a blank
Stations Binary code
ST1 00011000110101010001010100001 ST2 00011001101011010011101011110 ST3 00011011100010001101100011110 ST4 10011100101010100000100011110
Discussion
The bacterial community structure analysis of the river stream demonstrated the impact of salinity change on microbiota. In a qualitative perspective, there was no sig-
nificant change in the number of Gram-positive and -negative bacterial species through each station (Table 4). In addition, Gram-negative bacteria covered about two-thirds of the Hyeongsan river bacterial diversity (Fig. 4). DGGE band analysis cannot represent whole microbiota because re- covering whole microbial 16S rDNA as DGGE bands via PCR would be virtually impossible, but still, important quantitative tendencies of bacterial community shift may be indicated by the results.
Major thick bands appearing at all stations, HSR01, 02, 06, 14, 22 and 28, are Gram-negative bacteria including Glaciecola sp. and Neptunomonas sp. which were first isolated from aquatic habitats (Fig. 2). Band intensity of HSR01 and 02 slightly increased from ST1 to ST4. Although HSR03, 06
Fig. 4. A phylogenetic tree of partial 16S rDNA sequences from all stations. HSR26 and HSR27 are eukaryotic chloroplast 16S rDNA and were excluded.ActinobacteriaandGammaproteobacteriaare major groups throughout all stations. HSR07 and HSR08 were not classified in NCBI nucleotide databank. However, they were treated asBetaproteobacteriabased on this result in this study. HSR13, identified as a member ofGammaproteobacteria, is more closely related toBetaproteobacteria. The tree was created by Bio-NJ 586 sites, with 1000 replicates.
Table 4. Categorization of identified DGGE bands
Classification ST1 ST2 ST3 ST4
Salinity
0.02% 1.48% 2.63% 3.62%
Alphaproteobacteria 1 3 3 3
Betaproteobacteria 5 4 3 2
Gammaproteobacteria 1 3 3 2
Fibrobacteres 1 1 1 1
Actinobacteria 3 5 4 5
Total number of DGGE bands* 11 16 14 13
The number of Betaproteobacteria decreased as salinity increases. HSR26 and HSR27of ST4 are omitted (see Table 2).
and 14 showed different band intensities at each station, no significant correlation between salinity gradient and pop- ulation change of any other Gram-negative bacteria was observed. Interestingly,Betaproteobacteria diversity decreased as salinity increased (Table 4). This dynamic, decrease of Betaproteobacteria in increasing salinity, was also observed from a study of bacterioplankton composition of the Tibetan plateau [21]. Compared to band patterns of Gram-negative
bacteria, some Gram-positive bacteria (HSR18, 19, 20 and 21) showed gradually decreasing band intensities as the salinity gradient increases. Interestingly, these Gram-positive bac- teria are classified as members ofActinobacteria by phyloge- netic analysis. These bacteria may be members of acI and acII clusters that were found to be a predominant freshwater group in the study of actinobacterial diversity of the Tibetan plateau [7]. In addition, another study ofActinobacteria com-
munity structure dynamic in gradient saline habitats, states the importance of salinity to the actinobacterial diversity [5].
Conclusively, the changes of band intensity observed from the DGGE results imply that some bacterial species, espe- cially Actinobacteria, gradually responded to the increasing salinity gradient of the river. To summarize, both qualitative and quantitative responses of the microbiota to salinity change suggest salinity to be a very important factor influ- encing the composition and population of microbiota in aquatic habitats.
Regarding microbial diversity, previous studies of bacte- rial community structure shifts in an open ocean or along a coast line imply that microbiota do not change drastically in a spatial sense when salinity is constant [8, 17]. Compared to the wide area of these studies, our study only covers 8.73 km of river. Despite spatial narrowness, the shift of micro- biota observed downstream of Hyeongsan river was dramatic. Conclusively, the amount of salt content is crucial for microbiota formation. However, impact of different ion combinations in salt is required to be determined in future studies. Focusing on salinity as an important ecological fac- tor, other studies suggest that salinity plays an important role in microbial diversity not only in aquatic habitats but also on a global scale, and it was stated that salinity is a major factor for distribution of the bacterial pattern [11]. The study includes diverse environments such as soil, sediment, water and other related habitats, and showed that salinity was the main factor affecting bacterial patterns in each field.
This emphasizes that salt concentration should be the first factor to consider when studying a microbial community of any environment. Thus, these studies support and suggest salinity gradients as an ecological condition which may lead to a maximization of microbial diversity.
As discussed previously, increasing salt concentration forces the microbiota to shift towards a halotolerant and hal- ophilic bacterial composition. This phenomenon seems closely associated with the unique physiological and genetic composition among microorganisms. For example, one phe- notypic characteristic of Neptunomonas sp., HSR06 and 13, is its tolerance of salt concentrations within the range of 0.5%-7.5% [4, 23]. Another organism (HSR01) dominant in all stations, Glaciecola sp. is slightly halophilc and capable of growing at maximum 8% salinity, depending on species and strain specificities, according to descriptions in literature [22]. Also, Ruegeria sp., Roseobacter sp. and Vibrio para- haemolyticus, those detected in this study, are bacteria typi-
cally associated with marine environments, and are expected to be found in salt water aquatic niches. In addition, we sus- pect that genetic compositions of microorganisms may con- tribute in selection processes during salinity driven bacterial community structure shift. Variations of ion channels among prokaryotic species allow prokaryotic cells to have unique characteristics that will respond to change in salinity compo- sition and concentration. This is a well-studied fact that channeling activities and ion specificity of ion channels dif- fer from one to another, thereby affecting survival abilities of different microbial species [12]. However, this needs to be examined at community level in order to investigate how a microbiome responds on its surrounding environment. For this kind of research, metagenomics and metatran- scriptomics represent another approach that may serve to reveal deeper insights in future directions of such studies.
Jefferies et al. [6] applied metagenomic techniques to de- termine different expression of various genes due to salinity gradient of sediments. By adopting methods and insights of this analysis, expression of osmotic stress associated genes in one microbiome of a specific environment can be revealed. Ultimately, it will help and allow us to isolate those uncultured bacteria, which presently only can be ob- served as nucleotide sequences, by allowing us to assume essential factors for growth of uncultured bacteria via a tran- scription profile of the microbiome. This may be a valuable tool towards understanding their behavior and metabolism in presence of important stress (or environmental) factors such as salinity.
Conclusively, the bacterial community of Hyeongsan riv- er responded to gradual salinity change by a shifting compo- sition of bacterial species. Moreover, the relatedness of sam- pling stations suggests that a bacterial community in one station (higher salinity) originate from an upper stream (low salinity) community. Thus, salinity plays an important role as a selection factor in community structure shift of a con- stantly flowing river. However, the analysis in this study mainly focused on the composition of bacterial species. At this point, it would be premature to propose a mechanism of bacterial community shift. Thus, current molecular biol- ogy techniques need to be applied in such ecological studies.
The establishment of systemic microbial ecology integrated with molecular biological approaches would facilitate a deeper understanding and explanation of microbial com- munity shifts. In addition, this should allow us to construct or simulatein vitro environments for isolating and detecting
novel bacteria in typical aquatic ecosystems with pop- ulations influenced by changing salinity gradients.
Acknowledgements
This research was funded by a research support program of Handong Global University (April, 2010 – Jan, 2011). We thank Young-Rok Kim for his excellent assistance in our experiments.
References
1. Ercolini, D. 2004. PCR-DGGE fingerprinting: novel strat- egies for detection of microbes in food.J Microbiol Methods 56, 297-314.
2. Ghiglione, J. F., Palacios, C., Marty, J. C., Mével, G., Labrune, C., Conan, P., Pujo-Pay, M., Garcia, N. and Goutx, M. 2008. Role of environmental factors for the vertical dis- tribution (0–1000 m) of marine bacterial communities in the NW Mediterranean Sea.Biogeosci Discuss5, 2131-2164.
3. Gouy, M., Guindon, S. and Gascuel, O. 2010. SeaView ver- sion 4: a multiplatform graphical user interface for sequence alignment and phylogenetic tree building.Mol Biol Evol27, 221-224.
4. Hedlund, B. P., Geiselbrecht, A. D., Bair, T. J. and Staley, J. T. 1999. Polycyclic aromatic hydrocarbon degradation by a new marine bacterium,Neptunomonas naphthovoransgen.
nov., sp. nov. Appl Environ Microbiol 65, 251-259.
5. Holmfeldt, K., Dziallas, C., Titelman, J., Pohlmann, K., Grossart, H. and Riemann, L. 2009. Diversity and abundance of freshwaterActinobacteriaalong environmental gradients in the brackish northern Baltic Sea. Environ Microbiol 11, 2042-2054.
6. Jeffries, T. C., Seymour, J. R., Newton, K., Smith, R. J., Seuront, L. and Mitchell, J. G. 2011. Increases in the abun- dance of microbial genes encoding halotolerance and photo- synthesis along a sediment salinity gradient. Biogeosci Discuss 8, 7551-7574.
7. Jiang, H., Huang, Q., Deng, S., Dong, H. and Yu, B. 2010.
Planktonic Actinobacterial diversity along a salinity gra- dient of a river and five lakes on the Tibetan plateau.
Extremophiles 14, 367-376.
8. Kim, Y. J., Cho, H. J., Yu, S. N., Kim, K. Y., Kim, H. R.
and Ahn, S. C. 2007 Diversity of marine microbes by PCR-DGGE. J Kor Fish Soc40, 356-361.
9. Langenheder, S., Kisand, V., Wikner, J. and Tranvik, L. J.
2003. Salinity as a structuring factor for the composition and performance of bacterioplankton degrading riverine DOC.
FEMS Microbiol Ecol 45, 189-202.
10. Larkin, M. A., Blackshields, G., Brown, N. P., Chenna, R., McGettigan, P. A., McWilliam, H., Valentin, F., Wallace, I.
M., Wilm, A., Lopez, R., Thompson, J. D., Gibson, T. J. and Higgins, D. G. 2007. Clustal W and Clustal X version 2.0.
Bioinformatics 23, 2947-2948.
11. Lozupone, C. A. and Knight, R. 2007. Global patterns in bacterial diversity.Proc Natl Acad Sci USA104, 11436-11440.
12. Martinac, B., Saimi, Y. and Kung, C. 2008. Ion channels in microbes. Physiol Rev88, 1449-1490.
13. Muyzer, G., De Waal, E. C. and Uitterlinden, A. G. 1993.
Profiling of complex microbial populations by denaturing gradient gel electrophoresis analysis of polymerase chain re- action-amplified genes coding for 16S rRNA. App Environ Microbiol 59, 695-700.
14. Muyzer, G. 1999. DGGE/TGGE a method for identifying genes from natural ecosystems. Curr Opin Microbiol 2, 317-322.
15. Rasiah, I. A., Wong, L., Anderson, S. A. and Sissons, C. H.
2005. Variation in bacterial DGGE patterns from human sali- va: over time, between individuals and in corresponding dental plaque microcosms. Arch Oral Biol 50, 779-787.
16. Sakami, T. 2008. Seasonal and spatial variation of bacterial community structure in river-mouth areas of Gokasho Bay, Japan. Microbes Environ 23, 277-284.
17. Taniguchi, A. and Hamasaki, K. 2008. Community struc- tures of actively growing bacteria shift along a north-south transect in the western North Pacific.Environ Microbiol10, 1007-1017.
18. Tillett, D. and Neilan, B. A. 2000. Xanthogenate nucleic acid isolation from cultured and environmental cyanobacteria.J Phycol 36, 251-258.
19. Van der Gucht, K., Cottenie, K., Muylaert, K., Vloemans, N., Cousin, S., Declerck, S., Jeppesen, E., Conde-Porcuna, J. M., Schwenk, K., Zwart, G., Degans, H., Vyverman, W.
and De Meester, L. 2007. The power of species sorting: Local factors drive bacterial community composition over a wide range of spatial scales. Proc Natl Acad Sci USA 104, 20404-20409.
20. Von Sigler, W., Miniaci, C. and Zeyer, J. 2004.
Electrophoresis time impacts the denaturing gradient gel electrophoresis-based assessment of bacterial community structure. J Microbiol Methods57, 17-22.
21. Wu, Q. L., Zwart, G., Schauer, M., Agterveld, K. M. P. and Hahn, M. W. 2006. Bacterioplankton community composi- tion along a salinity gradient of sixteen high-mountain lakes located on the Tibetan plateau, China.Appl Environ Microbiol 72, 5478-5485.
22. Yong, J. J., Park, S. J., Kim, H. J. and Rhee, S. K. 2007.
Glaciecola agarilyticasp. nov., an agar-digesting marine bac- terium from the East Sea, Korea. Int J Syst Evol Microbiol 57, 951-953.
23. Zhang, X. Y., Zhang, Y. J., Yu, Y., Li, H. J., Gao, Z. M., Chen, X. L., Chen, B., Zhang, Y. Z. 2010.Neptunomonas ant- arcticasp. nov., isolated from marine sediment. Int J Syst Evol Microbiol 60, 1958-1961.
초록:염도의 변화에 따른 미생물 군집의 변화: 경북 형산강 하류 미생물 군집 변화의 DGGE pattern 분석
백보람1․Wilhelm Holzapfel1․황철원2․도형기1* (한동대학교 1환동해 해양수산연구소, 2GLS 학부)
강의 하류지역에서 미생물의 군집이 점진적인 염도의 증가에 따라 변한다는 것을 실험적으로 보기 위하여, 경 북 형산강의 하류에서부터 연안해역으로 유입되는 곳까지 약 2.91 km 간격으로 0.02%, 1.48%, 2.63%, 3.62%의 염분을 포함하는 물 시료를 얻어 denaturing gradient gel electrophoresis (DGGE)를 수행하였다. 계통분석, 계통 수 및 각 시료간의 연관성을 조사한 결과, 미생물 군집의 변화가 염분의 증가에 따라 점진적으로 변화하는 것을 확인하였으며, 이는 염분의 농도가 미생물 군집에 큰 영향을 미치는 요소임을 제시한다. 덧붙여 연안 지역이나 다른 수계환경에 비해 하류지역은 염분의 점진적인 변화로 인해 좁은 면적에 비하여 미생물 다양성이 크고, 이는 곧 특이하고 새로운 종을 찾기에 좋은 장소임을 시사하였다.