Journal of the Ergonomics Society of Korea
Vol. 29, No. 4 pp.647-654, August 2010 DOI:10.5143/JESK.2010.29.4.647
Development of Evaluation Metrics for Pedestrian Flow Optimization in a Complex Service Environment
Based on Behavior Observation Method
Sangwoo Bahn, Chaiwoo Lee, Sanghyun Kwon, Myung Hwan Yun Department of Industrial Engineering, Seoul National University, Seoul, 151-744
ABSTRACT
In a service environment, the spatial layout is an important factor that has a great impact on customers' behavioral characteristics including wayfinding and purchasing. Previous studies have shown a gap between marketing, focusing solely on profitability and satisfaction, and architecture, looking only into efficiency of pedestrian flow. To balance such disparity, this study suggests an integrated approach for assessing behavioral patterns in complex service environments. With the objective that complex service environments should aim to increase its profitability and efficiency while guaranteeing customer satisfaction, quantitative metrics was developed for evaluation. The metrics was defined to use data from behavior observation including path tracking, population counting, and gaze analysis, while previous studies have relied on abstract survey methods that were prone to sampling errors and loss of data. For validation of the metrics in a real world setting, a case study was conducted at 4 train stations in Korea. In the case study, experiments were conducted to gather the required data in all 4 train stations, while their physical layouts were also analyzed. With the results from the case study, comparative evaluation of the 4 train stations in terms of behavioral efficiency was possible, together with a discussion on the effect of their physical settings.
Keywords: Efficiency of pedestrian flow, Evaluation metric, User observation, Servicescape, Complex service environment
1. Introduction
Service environment is the physical environment in service businesses that are likely to influence behaviors and create an image of the business (Bitner, 1992). In service processes, the physical environment in which the process takes place is known to have impact on consumers' perception of service quality, purchase behavior, and satisfaction on the process (Booms and Bitner, 1981; Bitner, 1992; Wakefield and Blodgett, 1996; Wakefield and Baker, 1998; Cockrill et al., 2008). Particularly, when a service process is being operated in a large and complex environ- ment, the effect of the spatial layout on users' behavioral
characteristics in terms of pedestrian circulation and flow also becomes an important issue (Wakefield and Blogett, 1996; Yoo, 1996; Choi and Min, 1998; Wakefield and Baker, 1998; Choi and Min, 2002; Park et al., 2003; Choi and Lim, 2004; Lee et al., 2006). As types of service environment become more diverse and their physical settings become more complex, it is essential to study further into finding the impact of service environment on consumer behavior.
The term 'servicescape' has been used in many research papers for describing and emphasizing the role of physical environment in a service process. Booms and Bitner (1981) defined a servicescape as "an environment in which service is assembled and in which the seller and customer interact,
Corresponding Author: Myung Hwan Yun
Address: 39-312, College of Engineering, Seoul National University, Daehak-dong, Kwanak-gu, Seoul, 151-744. Tel: 02-880-1403, E-mail: [email protected]
648 Sangwoo Bahn · Chaiwoo Lee · Sanghyun Kwon · Myung Hwan Yun JESK
combined with tangible commodities that facilitate perfor- mance or communication of the service." In a marketing point of view, researches have been focusing on customers' satisfaction and desire to stay. In an architectural point of view, researches on the complex physical layout, environ- ments, and wayfinding were studied.
Recently, Service environments are becoming larger and more complex while adopting multiple functions. Thus, the integrated approach is needed to assess the new service environments effectively and efficiently. This study aims to propose quantitative metrics to assess customer behavior and pedestrian flow in complex service environment. Also, the metrics was applied to train stations for empirical verification.
2. Literature survey
2.1 Servicescapes: the physical settings in service environments
Servicescape is a term developed to suggest the impact of a service environment's physical setting on customers' behavior and attitude toward the service (Booms and Bitner, 1981). Many studies have empirically examined the influence of physical settings' spatial layout and functionality on human behavior. Wakefield and Blodgett (1996) identified dimensions of a servicescape by studying baseball stadiums.
Similar efforts were shown in later studies on more various types of leisure service settings including casinos and restaurants (Lucas, 2003; Kim and Moon, 2009). Since the concept of servicescape was first developed as a marketing terminology, previous researches have focused only on a limited range of aspects of user behavior. Since the concept leaves out some important environmental characteristics such as architectural structure of a servicescape, results of previous studies cannot be applied in the early stages of building a service environment.
2.2 Spatial layout and user behavior in complex service environments
The spatial layout and functionality of servicescape are highly salient to customers in environments where customers have to perform on their own without any assistance from
employees. They are more important in complex settings than in simple surroundings (Bitner, 1992). Since complex servicescapes are usually more complicated in terms of layout, they have not only been considered in marketing and business management, but also in the field of architecture. In a research of Choi and Baek (2002), it was suggested that spatial layout affects the overall efficiency of wayfinding in shopping malls. They found that within a complex service environment, the spaces that are well integrated and connected with other parts of the environment were more easily and frequently reached by customers.
The integration of spaces within a complex service environment was found as an important factor of spatial layout that affects user behavior, especially pedestrian circulation and flow in the environment, in other studies as well (Park et al., 2003; Lee et al., 2006).
In today's society more service environments, such as train stations, sports arenas, airports and hotels, are becoming multi-functional. Thus, more research is needed to empirically study how the physical setting of a complex service environment, especially the spatial layout and functionality, influence user behaviors such as their circulation and flow in the structure.
2.3 Quantitative evaluations on service environments
Quantification of user behaviors has been investigated in other related research areas. In transportation science, quantitative assessment was done to analyze the effects of physical settings on transportation routes and time (Braess et al., 2005; Jin et al., 2008; Papadimitriou et al., 2009;
Stepanov and Smith, 2009). Service has also been a research topic for quantitative evaluation, but previous analyses have been limited to the concept of service process and its productivity (Gronroos and Ojasalo, 2004).
For evaluation of user behavior in service environments,
many previous studies have approached the topic with
qualitative measurements and methods (Wakefield and
Blodgett, 1996; Lee et al., 2006; Cockrill et al., 2007; Park
et al., 2008; Kim and Moon, 2009). Qualitative methods
such as interviews and surveys are useful in assessing user
satisfaction, especially when marketing management is the
main concern. However, in complex service environments,
where the interactions between users and the architectural
space layout is considered as an important issue, quantitative
measurements are needed for systematically evaluating user behavior (Yoo, 1996).
Previous studies have developed models and metrics to assess efficiency of pedestrian flow effectively. However, they were limited in considering patterns in pedestrian circulation and finding relationships with spatial layouts.
Also, many of the metrics have been studied in laboratory settings or simulated environments. Thus, more compre- hensive and empirical studies are needed for development of metrics with enhanced generalizability and validity.
2.4 The need for an integrated approach
As a result of literature survey, different definitions of user behavior were found between the views of marketing and architectural engineering. Most of the studies in the field of marketing focused on users' satisfaction, feeling of commitment, and desire to stay. On the other hand, studies in the field of architecture were more focused on complex physical settings and had defined user behavior in terms of wayfinding.
Along with the definitions significantly differing from the two points of view, the objectives set from each view on building service environments also showed some differences. Recently, service environments are becoming larger, getting more complex, and adopting multiple functions (Choi and Baek, 2002). Thus, an integrated approach with a comprehensive set of objectives and quantitative measurements is needed to minimize the gap between the two viewpoints.
3. Development of an evaluation metric
3.1 Objectives for integrated framework
As described in 2.4, objectives in views of marketing and architecture in building a complex service environment differ significantly. However, the gap between the two fields should be minimized for more practical use.
In this study, new objectives were defined in order to develop an integrated evaluation metrics for evaluating today's complex service environments. The specific objectives largely state that today's complex service environments should aim to increase its profitability and
efficiency while guaranteeing user satisfaction. In other words, complex service environments must enable users to effectively explore and move through the physical settings, encourage them to get involved in purchase activities, and satisfy them fully. The new integrated set of objectives is stated in Table 1.
3.2 New metrics for complex service environments
Although previous studies have suggested several quantitative metrics for evaluating user behavior, such metrics cannot fully assess the degree in which a complex service environment satisfies the objectives stated in Table 1.
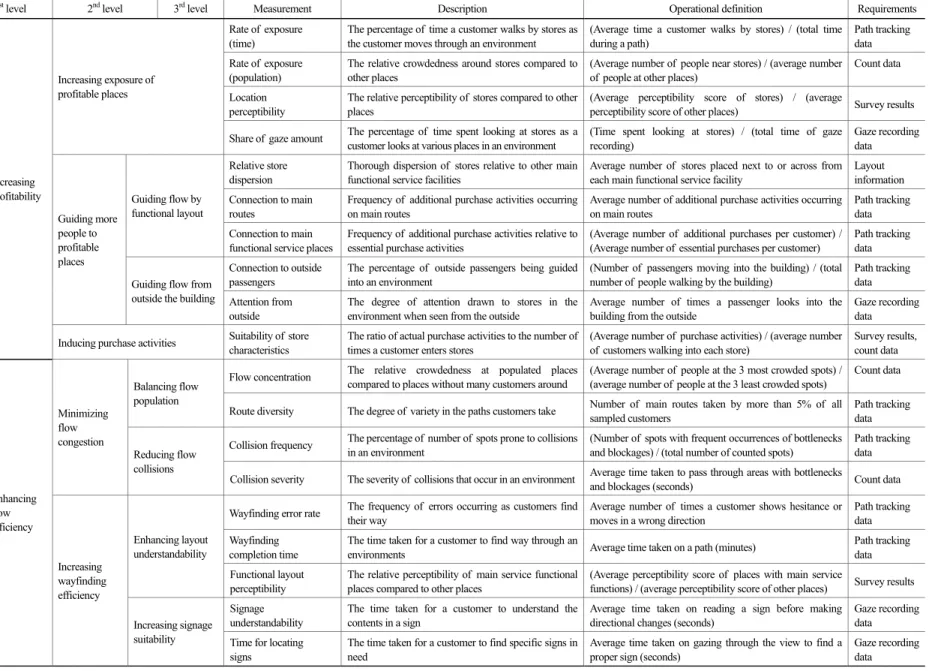
For a more comprehensive evaluation, this study suggests new metrics applicable to various types of complex service environments. The developed metrics aims to assess the degree to which the spatial layout of a complex service environment satisfies the objectives stated in Table 1. The proposed metrics includes both objective and subjective measures, all defined in quantitative terms. The descriptions and operational definitions are summarized in Table 2. In order to apply the metrics, objective and subjective empirical survey will be needed for the environment in concern. Possible techniques for such empirical research are suggested in the last column of Table 2.
Unlike previous studies that have focused heavily on measuring flow efficiency, the metrics described in Table 2 covers other aspects of complex service environments.
With the comprehensive list of metrics, the degree in which a complex service environment fulfills the objectives in Table 1 can be extensively evaluated.
4. Case study: behavioral efficiency in complex train stations
In this study, 4 major train stations in Korea - Seoul, Yongsan, East Daegu and Yongdeungpo Station - were selected for experiment. The 4 stations have similar size, complexity, and average number of passengers. All 4 stations hold multiple types of trains including Korea eXpress Train (KTX), regular transit lines, and subway lines.
For evaluation of the 4 stations with the metrics
650 Sangwoo Bahn · Chaiwoo Lee · Sanghyun Kwon · Myung Hwan Yun JESK
developed, experiments were conducted to gather the data needed. Experiments were conducted in 4 parts, including path tracking, population counting, eye gaze recording, and passenger survey. Methods of each experiment are summarized in Table 3. The experiments were done for all of the 4 stations. Since purposes of visit and crowdedness of the environments can differ due to time and day, the experiments were done at a similar time during a weekday.
4.1 Results of the case study
After collecting data from 4 parts of the experiment, results for all the metrics defined in Table 4 were calculated.
The data gathered were organized and aggregated to produce evaluation results for all 4 train stations in terms of the metrics. Results from evaluation are summarized in Table 4, where the bold numbers represent the best of the 4 stations. The results showed that Seoul Station and East Daegu Station outperformed the other two stations when evaluated on the environments' tendency to increase profitability. Places that generate profits were exposed more openly to passengers in and out of the building at East Daegu Station. At Seoul Station, profitable places with more suitable characteristics were well connected to other functional areas in the station, and were also seen and located more easily by passengers. Seoul Station and East
Table 1. Objectives suggested in this study1st level 2nd level 3rd level Description
Increasing exposure of profitable places (P1) Placing stores near main flow routes to increase the exposure rate Guiding flow by functional
layout (P2)
Distributing stores at proper locations in relation to other functional spaces so that the customers are guided to them
Guiding more people
to profitable places Guiding flow from outside
the building (P3) Designing the exterior of the building so that the customers outside the building are guided inside
Increasing profitability
Inducing purchase activities (P4) Increasing purchase activities by characterizing the stores considering customer behavior and preferences
Balancing flow population (E1)
Making the circulation load more even throughout various routes by diversifying main routes and placing exits at proper places
Increasing wayfinding efficiency
Reducing flow collisions (E2) Smoothing the flow out and decreasing congestion by removing potential bottlenecks and blockages
Enhancing layout
understandability (E3) Reducing the potential of getting confused or lost and making wayfinding more efficient in terms of time and error frequency Enhancing flow
efficiency
Minimizing flow
congestion Increasing signage suitability
(E4) Placing signs at proper places to help customers find their way easily and efficiently
Figure 1. Path tracking data for Seoul Station
Figure 2. Population counting data for Seoul Station
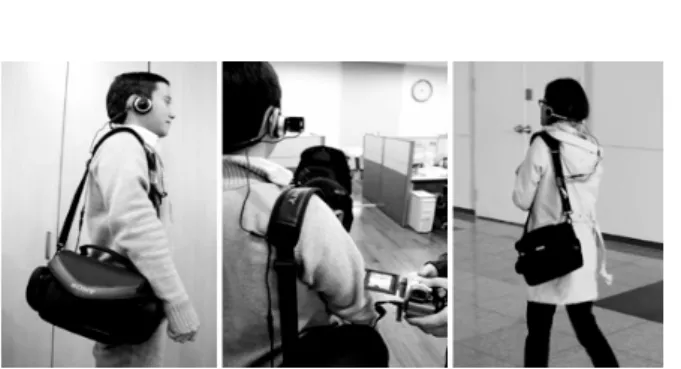
Figure 3. The device for recording eye gaze data
Table 2. New metrics for evaluating complex service environments
1st level 2nd level 3rd level Measurement Description Operational definition Requirements
Rate of exposure (time)
The percentage of time a customer walks by stores as the customer moves through an environment
(Average time a customer walks by stores) / (total time during a path)
Path tracking data Rate of exposure
(population)
The relative crowdedness around stores compared to other places
(Average number of people near stores) / (average number of people at other places)
Count data
Location perceptibility
The relative perceptibility of stores compared to other places
(Average perceptibility score of stores) / (average
perceptibility score of other places) Survey results Increasing exposure of
profitable places
Share of gaze amount The percentage of time spent looking at stores as a customer looks at various places in an environment
(Time spent looking at stores) / (total time of gaze recording)
Gaze recording data Relative store
dispersion
Thorough dispersion of stores relative to other main functional service facilities
Average number of stores placed next to or across from each main functional service facility
Layout information Connection to main
routes
Frequency of additional purchase activities occurring on main routes
Average number of additional purchase activities occurring on main routes
Path tracking data Guiding flow by
functional layout
Connection to main functional service places
Frequency of additional purchase activities relative to essential purchase activities
(Average number of additional purchases per customer) / (Average number of essential purchases per customer)
Path tracking data Connection to outside
passengers
The percentage of outside passengers being guided into an environment
(Number of passengers moving into the building) / (total number of people walking by the building)
Path tracking data Guiding more
people to profitable places
Guiding flow from
outside the building Attention from outside
The degree of attention drawn to stores in the environment when seen from the outside
Average number of times a passenger looks into the building from the outside
Gaze recording data Increasing
profitability
Inducing purchase activities Suitability of store characteristics
The ratio of actual purchase activities to the number of times a customer enters stores
(Average number of purchase activities) / (average number of customers walking into each store)
Survey results, count data Flow concentration The relative crowdedness at populated places
compared to places without many customers around
(Average number of people at the 3 most crowded spots) / (average number of people at the 3 least crowded spots)
Count data Balancing flow
population
Route diversity The degree of variety in the paths customers take Number of main routes taken by more than 5% of all sampled customers
Path tracking data Collision frequency The percentage of number of spots prone to collisions
in an environment
(Number of spots with frequent occurrences of bottlenecks and blockages) / (total number of counted spots)
Path tracking data Minimizing
flow congestion
Reducing flow collisions
Collision severity The severity of collisions that occur in an environment Average time taken to pass through areas with bottlenecks
and blockages (seconds) Count data
Wayfinding error rate The frequency of errors occurring as customers find their way
Average number of times a customer shows hesitance or moves in a wrong direction
Path tracking data Wayfinding
completion time
The time taken for a customer to find way through an
environments Average time taken on a path (minutes) Path tracking
data Enhancing layout
understandability
Functional layout perceptibility
The relative perceptibility of main service functional places compared to other places
(Average perceptibility score of places with main service
functions) / (average perceptibility score of other places) Survey results Signage
understandability
The time taken for a customer to understand the contents in a sign
Average time taken on reading a sign before making directional changes (seconds)
Gaze recording data Enhancing
flow efficiency
Increasing wayfinding efficiency
Increasing signage
suitability Time for locating signs
The time taken for a customer to find specific signs in need
Average time taken on gazing through the view to find a proper sign (seconds)
Gaze recording data
29, No. 4. 2010. 8. 31Development of Evaluation Metrics for Pedestrian Flow Optimization in a Complex Service Environment 651
652 Sangwoo Bahn · Chaiwoo Lee · Sanghyun Kwon · Myung Hwan Yun JESK
Daegu station differ from the other 2 stations in their structural characteristics. While the other two stations have a wide open area where passengers move freely in many directions, Seoul Station and East Daegu Station has a long hallway where passengers move back and forth. It can be inferred that such spatial layout maximizes passengers' attention and flow toward profitable places.
Considering the passengers' flow efficiency, Yongsan
Station was evaluated to be the best in most of the metrics.
At Yongsan Station, the flow was more balanced with a less occurrence of collisions. Also, the layout and signs were more easily understood by passengers. Since the spatial layout of Yongsan Station was more open and mixed compared to the other stations, passengers could move freely into various directions, looking at various places in the building. Thus, it can be thought that the structural
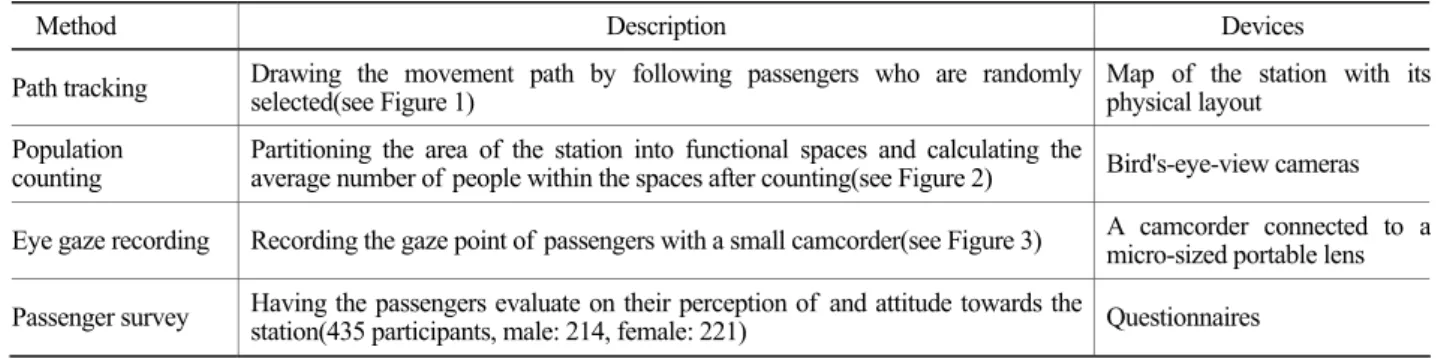
Table 3. Experiment methods
Method Description Devices Path tracking Drawing the movement path by following passengers who are randomly
selected(see Figure 1) Map of the station with its
physical layout Population
counting Partitioning the area of the station into functional spaces and calculating the
average number of people within the spaces after counting(see Figure 2) Bird's-eye-view cameras Eye gaze recording Recording the gaze point of passengers with a small camcorder(see Figure 3) A camcorder connected to a
micro-sized portable lens Passenger survey Having the passengers evaluate on their perception of and attitude towards the
station(435 participants, male: 214, female: 221) Questionnaires
Table 4. Results from evaluation experiment
1st level 2nd level 3rd level Measurement Seoul Yongsan East
Daegu Yongdeungpo
Rate of exposure (time) 0.46 0.4 0.6 0.38
Rate of exposure (population) 0.19 0.22 0.23 0.21
Location perceptibility 1.18 1.01 1.18 1.03
Increasing exposure of profitable places
Share of gaze amount 0.26 0.15 0.17 0.2
Relative store dispersion 0.88 0.83 0.75 0.6
Connection to main routes 1.57 1.57 1.51 1.64 Guiding flow by
functional layout
Connection to main functional
service places 0.62 0.36 0.57 0.41
Connection to outside passengers 0.37 0.32 0.64 0.26 Guiding more
people to profitable places
Guiding flow from
outside the building Attention from outside 0.72 0.4 0.81 0.42
Increasing profitability
Inducing purchase activities Suitability of store characteristics 0.86 0.62 0.74 0.63
Flow concentration 7.61 5.68 6.59 5.77
Balancing flow
population Route diversity 9 13 7 9
Collision frequency 0.62 0.44 0.54 0.59
Minimizing flow congestion
Reducing flow
collisions Collision severity 6.16 4.21 8.35 7.4
Wayfinding error rate 2.31 2.6 1.07 2.48
Wayfinding completion time 30.14 21.35 27.66 22.04 Enhancing layout
understandability
Functional layout perceptibility 1.12 1.12 1.07 1.11
Signage understandability 4.3 7.61 4.82 7.93
Enhancing flow efficiency
Increasing wayfinding efficiency
Increasing signage
suitability Time for locating signs 4.59 3.11 5.86 6.2
characteristics partly caused passengers to form flows in various ways. Also, since the station had a large open area, collisions did not interfere with the flow too much.
5. Discussion and conclusion
Service environments are becoming more complex and multi-functional. Previous studies have tried to assess user behavior solely in the marketing's viewpoint or architectural one. While marketing and architecture have different views, this study suggested an integrated approach. To overcome the limitations of qualitative approach, quantitative metrics was developed to evaluate complex service environments in various dimensions. Using the metrics developed, train stations were evaluated as complex service environments.
Results from evaluation were discussed with relation to the stations' spatial layouts.
This study suggests evaluation metrics to assess pedestrian flow and user behavior in complex service environments quantitatively. The limitation of this study is that only train stations were concerned for the applying developed metrics and only qualitative verification was done. In the future research, quantitative validation, such as revenue analysis or satisfaction comparison between different service environments, is needed. Also, additional case studies should be carried out.
References
Bitner, M. J., Servicescapes: The Impact of Physical Surroundings on Customers and Employees, Journal of Marketing, 56(2), 57-71, 1992.
Braess, D., Nagurney, A. and Wakolbinger, T., On a Paradox of Traffic Planning, Transportation Science, 39(4), 446-450, 2005.
Choi, J. and Lim, C., A Study on the Typological Arialysis and Factors of Visitor Circulation Based On Composition of Exhibition Space in Museum, Journal of the Architectural Institute of Korea, 20(4), 85 -94, 2004.
Choi, Y. and Min, B., A Study on the Influence of Spatial Structure on Wayfinding, Journal of the Architectural Institute of Korea, 14(7), 53-60, 1998.
Cockrill, A., Goode, M. and Emberson, D., Servicescape Matters - Or Does It? The Special Case of Betting Shops, Marketing Intelligence
& Planning, 26(2), 189-206, 2008.
Daamen, W., Hoogendoorn., S. P. and Bovy, P. H. L., First-Order Pedestrian Traffic Flow Theory, Transportation Research Board Annual Meeting, 1-14, 2005.
Grönroos, C. and Ojasalo, K., Service Productivity: Towards a Conceptualization of the Transformation of Inputs into Economic Results in Services, Journal of Business Research, 57, 414-423, 2004.
Hoogendoorn, S. P. and Bovy, P. H. L., Pedestrian Route-Choice and Activity Scheduling Theory and Models, Transportation Research Part B, 38, 169-190, 2004.
Jin, Q., Feng, S., Li-xin, M. and Qun, C., Quantitative Measure for Transportation Network Efficiency, Workshop on Power Electronics and Intelligent Transportation System, 500-504, 2008.
Kim, W. and Moon, Y., Customers' Cognitive, Emotional, and Actionable Response to the Servicescape: A Test of the Moderating Effect of the Restaurant Type, International Journal of Hospitality Management, 28, 144-156, 2009.
Lam, W. H. K., Lee, J. Y. S. and Cheung, C. Y., A Study of the Bi-Directional Pedestrian Flow Characteristics at Hong Kong Signalized Crosswalk Facilities, Transportation, 29, 169-192, 2002.
Lee, S. H., Lee, S. W., Nam, S. and Lee, S. H., A Study of the Behavior Depending On the Characteristics of the Connecting Space between Subway and Shopping Area - Focused on the Subway Station in Seoul, Journal of the Architectural Institute of Korea, 26(1), 517-520, 2006.
Lucas, A., The Determinants and Effects of Slot Servicescape Satisfaction in a Las Vegas Hotel Casino, UNLV Gaming Research & Review Journal, 7(1), 1-17, 2003.
Osaragi, T., Modeling of Pedestrian Behavior and Its Applications to Spatial Evaluation, Proceedings of the Third International Joint Conference on Autonomous Agents and Multi-Agent Systems, 2004.
Papadimitriou, E., Yannis, G. and Golias, J., A Critical Assessment of Pedestrian Behavior Models, Transportation Research Part F, 12, 242-255, 2009.
Park, N., Chang, B. and Kim, Y., A Study on the Spatial Cognition and Circulation in the Underground Passage, Journal of the Architectural Institute of Korea, 23(1),183-186, 2003.
Park, K., Bahn, S., Chang, W., Yun, M. H. and Park, Y., A Systematic Evaluation Method for the Complex Service Space Considering Customer Behavioral Characteristics, Proceedings for Spring Conference of Ergonomics Society of Korea, 2008.
Passini, R., Wayfinding In Architecture, Van Nostrand Reinhold, 1984.
Stepanov, A. and Smith, J. M., Multi-Objective Evacuation Routing in Transportation Networks, European Journal of Operational Research, 198, 435-446, 2009.
Wakefield, K. and Baker, J., Excitement at the Mall: Determinants and Effects on Shopping Response, Journal of Retailing, 74(4), 515-539, 1998.
Wakefield, K. and Blodgett, J., The Effect of the Servicescape on Customers' Behavioral Intentions in Leisure Service Settings, The Journal of Services Marketing, 10(6), 45-61, 1996.
Wakefield, K. and Blodgett, J., Customer Response to Intangible and Tangible Service Factors, Psychology & Marketing, 16(1), 51-68, 1999.
654 Sangwoo Bahn · Chaiwoo Lee · Sanghyun Kwon · Myung Hwan Yun JESK
Yoo, S., Architectural plan configuration and its influence on user's behavior: Way-finding performance and Architectural legibility, Journal of the Architectural Institute of Korea, 12(6), 105-112, 1996.
Sanghyun Kwon [email protected]
Highest degree : B.S., Department of Industrial Engineering, KAIST Position title : M.S. Candidate, Department of Industrial
Engineering, Seoul National Univ.
Areas of interest : HCI, User-Centered Design
Myung Hwan Yun [email protected]
Highest degree : Ph.D. Industrial and Manufacturing Engineering, Penn State University
Position title : Professor, Department of Industrial Engineering, Seoul National Univ.
Areas of interest : Human Factors, UCD, HCI, Kansei-Engineering
Date Received : June 6, 2010 Date Revised : July 22, 2010 Date Accepted : July 22, 2010
Author Listings
Sangwoo Bahn [email protected]
Highest degree : M.S., Department of Industrial Engineering, Seoul National Univ.
Position title : Ph.D. Candidate, Department of Industrial Engineering, Seoul National Univ.
Areas of interest : Affective Quality, UI Design & Evaluation, Usability
Chaiwoo Lee [email protected]
Highest degree : M.S., Department of Industrial Engineering, Seoul National Univ.
Position title : Researcher, Human Interface Systems Lab., Department of Industrial Engineering, Seoul National Univ.
Areas of interest : Usability, User-Centered Design