판정행렬분석을 통한 PET-MRI의 간암 진단성능 평가
Evaluation of the Liver Cancer Diagnosis Function of PET-MRI Based on Decision Matrix Analysis
김진의*, 김정수**, 최남길*, 한재복*
동신대학교 방사선학과*, 동남보건대학교 방사선과**
Jin-Eui Kim([email protected])*, Jung-Soo Kim([email protected])**, Nam-Gil Choi([email protected])*, Jae-Bok Han([email protected])* 요약
최근 임상에서 활용하고 있는 일체형 PET-MRI의 간암 진단능력을 평가하기 위해 2×2 판정행렬을 이 용하여 유용성을 평가하였다. 실험대상의 PET-MRI 검사 결과를 통해 간암 판정 여부 즉 비정상과 정상 판정을 받은 경우는 각각 98건, 51건 이었으며, 세포병리학적 결과가 양성과 음성 판정을 받은 경우는 각각 103건, 62건으로 나타났다. 이 중 두가지 검사에서 진양성의 경우는 95건, 위양성은 3건으로 나타났으며, 진음성은 62건, 위음성의 경우는 5건으로 분석되었다. 실험결과 PET-MRI 검사의 예민도는 95.00%, 특이 도는 95.38%, 위음성률은 0.05%, 위양성률은 0.05%, 정확도는 95.15%로 분석되었다. 따라서 간암의 진단 에 있어 수술 전 병기 결정이나 치료 후 재발 및 원격전이의 발견, 불분명한 원발 림프절 전이 등의 평가 등에 활용 가능성이 높을 것으로 판단되며, 특히 병리학적 검사와의 복합적 진단 및 추적검사를 통해 간암 진단을 위한 PET-MRI 임상적 유용성은 충분할 것으로 사료된다.
■ 중심어 :∣판정행렬∣PE-MRI∣간암∣진단성능∣
Abstract
To evaluate the capability of integrated PET-MRI, which has recently been utilized in the clinical practices, on the diagnosis of liver cancer, its utility was assessed by 2×2 decision matrix. The numbers of abnormal and normal decisions on the liver cancer were 98 and 51 cases, respectively, upon PET-MRI scan results of the subjects, and the numbers of positive and negative decisions were 103 and 62, respectively, upon cytopathologic results. Out of the two tests, 95 cases were shown as true-positive and 3 were false positive, while 62 were true negative and 5 were false negative. Upon the results of PET-MRI test, its sensitivity, specificity, false negative rate, and false positive rate were 95.00%, 95.38%, 0.05%, and 95.15%, respectively.
Therefore, it is considered to have the high potential to use the determination of the stage before the surgery, detections of recurrence and remote metastasis, assessment of uncertain remote lymph node metastasis, and so on in the diagnosis of the liver cancer, and also for the clinical utility of PET-MRI to be sufficient by integrated diagnosis and follow up scan with pathological studies.
■ keyword :∣Decision Matrix∣PET-MRI∣Liver Cancer∣Diagnosis Function∣
접수일자 : 2017년 09월 12일 수정일자 : 2017년 10월 16일
심사완료일 : 2017년 10월 26일
교신저자 : 한재복, e-mail : [email protected]
Ⅰ. Introduction
According to studies, 91% of malignant tumors occurring in the liver are hepatocellular carcinoma, approximately 9% are cholangiocarcinoma and only a small percentage are other cancers[1]. In particular, liver cancer was ranked fourth in 2014 in terms of incidence rate among domestic men[2]. It is ranked second as a cause of death among cancers following lung cancer and had an extremely low five year survival rate of less than 25%[3]. The incidence of liver cancer among those in their 40s to 50s and the share of deaths caused by liver cancer are both ranked first[4]. Compared to other cancer types, it occurs in a relatively younger population and neither the incidence nor death rate have seen decreases in the past ten years. As such, it is seen as a serious issue in korea[5]. The treatment for liver cancer can be categorized into curative therapy that completely removes the tumor, and non-curative therapy that stops the progression of the tumor and reduces its size. If the diagnosis is made when the cancer has progressed, curative therapy is no longer an option[6].
Liver cancer has a high possibility of full recovery if it is discovered early. Even in cases where the cancer has progressed, various types of treatment methods can be used simultaneously for full recovery or extension of the patient’s life[7]. In order to determine the correct treatment for liver cancer and the scope of surgery, as well as evaluate the prognosis of the patient, early diagnosis is more important than anything as with any case of liver malignant tumors[8-10].
In recent years, PET (positron emission tomography) that uses radioactive pharmacological products to evaluate the biochemical metabolism of tissue, and PET-MRI (magnetic resonance imaging) that converges PET and MRI which shows high
contrast for the soft tissue, using non-ionization radiation have been introduced to the domestic and abroad medical community and have been used for the diagnosis of various tumors[11-14]. In addition, many studies on the clinical application have been conducted by comparing them to existing imaging equipment such as ultrasonography and CT (computed tomography)[15]. SNUH (seoul national university hospital) frequently uses PET-MRI to diagnose liver cancer but there are no specific data on the practical benefits of the diagnosis method. As such, this study compares the PET-MRI imaging results of liver cancer patients with pathological opinions and pathological examination results to evaluate the practical benefits of PET-MRI scans for liver cancer patients in a clinical setting.
Ⅱ. Materials and Methods
1. Selection of the Experiment Group
165 patients who had visited the SNUH between January, 2016 and december, 2016 due to liver illness and a possible diagnosis on liver cancer who underwent PET-MRI as well as a pathological examination by the cytopathology department were randomly selected (male; 112, female; 53). Their average age was 58.64±7.23, average height 165.24±8.63 ㎝, and average weight 62.5±7.56 ㎏. To prevent any intake of sugar, patients were banned from eating for at least six hours in advance. Before the experiment, only patients with a BST (blood sugar test) result of 80-120 ㎎/㎗ were selected as subjects. To prevent irregular distribution of the radiopharmaceuticals product in certain muscles, heavy exercise was banned for two days prior to the experiment and normal body temperature was maintained during the experiment. Patients with
diabetes were excluded from the experiment[16].
2. Radiopharmaceuticals
18F-FDG (Fluorodeoxyglucos) was injected to patients using an auto injector (5.18 MBq/kg). They were then asked to take rest for one hour in a place without visual or audio stimuli. During this rest period, 500 ㎖ of water was orally taken. No anticonvulsives (buscopan) or contrast agent (easy-ct) was administered[17].
3. Scan Methods
The integrated PET-MRI equipment BiographTM mMR 3T (SIEMENS, Munich) was used for the experiment[Fig. 1].
Fig. 1. PET-MRI brings the best of both worlds of PET that can diagnose liver cancer by detecting biochemical changes in the body through glucose metabolism, and MRI that can observe in high resolution soft tissue such as the liver. The integrated PET-MRI used in this study allows the artifact due to movement to be minimized as the subjects lie done to have the PET and MRI taken simultaneously. This also helps to shorten the test time which leads to better diagnosis accuracy.
The PET-MRI scan protocol for liver cancer as dictated by the nuclear medicine department of SNUH was applied, and thus the subjects underwent a torso scan to check the whole body. After the test an in-depth analysis of the liver was done with a liver dedication scan that followed immediately afterwards.
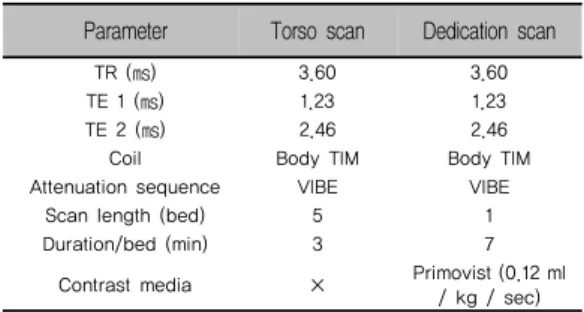
At this point in time, Body TIM (total imaging matrix) coil was attached and VIBE (volumetric interpolated breath-hold examination)-Dixon (TR, repetition time; 3.60, TE, echo time 1; 1.23, TE 2; 2.46) sequence was used. Both the torso scan and the dedication scan were taken[18]. To improve the contrast of the soft tissue, a contrast agent (primovist; 0.25 mmol/ml, Bayer Schering Pharma) was injected intravenously the at a rate of 0.12 ㎖ /kg/sec before scanning[Table 1].
Table 1. Conditions to acquire a PET-MRI image of the torso scan and dedication scan Parameter Torso scan Dedication scan
TR (㎳) 3.60 3.60
TE 1 (㎳) 1.23 1.23
TE 2 (㎳) 2.46 2.46
Coil Body TIM Body TIM
Attenuation sequence VIBE VIBE
Scan length (bed) 5 1
Duration/bed (min) 3 7
Contrast media × Primovist (0.12 ml / kg / sec)
4. Conditions for Scan and Image Reconstruction
The raw data that had been scanned using an integrated PET-MRI equipment is image reconstruction through a 3D iterative method. A gaussian filter is used to realize it in a 172 matrix. For both the torso scan and the dedication scan, attenuation correction and scatter correction were applied[19]. The conditions for image reconstruction and attenuation correction are as follows[Table 2].Table 2. Conditions for PET-MRI image reconstruction of the torso scan and dedication scan Parameter Torso scan Dedication scan Reconstruction 3D Iterative 3D Iterative
Iteration number 2 3
Subset cycle 21 21
Matrix 172 172
Magnification 1.0 1.0
Filter Gaussian Gaussian
FWHM (㎜) 6.0 6.0
Scatter correction ○ ○
5. Data Analysis
After reconstruction the scanned results through iterative method, an interest area for the lesion was set and the SUV (standard uptake value) measured for quantitative analysis. The data of PET-MRI was then analyzed. The acquired image was measured for SUV (max, mean) by setting numerous ROI (region of interest) on lesions suspected to be liver cancer in the subject[20]. The test results were used to determined whether there was indeed liver cancer [Fig. 2].
Fig. 2. A; SUV takes advantage of the fact that radioactive pharmacological products are absorbed by lesions such as cancer to compare the absorption rate across different body weights, heights and body surface areas of patients. B; In clinical settings, semi-quantitative approach is used where a higher level of absorption is seen as a general indicator for a more malignant tumor.
For an analysis of the pathological result, the hospital’s comprehensive medical information system (EMR; electronic medical record, bestcare) was used to review the pathological examination opinion[Fig. 3].
The diagnosis information of the patient thus acquired was entered into a 2 × 2 decision matrix to categorize them as TP (true positive), TN (true negative), FP (false positive) and FN (false negative). Based on the test results thus classified, the sensitivity, specificity, false negative ratio, false positive ratio and accuracy were concluded[21].
Fig. 3. The data analyzed by EMR showed that the
pathological examination for liver cancer
through left hemi-hepatectomy on the
subjects revealed masses and nodular
lesions. Although there were no abnormalities
discovered in the surrounding liver tissue,
the size of the tumor was 3.1 × 2.8 × 2.1
cm and the degree of necrosis of the tumor
was 82.7%. The pathological examination
results clearly allowed for a firm diagnosis
on whether the subject had liver cancer.
Ⅲ. Results
To evaluate the diagnosis function of PET-MRI, a simple 2 × 2 matric was created for analysis. the PET-MRI test results were categorized into two rows of ‘normal’ and ‘abnormal’, while the pathological examination results were categorized into two columns of ‘positive’ and ‘negative’ as to whether there was a disease. Cases where PET-MRI test was abnormal and the pathological results through EMR was positive were categorized as TP, while cases where the former was positive but the latter was negative were categorized as FP. Meanwhile, cases where the PET-MRI test results were normal but the pathological result through the EMR was negative were categorized as TN, and cases where the former was normal but the latter was positive were categorized as FN[Fig. 4][22].
EMR, Phathological results positive (D+)
103
negative (D-) 62
PET-MRI results
abnormal (T+)
98
true positive (TP) A 95
false positive (FP) B 3 normal
(T-) 67
false negative (FN) C 5
true negative (TN) D 62
Fig. 4. For an evaluation on the data of the test, a relatively simple matrix can be used. The test results of the items to be compared are classified into normal or abnormal. Whether the disease is present or not is again used, along with the normal / abnormal categorization to create a matrix made of rows and columns. Applying a mathematical equation, the five indices of sensitivity, specificity, false negative ratio, false positive ratio and accuracy can be calculated. These indices reflect the data of the test.
There were 98 and 51 cases respectively, for those who were deemed abnormal and normal through the PET-MRI test for liver cancer. There were 103 and 62 cases, respectively, for the positive and negative ruling given based on the pathological results through EMR[Table 3].
Table 3. Normal and abnormal cases in the PET-MRI scan and positive and negative cases in the pathological examination using EMR.
abnormal normal
PET-MRI 98 67
positive negative
EMR 103 62
There were 95 cases that fell into the category of TP where liver cancer was diagnosed in both tests.
There were 3 cases of FP where the PET-MRI test result was abnormal, indicating liver cancer but the pathological results were negative. There were 62 case of TN, where PET-MRI test did not give a liver cancer diagnosis and the pathological results were negative, as well. There were five cases of FN where the PET-MRI test gave a normal result but the pathological results gave a positive ruling[Table 4].
Table 4. Case results of TP, FP, TN and FN analyzed by PET-MRI scan and EMR pathological tests
TP FP TN FN
PET-MRI & EMR 95 3 62 5
Using this data, the diagnosis function of PET-MRI for liver cancer can be indirectly analyzed. Sensitivity is the number of TP cases divided by the total number of patients with the disease and represents TPR (true positive ratio). The sensitivity of a test can be acquired even if only subjects with the illness are tested. Nothing can be evaluated on the test results of
subjects that do not have the illness. Specificity is the number of TN cases divided by the total number of patients without the illness and represents TNR (true negative ratio). Specificity of a test can be calculated even if only subjects without the illness are tested.
Likewise, FNR (false negative ratio) is the number of FN cases divided by the number of subjects with the illness[23]. The number of FP cases divided by the number of subjects without the illness is the FPR (false positive ratio). The figure representing the accuracy of a test is the sum of the number of TP cases and TN cases divided by the total number of test subjects[Fig. 5].
Fig. 5. When a mathematical equation is applied to the TP, FP, TN and FN results acquired through a 2 × 2 decision matric analysis, the five indices of sensitivity, specificity, false negative ratio, false positive ratio and accuracy can be calculated. These indices do not vary according to the prevalence rate of the subjects. Therefore, in general, in a screening test such as a group health check-up, tests with high sensitivity rather than high specificity are used. Sensitivity is the value from the number of true positives divided by the number of total patients with the disease [TP/(TP+FN)], and is called as true positive ratio. Specificity is the value from the number of true negatives divided by the number of total patients without the disease [TN/(FP+TN)], and is called as true negative ratio. False negative ratio is the value from the number of false negatives divided by the number of total patients with the disease [FN/(TP+FN)], and the sum of
true positive ratio and false negative ratio is always ‘1.’ False positive ratio is the value from the number of false positives divided by the number of total patients without the disease [FP/(TN+FP)], and the sum of true negative ratio and false positive ratio is always ‘1.’ Accuracy is the value from the number of true positives and true negatives divided by the number of total patients in decision matrix.
Sensitivity is the ability to diagnose a positive result for liver cancer in an ‘abnormal’ subject, while specificity refers to the ability to diagnose a negative result for liver cancer in a ‘normal’ subject. False negative ratio is the percentage of cases where the diagnosis is given as negative even though there is liver cancer, while false positive ratio is the percentage of cases where the diagnosis is given as positive even though there is no liver cancer. Using the five indices concluded through the data analysis, the diagnosis function of the PET-MRI test can be evaluated. The experiment results show sensitivity to be 95.00%, specificity to be 95.38%, false negative ratio to be 0.05%, false positive ratio to be 0.05% and accuracy to be 95.15%.
According to related studies that conducted experiments using a similar method, the sensitivity and the specificity of existing CT or MRI in liver cancer diagnosis were 67.12% and 92.38%, respectively[24]. For PET-CT that is gaining popularity as a nuclear medicine test, the sensitivity and the specificity were reported to be 88.7% and 91.7%, respectively[25]. In particular, ultrasonography was found to be 94.8% but according to the author of the study, ultrasonography can be significantly affected by subjective factors and as such, a singular result from ultrasonography test alone cannot give a definite diagnosis of liver cancer[26]. In addition, there were studies to show the remarkable enhancement of the diagnostic capability upon diagnosis of liver
cancer together with accurate imaging diagnosis such as CT and MRI scan according to the results of clinical pathology or cytohistologic studies[27].
Therefore, the integrated PET-MRI test for liver cancer diagnosis seems to have a higher diagnosis function compared to existing diagnosis methods using imaging.
Ⅳ. Discussion
Blood test, which is one of the methods used for the diagnosis of liver cancer, conducts a selective test by using the AFP (alpha-fetoprotein) levels[28]. But since there are less than 50% of cases of early liver cancer where AFP increases above the marginal level, pathological tests alone cannot be enough for the diagnosis; histological examinations, ultrasonography, and imaging tests such as CT, MRI or PET must also be conducted for an accurate diagnosis[29].
For a long time, due to the difference in how physical images are acquired in a PET and MRI, the convergence of these two equipment has been limited[30]. But effort to the recent development of image acquisition devices, an integrated equipment is made possible. Such equipment have been introduced to the korean medical community as well, leading to active studies on related subjects. This study analyzed a relatively simple 2 × 2 decision matrix for the experiment data for analysis. Although subjective judgment should not be involved in image analysis in order to evaluate experiments on image tests, such judgment cannot be completely excluded and thus must be taken into account. According to related studies, in such cases, the test opinion can be evaluated using a 2 × n decision matrix and a true positive rate for all the n number of opinions can be calculated[31]. There can also be cases where the
interpretation of images is impossible due to the lack of cooperation on the patient’s part or technical issues with the equipment. In such cases, for an accurate measurement of sensitivity and specificity, items that are illegible should be added to the 2 × n matrix so that they are included in the analysis mediating variables. The number of illegible data are reflected onto the distribution of sensitivity and specificity, leading to the decrease of both. In addition, there could be factors that may affect the evaluation of all data necessary for the experiment. A confirmation of whether the patient has the illness and errors due to the subjective judgment of the image reader are such examples. Experimental errors can also occur in the process of comparing data, such as during the diagnosis process, review of the diagnosis, review of the test and intervention bias[32].
This study is limited in that it has a small number of subjects, 165 subjects in total. This leads to the small number of patients with a specific illness to be over the mean, leading to a relatively smaller size of the patient group. This is why a prospective study using a larger patient group is needed. This study was conducted on patients and should be compared against objective data using a phantom, but such comparison was not applied, making the study limited. Therefore, many clinical experiments are needed in order to generalize the study findings.
Ⅴ. Conclusion
The integrated PET-MRI that combines the strengths of the PET that gives the biochemical information of cancer cells on a molecular level, and the strengths of an MRI that gives high contrast for soft tissue such as the liver allows for observation from anatomical, physiological, metabolical and
molecular perspective. That is, in a quantitative analysis of the malignancy of the tissue using SUV and high resolution MRI for the soft tissue showed an accuracy of 95% or higher in the imaging diagnosis of liver cancer. In particular, the five indices of sensitivity, specificity, false negative ratio, false positive ratio and accuracy were found to be more effective compared to those of existing diagnosis methods using imaging. Therefore, the equipment is expected to have a high applicability in determining the staging before surgery for liver cancer, discover of recurrence or remote metastasis after treatment and evaluation of transfer to the remote lymph nodes.
In particular, an integrated diagnosis and tracking using pathological tests together can increase the practical benefits of PET-MRI in clinical settings to a sufficient level.
참 고 문 헌
[1] Ahmedin Jemal, Freddie Bray, Melissa M.
Jacques Ferlay, Elizabeth Ward, and David Forman, “Global cancer statistics,” Ca cancer J Clin., Vol.61, pp.69-90, 2011.
[2] K. W. Jung, Y. J. Won, C. M. Oh, H. J. Kong, D. H. Lee, and K. H. Lee, “Cancer statistics in korea: incidence, mortality, survival, and prevalence in 2014,” Cancer research and Treatment, Vol.49, No.2, pp.292-305, 2017.
[3] Ran Xu Zhu, Wai-Kay Seto, Ching-Lung Lai, Man-Fung Yuen, M. J. Daly, and R. E. Henly,
“Epidemiology of hepatocellular carcinoma in the asia-pacific region,” Gut Liver, Vol.10, No.3, pp.332-339, 2016.
[4] S. K. Yoon and H. G. Chun, “Status of hepatocellular carcinoma in south korea,” Chin Clin Oncol, Vol.2, No.4, p.39, 2013.
[5] E. Y. Lee, T. T. Xuan Mai, Y. J. Chang, and M.
R. Ki, “Trends of liver cancer and its major risk factors in korea,” Epidemiol Health, Vol.37, p.e2015016, 2015.
[6] Robert G. Gish, Richard S. Finn, and Jorge A.
Marrero, “Extending survival with the use of targeted therapy in the treatment of hepatocellular carcinoma,” Gastroenterol Hepatol, Vol.9, No.4, suppl.2, pp.1-24, 2013.
[7] Josep M. Llovet, Maria Isabel Real, Xavier Montaña, Ramon Planas, Susana Coll, John Aponte, Carmen Ayuso, Margarita Sala, Jordi Muchart, Ricard Solà, Joan Rodés, and Jordi Bruix, “Arterial embolisation or chemoembolisation versus symptomatic,” Lancet, Vol.359, pp.1734-1739, 2002.
[8] Gerald D. Dodd, Michael C. Soulen, Robert A.
Kane, Tito Livraghi, William R. Lees, Yasuyuki Yamashita, Alison R. Gillams, Okkes I. Karahan, and H. C. Rhim, “Minimally invasive treatment of malignant hepatic tumors: at the threshold of a major breakthrough,” Radiographics, Vol.20, pp.9-27, 2000.
[9] D. G. Farmer, M. H. Rosove, A. Shaked, and R W. Busuttil, “Current treatment modalities for hepatocellular carcinoma,” Ann Surg, Vol.219, pp.236-247, 1994.
[10] F. F. Haddad, W. C. Chapman, J. K. Wright, T.
K. Blair, and C. W. Pinson, “Clinical experience with cryosurgery for advanced hepatobiliary tumors,” J Surg Res., Vol.75, pp.103-108, 1998.
[11] Eric C. Ehman, Geoffrey B. Johnson, Javier E.
Villanueva-Meyer, S. M. Cha, Andrew Palmera Leynes, Peder Eric Zufall Larson, and Thomas A. Hope, “PET/MRI: Where might it replace PET/CT?,” J Magn Reson Imaging, doi:10.1002/jmri.25711, 2017.
[12] Felix Nensa, Karsten Beiderwellen, Philipp
Heusch, and Axel Wetter, “Clinical applications of PET/MRI: current status and future perspectives,” Diagn Interv Radiol, Vol.20, No.5, pp.438-447, 2014.
[13] W. Atkinson, C. Catana, J. S. Abramson, G.
Arabasz, S. McDermott, O. Catalano, V. Muse, M. A. Blake, J. Barnes, M. Shelly, E. Hochberg, B. R. Rosen, and A. R. Guimaraes, “Hybrid FDG-PET/MR compared to FDG-PET/CT in adult lymphoma patients,” Abdom Radiol, Vol.41, pp.1338-4138, 2016.
[14] C. M. Tempany, J. Jayender, T. Kapur, T.
Kapur, R. Bueno, A. Golby, N. Agar, and F. A.
Jolesz, “Multimodal imaging for improved diagnosis and treatment of cancers,” Cancer, Vol.121, pp.817-827, 2015.
[15] Toshio Wagai, “Studies on the foundation and development of diagnostic ultrasound,” Proc Jpn Acad Ser B Phys Biol Sci., Vol.83, No.8, pp.256-265, 2007.
[16] A. Samarin, M. Hüllner, M. A. Queiroz, P.
Stolzmann, I. A. Burger, G. Von Schulthess, and P. Veit Haibach, “18F-FDG-PET/MR increases diagnostic confidence in detection of bone metastases compared with 18F-FDG-PET/CT,”
Nucl Med Commun., Vol.36, No.12, pp.1165-1173, 2015.
[17] K. Beiderwellen, M. Huebner, P. Heusch, J.
Grueneisen, V. Ruhlmann, F. Nensa, H. Kuehl, L. Umutlu, S. Rosenbaum-Krumme, and T. C.
Lauenstein, “Whole-body [18F]FDG PET/MRI vs. PET/CT in the assessment of bone lesions in oncological patients: initial results,” Eur Radiol., Vol.24, No.8, pp.2023-2030, 2014.
[18] K. Beiderwellen, L. Geraldo, V. Ruhlmann, P.
Heusch, B. Gomez, F. Nensa, L. Umutlu, and T.
C. Lauenstein, “Accuracy of [18F]FDG PET/MRI for the detection of liver metastases,” PLoS
ONE, Vol.10, No.9, p.e0137285, 2015.
[19] Philipp Heusch, Felix Nensa, Benedikt Schaarschmidt, Rupika Sivanesapillai, Karsten Beiderwellen, Benedikt Gomez, Jens Köhler, Henning Reis, Verena Ruhlmann, and Christian Buchbender, “Diagnostic accuracy of whole-body PET/MRI and whole-body PET/CT for TNM staging in oncolog,” Eur J Nucl Med Mol Imaging, Vol.42, No.1, pp.42-48, 2015.
[20] Ali Civelek, Anshuma Rana, Ashkan Malayeri, Justin Rodante, Amit Dey, Nehal Mehta, and David Bluemke, “PET-MRI derived 18F-FDG liver SUV metrics: effects of hepatic steatosis and comparison with PET-CT,” J Nucl Med., Vol.58, No.1, p.455, 2017.
[21] Kathy Schilling, Deepa Narayanan, Judith E.
Kalinyak, Juliette The, Maria Victoria Velasquez, Simone Kahn, Matthew Saady, Ravinder Mahal, and Larraine Chrystal,
“Positron emission mammography in breast cancer presurgical planning: comparisons with magnetic resonance imaging,” Eur J Nucl Med Mol Imaging, Vol.38, No.1, pp.23-36, 2011.
[22] Ahmet Mert, Niyazi Kılıç, Erdem Bilgili, and Aydin Akan, “Breast cancer detection with reduced feature set,” Comput Math Methods Med., doi:10.1155/2015/265138, 2015.
[23] A. Marcano-Cedeño, Paloma Chausa, Alejandro García, César Cáceres, Josep M. Tormos, and Enrique J. Gómez, “Data mining applied to the cognitive rehabilitation of patients with acquired brain injury,” Exp Sys Appl., Vol.40, No.4, pp.1054-1060, 2013.
[24] Dushyant V. Sahani and Sanjeeva P. Kalva,
“Imaging the liver,” The Oncologist, Vol.9, No.4, pp.385-397, 2004.
[25] Claudio Spick, Ken Herrmann, and Johannes
Czernin, “18F-FDG PET/CT and PET/MRI perform equally well in cancer: evidence from studies on more than 2,300 Patients,” J Nucl Med, Vol.57, No.3, pp.420-430, 2016.
[26] Ruben Hernaez, Mariana Lazo, Susanne Bonekamp, Ihab Kamel, Frederick L. Brancati, Eliseo Guallar, and Jeanne M. Clark, “Diagnostic accuracy and reliability of ultrasonography for the detection of fatty liver: a meta-analysis,”
Hepatology, Vol.54, No.3, pp.1082-1090, 2011.
[27] Eldad S. bialecki and Adrian M. Di Bisceglie,
“Diagnosis of hepatocellular carcinoma,”
HPB(Oxford), Vol.7, No.1, pp.26-34, 2005.
[28] A. Abbasi, A. R. Bhutto, N. Butt, and S. M.
Munir, “Corelation of serum alpha fetoprotein and tumor size in hepatocellular carcinoma,” J Pak Med Assoc, Vol.62, No.1, pp.33-36, 2012.
[29] Marialuigina Fruscella, Antonio Ponzetto, Annalisa Crema, and Guido Carloni, “The extraordinary progress in very early cancer diagnosis and personalized therapy: the role of oncomarkers and nanotechnology,” J Nanotech, doi:10.1155/2016/3020361, 2016.
[30] Bing Bai, Quanzheng Li, and Richard M.
Leahy, “MR guided PET image reconstruction,”
Semin Nucl Med., Vol.43, No.1, pp.30-44, 2014.
[31] Andrew J. Vickers, “Decision analysis for the evaluation of diagnostic tests, prediction models and molecular markers,” Am Stat., Vol.62, No.4, pp.314-320, 2008.
[32] Peter R. Killeen, “Beyond statistical inference:
A decision theory for science,” Psychon Bull Rev., Vol.13, No.4, pp.549-562, 2006.
저 자 소 개
김 진 의(Jin-Eui Kim) 정회원
▪2016년 3월 ∼ 현재 : 동신대학 교 대학원 방사선학과 박사과정
▪1992년 3월 ∼ 현재 : 서울대학 교병원 핵의학과
<관심분야> : 핵의학, 방사선물리
김 정 수(Jung-Soo Kim) 정회원
▪2003년 3월 ∼ 2014년 : 서울대 학교병원 핵의학과
▪2014년 8월 : 고려대학교 의학물 리학과(이학석사)
▪2015년 3월 ∼ 현재 : 고려대학 교 의학물리학과(박사수료)
▪2015년 3월 ∼ 현재 : 동남보건대 학교 방사선과 교수 <관심분야> : 의학물리, 분자영상
최 남 길(Nam-Gil Choi) 정회원
▪1989년 8월 : 조선대학교 대학원 화공식품전공(공학석사)
▪2009년 8월 : 동신대학교 대학원 방사선물리학과(이학박사)
▪1980년 ∼ 2010년 : 전남대학교 병원 영상의학과
▪2011년 3월 ∼ 현재 : 동신대학교 방사선학과 교수 <관심분야> : 보건통계, 방사선물리
한 재 복(Jae-Bok Han) 정회원
▪2003년 2월 : 호남대학교 컴퓨터 공학과(공학사)
▪2007년 2월 : 전남대학교 전자공 학과(공학석사)
▪2013년 8월 : 전남대학교 전자공 학과(공학박사)
▪2009년 ∼ 현재 : 동신대학교 방사선학과 교수 <관심분야> : 객체분할, 의료영상압축