- 39 -
Self-Organizing Maps with statistical Phase Synchronization (SOMPS) algorithm
Chang Sik Kim*, Hong Joon Tcha**, Cheol-Soo Bae***, Moon-Hwan Kim****
ABSTRACT
Developing computational methods for identifying cell cycle-regulated genes has been one of important topics in systems biology. Most of previous methods consider the periodic characteristics of expression signals to identify the cell cycle-regulated genes. However, we assume that cell cycle-regulated genes are relatively active having relatively many interactions with each other based on the underlying cellular network. Thus, we are motivated to apply the theory of multivariate phase synchronization to the cell cycle expression analysis. In this study, we apply the method known as "Self-Organizing Maps with statistical Phase Synchronization (SOMPS)", which is the combination of self-organizing map and multivariate phase synchronization, producing several subsets of genes that are expected to have interactions with each other in their subset (Kim, 2008). Our evaluation experiments show that the SOMPS algorithm is able to detect cell cycle-regulated genes as much as one of recently reported method that performs better than most existing methods
1. Introduction
Due to recent high-throughput DNA microarray technology, cell cycle analysis using gene expression has been considered as an important topic in systems biology. There has been several genome-wide DNA microarray studies monitoring periodic pattern of expression in Saccharomyces cerevisiae (Cho et al., 1998;
Spellman et al., 1998), human fibroblasts (Cho et al., 2001), HeLa cells (Whitfield et al., 2002), Schizosaccharomyces pombe (Rustici et al., 2004), and etc. The budding yeast data sets in
particular havebeen widely used for the development of various computational methods for identifying periodically expressed genes (Cho et al., 1998; Spellman et al., 1998; Johansson et al., 2003; de Lichtenberg et al., 2005; Luan and Li, 2004; Lu et al., 2004; Zhao et al., 2001). Most of them have concluded the periodically expressed subset of yeast genome to comprise about 300-800 genes by only considering the characteristics of periodicity in expression signals. For instance, Spellman et al. (1998) and de Lichtenberg et al. (2005) apply a Fourier-like or Fourier scores to measure the periodicity of
* 숙명여자대학교 겸임교수
** 강원대학교 컴퓨터과학과 교수([email protected])
*** 관동대학교 정보통신공학과 교수([email protected])
**** (주)한국전파기지국 연구소장([email protected])
expression signals. However, we assume that cell cycle-regulated genes are active having relatively many interactions with each other during cell cycle. Therefore, we are motivated to use the theory of multivariate phase synchronization (Allefeld and Kurths, 2004). The basic idea of multivariate synchronization analysis is to perceive the oscillating systems as a cluster, in which each component system participates in with different degree. The cluster consists of a common rhythm (or mean field oscillation). This mean field is not predetermined, but comes from interactions within the cluster.
By combining self-organizing map and multivariate phase synchronization analysis, we apply the method knownas Self-Organizing Map with Phase Synchronization (SOMPS) algorithm (Kim, 2008) for identifying cell cycle-regulated genes using cell cycle expression data.
To evaluate SOMPS, we create synthetic expression signals that are globally coupled as an ensemble using the Kuramoto model (Strogatz, 2000). We provide the performance of SOMPS as a function of noise included in synthetic data and cutoff. We also evaluate SOMPS using yeast data set and the performance is compared with one of recent methods by de Lichtenberg et al. (2005).
2. Methods
2.1 Analytic Signal and Hilbert Transform
This study focuses on the oscillating systems containing internal source of energy, which are transformed into oscillatory movements. The SOMPS algorithm is basically based on the theory of phase synchronization, which is generally considered as the complete coincidence of the states of individual systems (Rosenblum et al., 1996). This can result from an interaction
between systems (Pikovsky, 1984a) as well as from the influence of external forces (Pikovsky, 1984b). The phase of a responding arbitrary signal x(t) from a system can be determined by using the complex analytic signal (Gabor, 1946).
The analytic signal is a function of time and can be defined as follows
( )t x( )t ix ( )t,
xa = + h (1)
where i is the imaginary unit and xh(t)is the Hilbert transform (HT) of x(t)
( ) ( )
ò-+¥¥ -
= 1 - t, t
p t d
t t x
xh
(2) in which the integration of HT is performed in the sense of the Cauchy principal value. The analytic signal is further decomposed in terms of complex polar coordinates as
( )t A( )t exp( i ( )t ),
xa = - f (3)
where A(t) = |xa(t)| and (t) = arg[xa(t)].
These two functions are respectively called the instantaneous amplitude and phase of the signal x(t).
2.2 Bivariate Phase Synchronization
In the case with two self-sustained oscillators, phase synchronization is defined as locking of the phases as described as early in the 17th century by Huygens (1673). The phase locking between two oscillating systems is defined as x,y =mx − ny= const., where x and y are the phase of time series x(t) and y(t) respectively, x,yis the generalized phase difference between x(t) and y(t), and m and n are certain positive numbers (Rosenblum et al., 1996). In this study, the phase synchronization is restricted to the case m = n = 1 and suffices are dropped for clarity with an assumption that the oscillating signals come from the same physiological systems. In statistical phase synchronization, the strength of synchronization between each two oscillators can be measured by a static on the
distribution of their phase difference as follows
( ) ( )
( )
( ),
1 exp
1
, å
=
-
=
n
t
y x y
x i t t
R n f f
(4) where n is the number of samples points on time signals. Rx,y takes a range from 0 to 1, describing a continuum between no and perfect synchronization (Bhattacharya, 2001).
2.3 Multivariate Phase Synchronization
For a collection of oscillators whose elements interacts with each other forming a certain complex process, synchronization phenomena in the large ensemble of oscillators is noted as synchronization cluster, in which each oscillator participate in different degrees (Allefeld and Kurths, 2004). Let’s consider an ensemble of non-identical oscillators to understand the process of collective synchronization. From the previous section, it is understood that a pair of oscillators can be synchronized, and it is excepted synchronization can be extended to a whole population of oscillators, or at least a large portion of it. Pikovsky et al.(2001) describe the synchronization cluster as globally coupled oscillators, in which each oscillator of ensemble is driven by the mean field that is formed by all oscillators. This mean field (or common force) is not predetermined, but results from interactions within the ensemble. This mean field influences on whether the oscillators in ensemble synchronize, but itself depends on their oscillation. For each time measurement of all oscillators, the phase of mean field is defined as a circular weighted mean of all phases inside the cluster
( )= å ( ( ))
F
j
i
j i t
m
t arg exp f
, (5)
where the participation index mj can be obtained as a function of the synchronization strength between an oscillator and the cluster as
follows,
( jc)
j f R
m = ,
with
( ) ( )
( )
( )
å -F
=
n
t
c j c
j i t t
R n1 exp f
, . (6)
The partition index mj measuresboth how close each oscillator inside the cluster follows the mean field Φc as well as how much a system contribute to the cluster. However, it is not clear which function f should be chosen for the relationship between the Rj,c and the mj. To fill this gap, Allefeld and Kurth (2004) provide the synchronization cluster algorithm for the estimation of the Rj,c, provided that all of input signals make contributions to the cluster.
2.4 Multicluster Multivariate Phase Synchronization
For a complex system consisted of multiple separate sub-processes, it is necessary to estimate the mean field for each ensemble of sub-process. To do this, we applied the self-organizing map with phase synchronization (SOMPS) algorithm (Kim, 2008), which is the combination of the self-organizing map algorithm and Eq. 6. The general topology of an SOM could be 1, 2, or 3D-network of interconnected nodes, of which learning algorithm involved the mapping of input vectors representing some features onto specific nodes over the training phase. Each node in SOMPS corresponds to the mean field Φcrepresenting the common rhythm or driving forces for a specific sub-process.
During training steps, each mean field Φc evolves to be the most likely representing the mean field of a certain cluster, which is consisted of oscillators involved in the specific sub-process. In each training step, one sample phase j from input data set is randomly chosen and the phase synchronization strength is calculated between j and all the mean fields
using Eq. 6. The mean field Φc that has the strongest synchronization strength Rj,c is selected as a "winning" mean field to be updated, i.e. Rj,c = maxk{Rj,k}, where k is the index of mean fields in SOMPS. After selecting the "winning" mean field, the mean fields and its topological neighbors are updated with following updating rule
( ) ( ) ( ) ( )
c jc c c
c
r R h t t
t ¶F
+ ¶ F
= +
F 1 a
(7) where α(t) is a learning rate that depends upon the iteration time t. The function hc(r) is called the neighbor function. In this study, the Gaussian neighborhood function is used
( ) ,
exp 2 2
2
÷
÷ ø ö ç
ç è
æ -
-
= r
l r l
hc c i
(8) where lc is the location of selected mean field, lithe location of each mean field in the structure of SOM, and r the neighborhood radius. The training procedure continues until a specified number of training iterations is completed. Once SOMPS training is done, each input phase j is assigned to its most coupled mean field, i.e. Rj,c = maxk{Ri,k}, where k is the index of mean fields.
3. Results
3.1 In Silico Experiment
The purpose of this experiment is to show the effectiveness of SOMPS algorithm for identifying the signals from a certain specific process. In this study, it is assumed that a certain group of gene expression levels during cell cycle can be explained as the synchronization of a large ensemble of oscillators. It is also assume that elements from the ensemble interacts with each other and is driven by the mean field that is formed by all elements, provided that each member
from the group plays a role for a certain biological process. The mean field is not predetermined, but arises from the interactions within the ensemble, and this force determines whether the systems synchronize, but itself depends on their oscillation.
To create the synthetic cell cyclic gene expression, we use the Kuramotomodel that is originally motivated by the phenomenon of collective synchronization, in which an enormous system of oscillators spontaneously locks to a common frequency (Strogatz, 2000). This phase governing equation that gives the long-term dynamics of globally coupled oscillators is described as
( )
å Y- =
=
N
j
j
i C i N
dt
df sin f , 1,K,
where the is are the instantaneous phase, the is the mean field, the positive constant C corresponds to the coupling strength, and N the number of genes. Note that the natural frequencies of the individual oscillators are excluded in this study and the mean field is roughly estimated by averaging the phase of all oscillators at current time points. With this model, it is assumed the instantaneous rate of phase change is proportional to the mean sinusoidal coupling between the mean field and each instantaneous phase. Given a set of random initial condition and a step size t, we can simulate the instantaneous phase for each gene as follows
( ) ( ) ( )
.
1 dt
t td t
t i i
i
d f f
f + = +
To this end, the synthetic expression signal can be created with the conversion of the simulated instantaneous phase into real signals as follows
( )t real[Aexp(j ( )t )],
xi = fi
where j is the imaginary unit and A the instantaneous amplitude that is set to 1 for all signals. Then the synthetic signals are updated by adding random noise from the Gaussian distribution with mean = 0 and standard deviation.
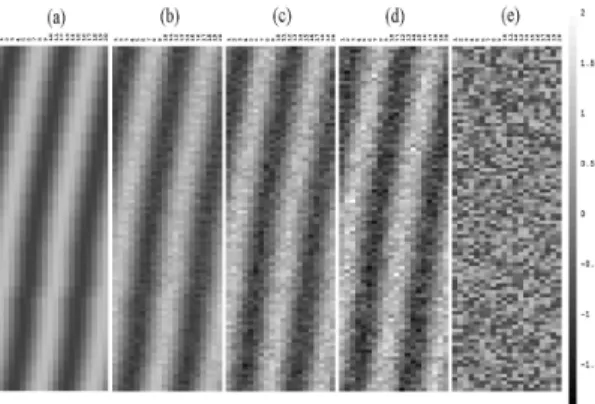
To evaluate the SOMPS algorithm, we generate four sets of synthetic expression signals with four different =0.1, 0.2, 0.3, 0.4. For each set, we generate a group of expression signals with N = 100, 20 time points, and the coupling strength C =3.0. For each set, we also generate a group of random signals with the same number of time points and N = 900 and this random group is combined with the synthetic expression signals. Then, we randomly shuffle the location of all expression signals for each set. Figure 1 shows three groups of sorted synthetic signals with noise, a group of signals without any noise, and random signals, in which the change of synthetic signals is displayed as the noise level increases from 0.0 to 0.3.
Fig. 1. Synthetic expression data by Kuramoto model: (a)ε=0.0, (b)ε=0.1, (c)ε=0.2, (d)ε=0.3, and (d)
random data
SOMPS is trained withthese four sets of synthetic expression signals, and each SOMPS is trained for 500 cycles. For each SOMPS, we create 1D-network of interconnected mean field nodes with the size of 10 and the radius of neighbor r = 1. Once SOMPS training is done, each input phase i is assigned to its most coupled mean field c. Each signal is selected only if its phase strength with assigned mean field is greater than predefined cutoff, i.e. Ric cutoff. It is noteworthy that only a node among
all trained ones has a sinusoidal periodicity (Fig.
2a) and only this node contains the majority of true positive synthetic signals, and this node is therefore considered for the evaluation of the performance of SOMPS.
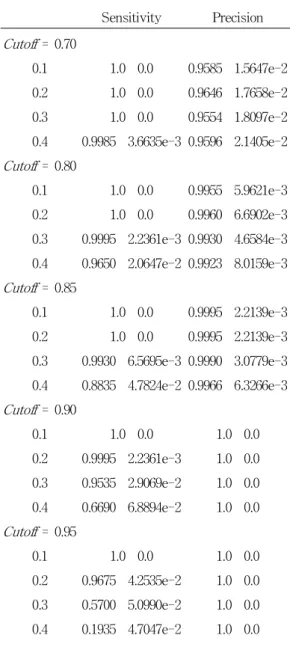
We compute the sensitivity = TP/(TP+FN) and the precision = TP/(TP+FP), where TP is the number of true positives, FN the number of false negatives, and FP the number of false positives.
Then, we systematically compare the sensitivity and precision for different cutoff and noise level (Table 1). To evaluate the variability of the results, we run SOMPS 20 times for each noise level . Note that the synthetic expression signals are different for each run due to random generations of initial phase signals and random noise addition, and the initial mean fields for trainingSOMPS are different due to random generation. Thus, the results are expected to have certain degree of variability. Table 1 shows that the more noises are included in synthetic expression, the less sensitivity are obtained by SOMPS. On the other hand, the overall precision is relatively less affected than sensitivity by the noise, i.e. precision 95%. It means that at least 95% of output signals are TP signals. It is also shown that the sensitivity is almost 100% with cutoff = 0.7 for all noise level . If we assume that the noise level 0.4, the cutoff value to obtain the sensitivity 100% and the precision 95%
should be 0.7. Therefore, we conclude that the cutoff value 0.7 could be used for the analysis of real yeast expression data to evaluate SOMPS, provided that the noise level in yeast data is 0.4. This could be reasonable assumption because it is believed that = 0.4 is relatively large.
We compare the selected mean field (Fig. 2) and three examples of output synthetic signals.
Figure 3 provides mainly two cases of comparison: 1) the mean field and input signal are expressed simultaneously (Fig. 2a), 2) the mean field and input signals are expressed with
constant time shift (Fig. 3b-c). It is noteworthy that the conventional SOM using Euclidean distance for training is not able to obtain these expression signals with constant time shift because these signals should have relatively low linear correlation with trained mean field.
Table 1. Sensitivity and precision of SOMPS with synthetic data.
Sensitivity Precision Cutoff= 0.70
0.1 1.0 0.0 0.9585 1.5647e-2 0.2 1.0 0.0 0.9646 1.7658e-2 0.3 1.0 0.0 0.9554 1.8097e-2 0.4 0.9985 3.6635e-3 0.9596 2.1405e-2 Cutoff= 0.80
0.1 1.0 0.0 0.9955 5.9621e-3 0.2 1.0 0.0 0.9960 6.6902e-3 0.3 0.9995 2.2361e-3 0.9930 4.6584e-3 0.4 0.9650 2.0647e-2 0.9923 8.0159e-3 Cutoff= 0.85
0.1 1.0 0.0 0.9995 2.2139e-3 0.2 1.0 0.0 0.9995 2.2139e-3 0.3 0.9930 6.5695e-3 0.9990 3.0779e-3 0.4 0.8835 4.7824e-2 0.9966 6.3266e-3 Cutoff= 0.90
0.1 1.0 0.0 1.0 0.0
0.2 0.9995 2.2361e-3 1.0 0.0 0.3 0.9535 2.9069e-2 1.0 0.0 0.4 0.6690 6.8894e-2 1.0 0.0 Cutoff= 0.95
0.1 1.0 0.0 1.0 0.0
0.2 0.9675 4.2535e-2 1.0 0.0 0.3 0.5700 5.0990e-2 1.0 0.0 0.4 0.1935 4.7047e-2 1.0 0.0
Fig. 2. Trained mean fields of SOMPS with synthetic expression data.
Fig. 3. Comparison of trained mean field and three examples of output synthetic expression signals. The dashed lines corresponds to the trained mean field and the solid line the synthetic
expression signals.
3.2 Saccharomyces cerevisiae cell cycle gene expression data analysis
We evaluate SOMPS with the expression data sets (Alpha, Cdc15, and Cdc28) from the study of Spellman et al. (1998). We normalize the expression signals to the standard variable, i.e.
x(t) = (z(t)-)/ where z(t) is an input expression
signal, then the corresponding normalized expression x(t) has the mean 0 and variance 1.
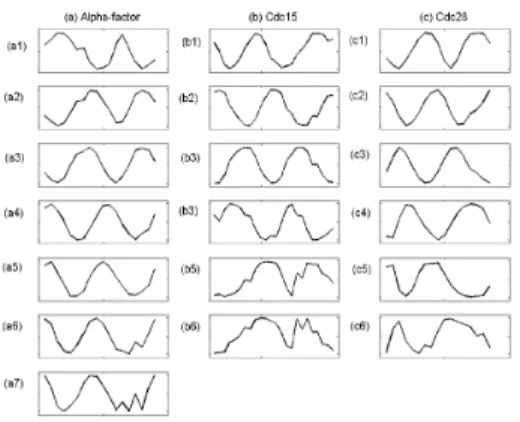
For training SOMPS in this experiment, we create the 1D-network of nodes with the size of 20 and the radius of neighbor r = 4. Then, each SOMPS is trained for 500 cycles. After training, we select the mean fields that display sinusoidal periodicity, i.e. 7 for alpha factor, 6 for cdc15, and 6 for cdc28 data (Fig. 4), and cutoff = 0.7 is used based on the in silico experiment.
Fig. 4. The selected mean fields after training of SOMPS with yeast data: (a) Alpha-factor, (b)
Cdc15, (c) Cdc28.
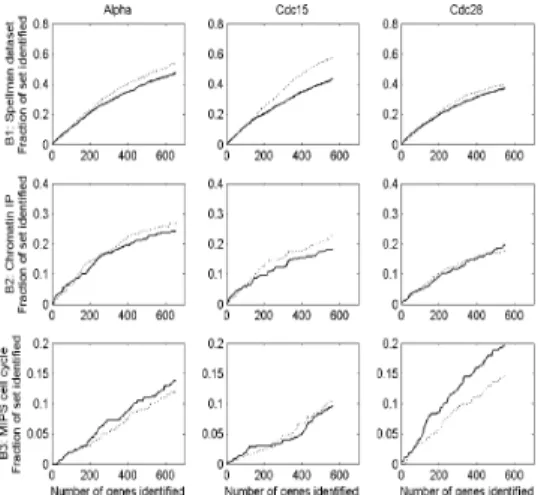
We compare the performance of SOMPS with one of recent methods for the identification of cell cycle-regulated genes (de Lichtenberg et al., 2005). They present a simple permutation-based method that performs better than most existing methods, in which two statistical tests for regulation and periodicity are combined.They calculate the standard deviations of each log-ratio profile for the significance of regulation and the Fourier scores for periodicity. We benchmark the methods by measuring their ability to identify genes from three benchmark sets: B1) 799 genes identified as periodically expressed by Spellman et al. (1998), B2) 352 genes identified as cell cycle-regulated by Chromatin IP studies by Simon et al. (2001) and
Lee et al. (2002), and B3) 518 genes annotated in MIPS (Mewes et al., 2002) as ‘cell cycle and DNA processing’. For direct comparison between SOMPS and permutation-based method, we assign the rank for each expression signals based on the phase synchronization strength between each selected signal and its mean field.
This strength value quantifies both how close an oscillator follows the common rhythm (or mean field) and how important it is in its contribution to its cluster.
Figure 5 shows the performance of each method on each individual expression data set.
The ranked lists from both methods are plotted as curves, showing the percentage of genes in a benchmark set recovered as a function of rank.
Although one method is better than the other one depending on the expression data sets or benchmark sets, there is no absolute indication such that one method outperforms the other.
Because the permutation-based method is proven to be effective in identifying cell cycle-regulated genes, the result from SOMPS also enrich for genes previously identified as periodicity and genes associated with known cell cycle transcription factors.
Fig. 5. Comparison between SOMPS and permutation-based method. The fraction of the benchmark set that is identified is plotted as a
function of gene rank for each method, experiment and benchmark set. The solid line corresponds to SOMPS and the dashed line the
permutation-based method.
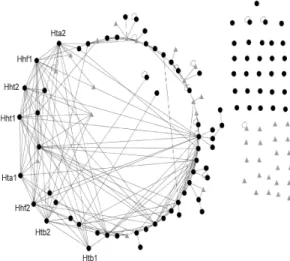
To understand the significance of cutoff value, the P-value is estimated from the distribution of phase synchronization strength between each oscillator (gene) and the mean field, Ric. In order to estimate a P-value for a given cutoff value, we use the alpha-factor data set and a set of random expression signals is generated by shuffling the expression signals at different time points by interchanging the expression signal at time points 3 and 14. SOMPS is trained with this random data set and the phase synchronization strength Rics are calculated and tabulated their distribution (Fig. 6a). This distribution is an approximation of true negatives for input expression signals. By integration, we could estimate a P-value, which is defined as the probability of obtaining a Ric larger than the cutoff from the random distribution: the smaller the P-value, the more significant the strength value Ric and vice versa (Fig. 6b). For further understanding of the significance of cutoff, we
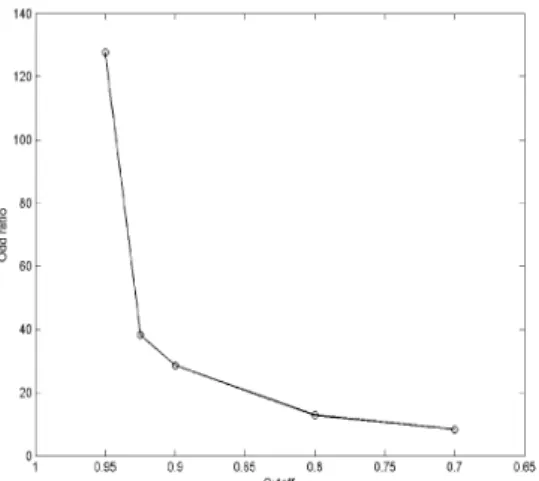
examine one of selected mean field with alpha-factor data (Fig. 4-a4). Experimentally identified physical or genetic interactions are mined from BioGRID database to visualize the known interaction networks between genes in Figure 7. The BioGRID is a freely accessible database of physical or genetic interactions available at http://www.thebiogrid.org and genes are sorted according to the strength value Rics in supplementary Table S1. It is shown that the histone proteins (e.g. HTA1, HTA2, HTB1, HTB2, HHT1, HHT2, HHF1, and HHF2) are top ranked in Table S1. It means that the histone proteins have significantly more contribution to this group. It is well known that the histone proteins are present in such enormous quantities (about 60 million molecules of each type of histone per cell, compared to 10,000 molecules for a typical sequence-specific DNA binding protein). Histones are relatively small proteins with a very high proportion of positively charged amino acids. The positive charge helps the histone bind tightly to DNA, regardless of its nucleotide sequence. They are therefore likely to have a strong influence on any reaction that occurs in chromosome (Albert et al., 1989). It is also shown that genes with relatively high Ric (e.g. histone proteins) have more known interactions than the ones with relatively low Ric(Fig. 7). Based on the procedure by Qian et al. (2001), we explore the relationship between cutoff and known physical or genetic interactions from BioGRID(Fig. 8). The relationship can be defined using the conditional probability P(k|cutoff), the probability that genes from the group have known interactions with each other with given cutoff. It is believed that the more deposition of the information concerning interactions in yeast is still on the way to reach the more complete understanding of the underlying complex cellular networks of yeast.
Therefore, based on the currently available
information from the database, P(k|cutoff) is normalized as
( )
( )k P
cutoff k
ratio P
Odd |
= ,
where P(k) is the probability of having the known interactions, regardless of cutoff. It is noteworthy that the Odd ratio is not sensitive to the number of known interactions currently available from the database. For instance, as the new known interactions are uncovered by various experiments, the probability P(k|cutoff) increases, P(k) is also increases with keeping the Odd ratiorelatively constant. Figure 8 shows the Odd ratio with cutoff = 0.95 is significantly larger than the one with cutoff = 0.7. Therefore, it can be concluded that the higher the cutoff, the more significant output and vice versa. It is also noteworthy from Figure 7 that some of genes, previously not identified as cell cycle-regulated, have known interactions with ones identified as cell cycle-regulated. Thus, these could be considered as newly identified cell cycle-regulated genes by SOMPS.
Fig. 6. The relationship between cutoff and P-value. (a) Top panel shows the distribution of
phase synchronization strength between trained mean fields and input expression signals from random expression dataset. (b) The bottom panel
shows how the P-valuecan be calculated by integrating the random distribution.
Fig. 7. The visualization of known physical or genetic interactions from the BioGRID database for
one of trained mean fields (Fig. 4-a4) with cutoff
= 0.7. The black circle nodes correspond to cell cycle-regulated genes from three benchmark sets and the gray triangular nodes correspond to genes
not included in benchmark sets.
Fig. 8. Odd ratio of having known interactions between genes assigned to one of trained mean
fields (Fig. 4-a4).
4. Conclusions
This study shows that it is feasible to identify cell cycle-regulated genes using the theory of phase synchronization. With the theory of multivariate phase synchronization, SOMPS is able to detect groups of genes, and genes from each group are considered as being
"active"having relatively many interactions with others during cell cycle. Therefore, this study provides a novel insight to the identification of cell cycle-regulated genes, compared to other previous methods that mainly consider the periodic characteristic of expression signals during cell cycle.
According to the theory of bivariate phase synchronization, the gene that is assigned to its mean field could be considered as having interaction with its mean fields. It means that these mean fields could be considered as the estimated activity of cell cycle related transcription factors. Therefore, SOMPS has a potential application to the study of
transcriptional regulatory networks, and the further study of SOMPS for transcriptional regulatory networks is left as future study.
5. Acknowledgements
The author would like to thank Professor Choung Ik Kim for valuable discussion.
6. References
Albert,B., Bray,D., Lewis,J., Raff,M., Roberts,K.
and Watson,J.D. Molecular Biology of the Cell.
Garland Publishing, New York & London.
Allefeld,C. and Kurths,J. (2004) An approach to multivariate phase synchronization analysis and its application to event-related potentials., Int. J. Bifurcation and Chaos, 14, 417-426.
Bhattacharya,J. (2001) Reduced degree of long-range phase synchrony in pathological human brain., Acta Neurobiol. Exp., 61, 309-318.
Cho,R.J., Campbell,M.Jm, Winzeler,E.A., Steinmetz,L., Conway,A., Wodicka,L., Wolfsberg,T.G., Gabrielian,A.E., Landsman,D., Lockhart,D.J., et al. (1998) A genome-wide transcriptional analysis of the mitotic cell cycle., Mol. Cell, 2, 65-73.
Cho,R.J., Huang,M., Campbell,M.J., Dong,H., Steinmetz,L., Sapinoso,L., Hampton,G., Elledge,S.J., Davis,R.W. and Lockhart,D.J. (2001) Transcriptional regulation and function during the human cell cycle., Nat. Genet., 27, 48-54.
de Lichtenberg,U., Jensen,L.J., Fausboll,A., Jensen,T.S., Bork,P. and Brunak,S. (2005) Comparison of computational methods for the identification of cell cycle-regulated genes., Bioinformatics, 21, 1164-1171.
Gabor,D. (1946) Theory of communication., J.
IEE (London), 93, 429-457.
Huygens,Ch. (1673) Horologium Oscillatorium.
Apud F. Muguet, Parisiis, France.
Johannson,D., Lindgren,P., and Berglund,A.
(2003) A multivariate approach applied to microarray data for identification of genes with cell cycle-coupled transcription., Bioinformatics, 19, 467-473.
Kim, C.S. (2008) Self-Organizing Maps with Statistical Phase Synchronization (SOMPS) for analyzing cell cycle-specific gene expression data., Statistical Applications in Genetics and Molecular Biology, 7:Iss. 1, Article 1.
Kohonen,T. (1995) Self-Organizing Maps.
Springer-Verlag, Berlin.
Lee,T.I., Rinaldi,N.J., Robert,F., Odom,D.T., Bar-Joseph,Z., Gerber,G.K., Hannett,N., Harbison,C.T., Thompson,C.M., Simon,I., et al.
(2002) Transcriptional regulatory networks in Saccharomyces cerevisiae., Science, 298, 799-804.
Lu,X., Zhang,W., Qin,Z.S., Kwasi,K.E. and Liu,J.S. (2004) Statistical resynchronization and Bayesian detection of peridically expressed genes., Nucleic Acids Res., 32, 447-455.
Luan,Y. and Li,H. (2004) Model-based methods for identifying periodically expressed genes based on time course microarray gene expression data., Bioinformatics, 20, 332-339.
Mewes,H.W., Frishman,D., Güldner,U., Mannhaupt,G., Mayer,K., Mokrejs,M., Morgenstern,B., Münsterkoetter,M., Rudd,S. and Weil,B. (2002) MIPS: a database for genomes and protein sequences., Nucleic Acids Res., 30, 31-34.
Pikovsky,A.S. (1984a) On the interaction of strange attractors., Phys. B, 55, 149-154.
Pikovsky,A.S. (1984b) Synchronization and stochastization of the ensemble of autogenerators by external noise., Radiophys. Quant. Electron, 27, 576-581.
Pikovsky,A., Rosenblum,M. and Kurths,J.
(2001) Synchronization: a universal concept in nonlinear science. . Cambridge University Press.
Qian,J., Dolled-Filhart,M., Lin,J., Yu,H. and
Gerstein,M. (2001) Beyond synexpression relationships: local clustering of time-shifted and inverted gene expression profiles identifies new, biologically relevant interactions., J. Mol. Biol., 314, 1053-1066.
Rosenblum,M.G., Pikovsky,A.S. and Kurths,J.
(1996) Phase synchronization of chaotic oscillators., Phys. Rev. Lett., 76, 1804-1807.
Rustici,G., Mata,J., Kivinen,K., Lió,P., Penkett,C.J., Burns,G., Hayles,J., Brazma,A., Nurse,P. and Bähler,J. (2004) Periodic gene expression program of the fission yeast cell cycle., Nat. Genet., 36, 809-817.
Simon,I., Barnett,J., Hannett,N., Harbison,C.T., Ranaldi,N.J., Volkert,T.L., Wyrick,J.J., Zeitlinger,J., Gifford,D.K., Jaakola,T.S., et al.(2001) Serial regulation of transcriptional regulators in the yeast cell cycle., Cell, 106, 697-708.
Spellman,P.T., Sherlock,G., Zhang,M.Q., Lyer,V.R., Anders,K., Eisen,M.B., Brown,P.Q., Botstein,D. and Futcher,B. (1998) Comprehensive identification of cell cycle-regulated genes of the yeast S. cerevisiae by microarray hybridization., Mol. Biol. Cell, 9, 3273-3297.
Strogatz,S.H. (2000) From Kuramoto to Crawford: exploring the onset of synchronization in populations of coupled oscillators., Physica D, 143, 1-20.
Whitfield,M.L., Sherlock,G., Saldanha,A.J., Murray,J.I., Ball,C.A., Alexander,K.E., Matese,J.C., Perou,C.M., Hurt,M.M., Brown,P.O., et al. (2002) Identification of gene periodically expressed in the human cell cycle and their expression in tumors., Mol. Biol. Cell, 13, 1977-2000.
Zhao,L.P., Prentice,R. and Breeden,L. (2001) Statistical modeling of large microarray data sets to identifying stimulus-response profiles., Proc.
Natl. Acad. Sci. USA, 98, 5631-5636.
저자약력
김 창 식(Chang Sik Kim) 1994년 기계공학 학사, 강원대학교 1999년 생물 및 농업공학 석사,
미국 루이지애나 주립대학교
2000년 공학박사, 미국 루이지애나 주립대학교 2000년~2002년 박사후 연구원, 농생물공학과,
미국 루이지애나 주립대학교
2002년~2004년 박사후 연구원, 물정보학 연구실, 핀란드 투르크 전산연구소
2005년~2006년 연구원,
생물정보학 연구실, 핀란드 의과학 연구소 2006년~2008년 객원연구원, 동물공동자원연구소,
강원대학교
2008년~현재 학술연구교수, 숙명여자대학교
<관심분야> 시스템생물학, 생물정보학, 기계학습 알고리즘 차 홍 준(Hong Joon Tcha)
강원대학교 컴퓨터과학과 교수 한국정보전자통신기술학회 부회장
배 철 수(Cheol-Soo Bae)
1979년 명지대학교 전자공학과 졸업(공학사)
1981년 명지대학교 대학원 전자공학과졸업 (공학석사) 1988년 명지대학교 대학원 전자공학과
졸업(공학박사) 1999년~2001년 관동대학교
공과대학 학장 2000년~2002년 2월 관동대학교
양양캠퍼스창업보육센터소장 2001년~2003년 관동대학교
평생교육원장
2003년~현재 대한전자공학회 이사 1981년~현재 관동대학교
전자정보통신공학부 교수
<관심분야> 영상처리, 신호처리시스템, 영상압축
김 문 환(Moon- Hwan Kim)
2004년 조선대학교 전자정보공과대학 컴퓨터공학과졸업 (공학박사)
1983년~1997년 한국통신(KT) 1997년~2003년 KTF
2003년~현재 한국전파기지국(주) 기술연구소장
<관심분야> 이동통신, 컴퓨터네트워크, ITS, 통신망등