• 검색 결과가 없습니다.

Modeling the Present Probability of Urban Woody Plants in the face of Climate Change

N/A
N/A
Protected

Academic year: 2021

Share "Modeling the Present Probability of Urban Woody Plants in the face of Climate Change"

Copied!
12
0
0

로드 중.... (전체 텍스트 보기)

전체 글

(1)

First author:Kim, Yoon-jung, Graduate School, Seoul National University,

Tel:+82-2-880-4885, E-mail:[email protected]

Corresponding author:Lee, Dong-Kun, Department of Landscape Architecture and Rural System Engineering, Seoul

National University,

Tel:+82-2-880-4875, E-mail:[email protected]

Received:22. November, 2012. Revised:4 January, 2013. Accepted:29 January, 2013.

- 159 -

기후변화에 따른 도시 수종의 기후 적합성 평가모델

- 서울시를 대상으로 -

김윤정1)․이동근2)․박 찬3)

1)서울대학교 대학원․2)서울대학교 조경․지역시스템공학부․3)국립환경과학원

Modeling the Present Probability of Urban Woody Plants in the face of Climate Change

Kim, Yoon-jung

1)

․Lee, Dong-Kun

2)

and Park, Chan

3)

1)Graduate School, Seoul National University,

2)Department of Landscape Architecture and Rural System Engineering, Seoul National University,

3)National Institute of Environmental Research.

ABSTRACT

The effect of climate change on urban woody plants remains difficult to predict in urban areas.

Depending on its tolerances, a plant species may stay and survive or stay with slowly declining

remnant populations under a changing climate. To predict those vulnerabilities on urban woody plants,

this study suggests a basic bioclimatic envelop model of heat requirements, cold tolerance, chilling

requirements and moisture requirements that are well documented as the ‘climatic niche’. Each

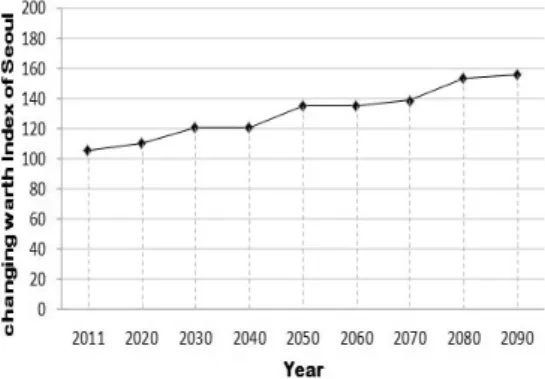
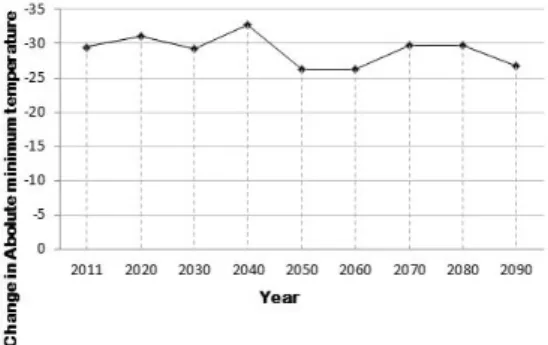
component of the ‘climatic niche’ is measured by the warmth index, the absolute minimum

temperature, the number of chilling weeks and the water balance. Regarding the utility of the

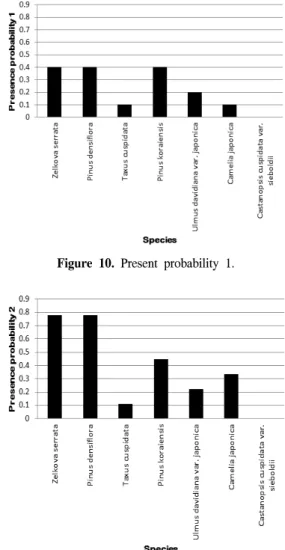
developed model, the selected urban plant’s present probabilities are suggested in the future climate

of Seoul. Both Korea and Japan’s thermal thresholds are considered for a plant’s optimal climatic

niche. By considering the thermal thresholds of these two regions for the same species, the different

responses observed will reflect the plant’s ‘hardening’ process in a rising climate. The model

illustrated that the subpolar plants Taxus cuspidata and Ulmus davidiana var. japonica are predicted

(2)

to have low suitability in Seoul. The temperate plants Zelkova serrata and Pinus densiflora, which have a broad climatic niche, exhibited the highest present probability in the future. The subtropical plants Camellia japonica and Castanopsis cuspidata var. sieboldii may exhibit a modest growth pattern in the late 21C’s future climatic period when an appropriate frost management scheme is offered. The model can be used to hypothesize how urban ecosystems could change over time.

Moreover, the developed model can be used to establish selection guidelines for urban plants with high levels of climatic adaptability.

Key Words:vulnerability assessment, climatic niche, bioclimatic envelope, warmth index.

I. Introduction

Major climatic changes are predicted for the coming century as a result of increasing atmospheric concentrations of greenhouse gases. The earth’s climate became warmer by 0.6 ± 0.2°C during the 20th century (Anon. 2001). Depending on the actual magnitude of climatic change, such changes may severely affect the species and alter present-day vegetation composition and biodiversity patterns (Skov and Svenning, 2004). The possible consequences of climatic change pose serious challenges for the management of plants. Depending on its tolerances, a plant species may stay and survive or stay with slowly declining remnant populations under a changing climate (Eriksson, 2000).

Woody plants in urban areas will become more important, though they also have to cope with increasing extreme climate conditions (Roloff, 2006). Moreover, when considering the fact that even a very small urban green space can provide invaluable ecosystem services while also offering an opportunity to explain environmental processes, the upcoming climatic hazards to plants become even more challenging issues.

To predict these climatic hazards to plants, the

concept of the ‘bioclimatic envelop’ can be utilized. A ‘bioclimatic envelop’ is developed at the species level. The ‘bioclimatic envelop model’

is effective when a plant’s different responses at the species level ought to be established. The bioclimatic envelop has its foundations in ecological niche theory (Pearson et al., 2003).

Huchinson (1957) defined the fundamental ecological niche as comprising those environmental conditions within which a species can survive and grow. Later researchers, including Austin et al.

(1990), also defined the fundamental niche as a conceptual space whose axes include all of the environmental variables affecting that species.

Bioclimatic envelopes can be defined as constituting the climate component of the fundamental ecological niche that is called ‘climatic niche’

(Pearson et al, 2003). The term ‘climatic niche’is so-called ‘climatic envelop’that reflects plant’s potential and optimal climatic distribution range (Skov and Svenning, 2004). When considering the

‘climatic niche’ of the plants, predictions of the responses produced by plants due to climate change can be established.

For that reason, this study defines the climatic

niche among woody plants in an urban

ecosystem. The aim of this paper is to predict

(3)

Vegetation zone Selected Species

Subpolar zone Taxus cuspidata, Pinus koraiensis, Ulmus davidiana var. japonica

Cool temperate zone Pinus koraiensis

Mid temperate zone Zelkova serrata, Pinus densiflora Warm temperate zone Zelkova serrata, Pinus densiflora

Subtropical zone Camelia japonica, Castanopsis cuspidata var. sieboldii Table 1. Selected plants.

and evaluate the ‘climatic niche’ of woody plants in Seoul by developing a fundamental bioclimatic envelop model and to discuss their

‘present probability’ in the future by facing climate change. Although the paper presents concepts that may be familiar to many ecologists, it may be useful to adopt and re-evaluate these concepts considering urban woody plants.

II. Methods

1. The study area

The primary study site is Seoul, the capital of South Korea. From Köppen’s climate classification, the site is categorized as a humid subtropical and continental climate which features the mid-temperate region of the nation. The study site’s annual mean temperature and mean precipitation are 7°C and 1.3mm, respectively (Korea Meteorological Administration, 2012). Most of the site’s precipitation falls in the summer monsoon period between June and September.

2. Data

1) Selected species and distribution data In this study, we focus on seven species of urban woody plants (Table 1). These species were selected to represent a featured temperature of a vegetation zone on the Korean Peninsula

that was earlier classified by Kong (1989).

Species of each vegetation zone(Kong, 1989) were selected when the plants are currently used urban species. Considering that the urban woody plants tend to be selected in various climate zones, we believe that the selected species should reflect the overall vegetation zone in South Korea.

The distribution data of the selected species was obtained from the Ministry of the Environment. In ArcGIS 9.3, the species distribution map was investigated, and the vegetation map of Yim (1977) was compared with it to check the accuracy.

2) Climate data

The climate data of 2011 to investigate Seoul

and the present climate of the region of each

species was acquired by surveying the Automatic

Weather System (AWS) of the Korea Meteorological

Administration. To evaluate the future climate,

the RCP 8.5 pathway scenario with high baseline

emission was used. The RCP 8.5 was developed

using the MESSAGE model and the IIASA

Integrated Assessment Framework by the

International Institute for Applied Systems

Analysis (IIASA) of Austria (Vuuren et al.,

2011). Because the scenario reflects extreme

climate change in the future, we believe that it

will predict the maximum number of possible

(4)

Species WI(Korea) Reference WI (Japan) Reference

Zelkova serrata 63 123 Yim(1977) 55 140 N.Fuji(1988)

Pinus densiflora 30 122 Yim(1977) 23 138 Kira and Yoshino(1967)

Taxus cuspidata 13 90 Yim(1977) 17 78 Kira and Yoshino(1967)

Pinus koraiensis 21 121 Yim(1977) 15 72 Kira and Yoshino(1967)

Ulmus davidiana var. japonica 37 112 Yang et al.(2007) 45 90 N.Fuji(1988)

Camelia japonica 68 125 Yim(1977) 85 180 Kira(1991)

Castanopsis cuspidata var. sieboldii 96 121 Yang et al.(2007) 85 180 Kira(1991) Table 2. Warmth index.

responses for plants reasonably. This paper considered the climate during the climatic period between 2011 and 2090 at 10-year intervals to represent the year-to-year variability that exists in the temperature and precipitation.

3. The model

1) Bioclimatic variables

Four variables were selected to reflect the species’ climatic niche:the warmth index, absolute minimum temperature, number of chilling weeks, and water balance. These variables represent heat requirements, cold tolerance, chilling requirements and moisture requirements, respectively. The specific thresholds of all variables except the moisture requirements were discovered for each species by observing the species’ climate distribution ranges.

(1) Heat requirements - Warmth index It was concluded in the work of Yim and Kira (1976) and Yim (1977) that the thermal climate, as evaluated by the warmth index, was the main factor responsible for the variance of the vegetation types on the Korean Peninsula. Within the warmth index, the lower and upper bounds between the temperature and growth were considered. Franklin et al. (1992) noted that

increases in temperatures can restrict and prevent species from becoming reestablished at a site. The thermal thresholds of the plants were considered according to the warmth index. Seoul’s warmth index was calculated by summing the number of days above 5°C to reflect the growth phase of plants.

The warmth index of each plant species was adopted from earlier papers that illustrated the plant warmth indexes of South Korea and Japan (Table 2). We believe that by considering the warmth indexes of these two regions for the same species, each different response observed will reflect the pertinent plant’s ‘hardening’

process in a rising climate. When the climatic stress frequency increases, plants may not have returned to their previous reference state in the time lag between two climatic stress events, thus affecting the stress response to repeated climatic stress:Such a stress memory maintained by the plant after a climatic stress event may lead to a faster stress response and increased climatic stress tolerance upon a subsequent weather event, which explains the plant’s ‘hardening’

process (Bruce et al., 2007; Walter et al., 2011).

For this reason, considering both Japan’s warmer

climate and the changing climate of Seoul, we

believe that the wider range of the warmth index

(5)

of the selected species will suggest the hardening process of the thermal tolerance of plants.

(2) Cold tolerances -

Absolute minimum temperature

Absolute minimum temperature thresholds are used to determine whether winter killing frosts occur. Low temperatures affect the survival of plants and may result in killing frosts in winter (Prentice et al. 1992; Beerling et al., 1995;

Pearson et al., 2002). Sakai & Weiser (1973), Woodward (1987), Prentice et al. (1992) and others have emphasized the importance of minimum temperatures in determining the combination of plant species. The absolute minimum temperature was calculated using Müller’s (1982) regression developed from worldwide data of 2000 stations. Tc represents the mean temperature of the coldest month in °C:

T

min

= 0.006 T

c2

+ 1.316 T

c

-21.9

(3) Chilling requirements - Number of chilling weeks

Woody plants in temperate regions commonly require a winter chilling period with temperatures below 5°C for rapid budburst the following spring (Prentice et al., 1992). The vegetative and floral buds on temperate tree species normally enter a state of ‘dormancy' in autumn, which is progressively decreased during the winter by exposure to 'chilling' temperatures. This loss of dormancy can be described as a decrease in the thermal time to blossoming or budburst, and it will lead to early blossoming or budburst with an increased risk of subsequent damaging frosts (Cannell and Smith, 1986). The number of chilling weeks is therefore calculated by summing

all of the chill weeks under 5°C, as proposed by Cannell and Smith (1986). In the equation below, T refers to the daily mean temperature:

CR= ∑(T≤5)

(4) Moisture requirements – Water balance Drought can cause the rapid mortality and increase the susceptibility of species to insect attack (Allen and Breshears, 198). Moreover, drought conditions have and will continue to prevent the establishment of species on a site and cause mortality of established seedlings (Spittlehouse and Childs, 1990). Precipitation alone is not a good measure of the source of moisture available for plant growth, and it is necessary to relate precipitation to energy in order to determine a useful moisture index (Lenihan and Neilson 1993; Skove and Svenning, 2004). In this study, we use the water balance calculated by the monthly difference between precipitation and potential evapotranspi- ration using the regression method of Thronwaite et al. (1957).

2) Determining the present probability The presence probability was determined to calculate the average probability of a species from 0 to 1 while accounting for all of the selected bioclimatic variables. Each assessed value of the present years of species was 1, but each determined value for absent years was 0.

As suggested by Nischke et al. (2008), the

model’s determination flow was established, as

shown in Figure 1. The species which meet all

of the four bioclimatic variables were assessed to

have regeneration ability for the next year. Thus,

the species which satisfied these four climatic

(6)

Figure 1. Conceptual flow of the model.

Figure 2. Changing warmth index of Seoul.

Figure 3. Warmth index of South Korea.

Figure 4. Warmth index of Japan.

variables were considered as present species for a certain predicted year. By analyzing the ratio of the determined regeneration years and absent years, each species’ presence/absence probability was derived. The required warmth index of the species and the absolute minimum temperature and adequacy of the chilling requirements were assessed by comparing each a species-specific threshold to Seoul’s cost. On the other hand, the adequacy of the monthly water balance of the species was evaluated in terms of Seoul’s changing drought occurrences. After considering prior species-specific variables, the water balance was used to modify the final results of the presence probability.

III. Results

1. Response of the biophysical variables The study site’s warmth index consistently increased during the test period (Figure 2). The result suggests that a 50.38°C increase in the warmth index will occur by the 2090 climatic period. Figure 3 and 4 illustrate the selected species’ warmth index thresholds as calculated

from the plant distribution data of South Korea

and Japan. By comparing the adequate warmth

index of each calculated species (Figure 3 and 4)

to Seoul’s changing warmth index (Figure 2), all

seven species are shown to exceed their

(7)

Figure 5. Changing absolute mean temperature in Seoul. Figure 7. Change in Chilling weeks in Seoul.

Figure 6. Absolute minimum temperature thresholds for selected plants.

Figure 8. Required chill week thresholds for selected plants.

maximum warmth index threshold after the 2050 climatic period.

Regarding cool-temperate plants, Taxus cupidata exceeded its warmth index threshold after the mid-2010 climatic period, but Ulmus davidiana ver. Japonica maintained an adequate state until the mid-2020 climatic period. In contrast to those results, Figure 4 illustrates a wider range of warmth index thresholds for the plants as calculated from Japan’s plant distribution data. The warmth index of Japan suggests that plants from areas of warm temperatures tend to have a warmth index of a higher level, whereas plants from cool regions show lower thresholds. Zelkova serrata and Pinus densiflora had maximum thresholds of

140°C and 138°C, respectively. Camellia japonica and Castanopsis cuspidata var. sieboldii showed a maximum threshold of 180°C, in contrast to the results shown in Figure 3.

The thresholds of the absolute minimum

temperature changed due to the changing climate

in winter (Figure 5). Despite the increasing mean

temperature, winter’s killing frost demonstrated

an insufficient alleviation. Between 2011 and

2090, the absolute minimum temperature changed

from -29.5°C to -26.8°C. Figure 6 illustrates the

species-specific absolute minimum temperature

thresholds. The results show that Pinus koraiensis

has higher tolerance of winter’s killing frost and

that all species except Camellia japonica and

Castanopsis cuspidata var. sieboldii show high

(8)

Figure 9. Change in drought occurrences.

Figure 10. Present probability 1.

Figure 11. Present probability 2.

tolerance levels by the 2090 climatic period. In contrast, the subtropical plants of Camellia japonica and Castanopsis cuspidata var. sieboldii were predicted to exceed the absolute minimum temperature thresholds considerably. Camellia japonica was found to have a threshold of -26°C for killing frosts, which exceeded the study site’s 2011~2040 and 2070~2080 absolute minimum temperatures. Castanopsis cuspidata var. sieboldii was found to exceed its tolerance level for killing frosts by the 2090 climatic period.

The result indicates that the number of chilling weeks may decrease from the 2060 to the 2090 climatic period (Figure 7). The climatic period of 2060~2070 was predicted to have 11 chilling weeks, and the number of chilling weeks for the period of 2080~2090 drastically decreased from 10 to 9. Species-specific thresholds for chilling requirements were calculated, as shown in Figure 8. All species except Taxus cuspidata required 12 chilling weeks, unmatching the predicted number of chilling weeks for the middle of the 2010~2090 climatic period.

Climate change resulted in the modification of the balance between potential evapotranspiration and monthly precipitation. The results illustrated that the calculated water balance of fall and winter portended a major increase in the rate of drought (Figure 9). Despite the results showing

an inconsistent drought pattern, it illustrated an increasing drought during fall and winter by the 2090 climatic period.

2. The present probability

To consider the responses of all species to bioclimatic variables, the final present probability was introduced. Figure 10 shows each species’

calculated ‘present probability 1 ’ based on the

species distribution data in South Korea. Zelkova

serrata, Pinus densiflora and Pinus koraiensis

were predicted to have higher present probability

(9)

values of 0.4. On the other hand, the subpolar plants Taxus cuspidata and Ulmus davidiana var.

japonica were shown to have lower values of the present probability, at 0.1 and 0.2, respectively.

The higher values of ‘present probability 2’, illustrated in Figure 11, adopt the relatively higher warmth index of the Japan and South Korea. Zelkova serrata and Pinus densiflora were found to have the highest value of 0.7 among the considered species. Camellia japonica, in the face of higher warmer temperatures, was predicted to have a present probability value of 0.4.

IV. Discussion & Conclusion

The increase of climatic variability due to global climate change exerts climatic stress on plants, which is novel in its magnitude and frequency (IPCC, 2007). To predict these stresses on urban woody plants, this study suggests species-specific climatic thresholds for the heat requirements, cold tolerance, chilling requirements and moisture requirement that are well documented as the ‘climatic niche’. Application of the model based on the ‘climatic niche’ will suggest the general directions of vulnerability to be expected.

The model suggested that a sharply increased warmth index, the thermal threshold of plants, will affect species combination overall during future climatic periods. Seoul’s current warmth index ranges are included in the mid-temperate zone of South Korea. However, when considering the future warmth index, Seoul’s climate zone will change from the mid-temperate zone in South Korea to the subtropical zone in Japan. This result illustrates the fact that the increasing heat stress acclimation of cool-temperate plants will execute severe growth problems in the near future. Taxus

cuspidata and Ulmus davidiana var. japonica are therefore predicted to have low suitability in Seoul. Particularly, with the decrease in the number of chilling weeks, Taxus cupidata may experience severely insufficient frost hardiness processes.

The temperate plants of Zelkova serrata and Pinus densiflora were predicted to show the highest present probability in the future. Because these plants have a broad range of distribution, this finding is in agreement with the wide climatic niche they exhibit. Moreover, the subtropical plants Camellia japonica and Castanopsis cuspidata var. sieboldii showed low present probability despite Seoul’s changing climate, as Camellia japonica and Castanopsis cuspidata var. sieboldii are not able to adapt to Seoul’s winter climate. Future winter findings exhibited a rising mean temperature, but the predicted increases in the mean temperature were not sufficient for these subtropical plants.

These bioclimatic variable results, based on current species’ distribution data, only cover the adaptability of plants in the current range of climate. However, there is an increasing incidence of stabilizing climatic fluctuations by plants (Walter et al., 2012). Furthermore, Bradshaw et al. (2000) noted that mature individuals have been found to survive well outside of their current modern ranges. Therefore, we adopted Japan’s plants distribution data for the selected species, with a warmth index that has a higher value, to reflect a broader range of the ‘climatic niche’.

Moreover, additional consideration was given to

Japan’s thermal thresholds, for which the selected

plants reflect the relevant degree of ‘thermal

hardening’ in Seoul. Adaptation to the warmer

climate will occur through a long-term climatic

(10)

period, and the predicted climatic period between 2011 and 2099 reflects this. For this reason, although the plants in South Korea now indicate lower thermal thresholds compared to Japan, an increase in the thermal stress memory of plants may arise in the future. Ecological stress memory such as thermal stress may emerge as plants reveal modifications, such as acclimation, upon stress exposure, which may persist upon the end of this type of stress (Walter et al., 2012). By adopting the higher warmth index of Japan, Zelkova serrata and Pinus densiflora exhibited the highest present probability levels. Pinus koraiensis showed a middle range of the present probability.

Moreover, Camellia japonica had a higher value than before, but Taxus cuspidata still showed the lowest presence value due to its high level of cold tolerance. Overall, all species tend to exhibit higher values of present probability, but the relative difference between the selected plants illustrated no variance. Thus, the predicted present probability is judged to be reliable, as it suitably exhibits the ‘relative presence tendency’ of plants in the future climate.

However, when consider the fact that urban plants are usually managed, the results are subject to a different interpretation. Subtropical plants, i.e., Camellia japonica and Castanopsis cuspidata var. sieboldii, may exhibit modest growth patterns in the future climatic period of the late 21C when appropriate frost management measures are taken. In addition, all of the selected plants will require more active drought management measures, particularly in fall and winter, due to the increasing occurrences of drought in Seoul. On the other hand, the subpolar zone plants Taxus cuspidata, Pinus koraiensis and Ulmus davidiana var. japonica

will still exhibit low adaptability, because these plants show severe discrepancies in their niche breadths.

The results of the model can be used to hypothesize how urban ecosystems can change over time and can also be used to establish selection guidelines for urban plants. Moreover, adaptation plans pertaining to climate change, such as changes in the composition of a species (Halpin, 1997; Hossell et al., 2003), can be used to pursue heterogeneity to provide a high level of species diversity (Halpin, 1997; M. Milad et al., 2011) with the proposed model.

There are some of the limitations in the model. Here, the RCP 8.5 pathway scenario was selected to cover intense climate patterns that affect plants; however, the use of multiple climate scenarios would secure robust results.

Furthermore, the model requires consideration of a more complex version of the ‘bioclimatic envelop’ to illustrate a narrower climatic niche breadth.

Acknowledgements

This work was supported by the Korea Environmental Industry and Technology Institute(KEITI) grant funded by the Korea government (ME). (No. 416-111-014)

References

Kong, W. S. 1989. The Biogeographic Divisions of Korea and Their Species Composition. The Korean Geographical Society 40:43-54. (in Korean with English summary)

Yang, K. C. and Shim, J. K. 2007. Distribution

of major plant communities based on the

(11)

climatic conditions and topographic features in South Korea.. Korean Journal of Environmental Biology 25(2):168-177. (in English with Korean summary)

Allen, C. D. and Breshears, D. D. 1998. Drought- induced shift of a forest-woodland landscape in response to climate variation. In:

Proceedings of the National Academy of Science, USA.

Anon. 2001. Using ArcGIS Spatial Analysist.

Environ. Systems Res. Inst. Redlands.

California.

Austin, M. P.․Nicholls, A. O. and Margules, C. R.

1990. Measurement of the realized qualitative niche:environmental niches of five Eucalyptus species. Ecological Monographs 60:161–

177.

Beerling, D. J.․Huntley, B. and Bailey, J. P. 1995.

Climate and the distribution of Fallopia japonica -use of an introduced species to test the predictive capacity of response surfaces.

Journal of Vegetation Science 6:269-282.

Bradshaw, R. H. W.․Holmqvist, B. H.․Cowling, S. A. and Sykes, M. T. 2000. The effects of climate change on the distribution and management of Picea abies in southern Scandinavia. Canadian Journal of Forest Restoration 30:1992–1998.

Bruce, T. J. A.․Matthes, M. C. and Napier, J. A.

2007. Stressful “memories” of plants:

evidence and possible mechanisms. Plant science 173:603-608.

Burton, P. J. and Cumming, S. G. 1995. Potential effects of climatic change on some western Canadian forests, based on phenological enhancements to a patch model of forest succession. Water Air Soil Pollution 82:401 –414.

Cannell, M. G. R. and Smith, R. I. 1986. Climatic warming, spring budburst and frost damage on trees. Journal of Applied Ecology 23:

177–191.

Eriksson, O. 2000. Functional roles of remnant plant populations in communities and ecosystems.

Global ecology and biogeography 9:

443-449.

Franklin, J. F.․Swanson, F. J.․Harmon, M. E.․

Perry, D. A.․Spies, T. A.․Dale, V. H.․

Mckee, A.․Ferrell, W. K.․Means, J. E.․

Gregory, S. V.․ Lattin, J. D.․Schowalter, T. D. and Larsen, D. 1992. Effects of global climate change on forests of northwest North America.:Global Warming and Biological Diversity. Yale University Press.

Intergovernmental Panel on Climate Change (IPCC). 2007. Climate Change 2007:The Scientific Basis. Contribution of Working Group I to the Fourth Assessment Report of the Intergovernmental Panel on Climate Change, New York:Cambridge Univ. Press.

Lenihan, J. M. and Neilson, R. P. 1993. A rule-based vegetation formation model for Canada.

Journal of Biogeography 20:615-628.

Nitschke, C. R. and John, L. Innes. 2008. A tree and climate assessment tool for modelling ecosystem response to climate change. Ecological modelling 210:263-277.

Sakai, A. and Weiser, C. G. 1973. Freezing resistance of trees in North America with reference to tree regions. Ecology 54:

118-126.

Skov, F. and Svenning, J. C. 2004. Potential impact of climatic change on the distribution of forest herbs in Europe. Ecography 27:366-380.

Spittlehouse, D. L. and Childs, S. W. 1990.

Evaluating the seedling moisture environment

(12)

after site preparation:Sustained Productivity of Forest Soils. Proceedings of the 7th North American Forest Soils Conference. Canada:

University of British Columbia, Vancouver.

Thornwaite, C. W.․Mather, J. R. and Carter, D. B.

1957. Instructions and tables for computing potential evaporation and the water balance.

Drexel Institute of Technology.

Vuuren, D. P. and Riahi, K. 2011. The relationship between short-term emissions and long-term concentration targets-a letter. Climate change 104:793-801.

Halpin, P. N. 1997. Global climate change and natural-area protection:management responses and research directions. Ecological Applications 7:828–843.

Hossell, J. E.․Ellis, N. E.․Harley, M. J. and Hepburn, I. R. 2003. Climate change and nature conservation:Implications for policy and practice in Britain and Ireland. Journal for Nature Conservation 11:67–73.

Hutchinson, G. E. 1957. Concluding remarks. Cold Spring Harbor Symposium on Quantitative Biology 22:415–457.

Milad, M.․Schaich, H.․Burgi, M. and Konold, M.

2011. Climate change and nature conservation in central European forests:a review of consequences, concepts and challenges. 261:

829-843.

Muller, J. M. 1982. Selected climatic data for a global set of standard stations for vegetation science. The Hague.

Pearson, R. G.․Dawson, T. P.․Berry, P. M. and Harrison, P. A. 2002. SPECIES:A spatial evaluation of climate impact on the envelope of species. Ecolological Modelling 154:

289-300.

Pearson, R. G. and Dawson, T. P. 2003. Predicting the impacts of climate change on the distribution of species:are bioclimate envelope models useful? Global Ecology &

Biogeography 12:361-371.

Prentice, I. C.․Cramer, W.․Harrison, S. P.․

Leemans, R.․Monserud, R. A. and Solomon, A. M. 1992. A global biome model based on plant phycology and dominance. Soil properties and climate. Journal of biography. 19:

117-134.

Roloff, A.․Korn, S. and Gillner, S. 2009. The Climate-Species-Matrix to select tree species for urban habitats considering climate change.

Urban Forestry & Urban Greening. 8:295–

308.

Warter, J.․Jentsch, A.․Beierkuhnlein, C. and Kreyling, J. 2012. Ecological stress memory and cross stress tolerance in plants in the face of climate extremes. Envionmental and experimental botany.

Woodward, F. I. 1987. Climate and Plant Distribution. Cambridge University Press, London, UK.

Yim, Y. J. and Kira. 1975. Distribution of forest vegetation and climate in the Korean peninsula. Japanese journal of ecology 25(2):

77-88.

Yim, Y. J. 1977. Distribution of forest vegetation and climate in the Korean peninsula. 3.

Distribution of some thermal climate. Japanese journal of ecology 27:177-189.

http://www.climate.go.kr/index.html

http://www.kma.go.kr/

수치

Figure  2.  Changing  warmth  index  of  Seoul.
Figure  5.  Changing  absolute  mean  temperature  in  Seoul. Figure  7.  Change  in  Chilling  weeks  in  Seoul.
Figure  9.  Change  in  drought  occurrences.

참조

관련 문서

The problem of atom migration can be solved by considering the thermodynamic condition for equilibrium; namely that the chemical potential of an atom must be the same

After listening to the opinions of firemen in field activities, we confirmed that the firepower can be secured by reducing the loss of firepower caused

Buds on persistent shoots near the ground – woody plants with perennating buds borne close to the ground, no more than 25 cm above the soil surface, (e.g. bilberry

Buds on persistent shoots near the ground – woody plants with perennating buds borne close to the ground, no more than 25 cm above the soil surface, (e.g. bilberry

The 2019 report of The Lancet Countdown on health and climate change: ensuring that the health of a child born today is not defined by a changing

The index is calculated with the latest 5-year auction data of 400 selected Classic, Modern, and Contemporary Chinese painting artists from major auction houses..

1 John Owen, Justification by Faith Alone, in The Works of John Owen, ed. John Bolt, trans. Scott Clark, "Do This and Live: Christ's Active Obedience as the

• Urban places should be framed by architecture and landscape design that celebrate local. history, climate, ecology