Journal of the Environmental Sciences
Pulmonary Function and Its Influence Factors of Residents in Yeosu Industrial Complex
Eun-Ju Hong, Gi-Sub Ahn
1), Eun Kyung Chung
2), Xinbiao GUO
3), Bu-Soon Son
*Department of Environmental Health Science, Soonchunhyang University, Chungnam 336-745, Korea
1)
Division of Health & Environment, Baekseok cultural University, Chungnam 330-705, Korea
2)
Division of Biological Science, Sookmyung Women's University, Seoul 140-742, Korea
3)
Department of Occupational & Environmental Health Sciences, Peking University, Beijing 100-871, China (Manuscript received 5 April, 2011; revised 6 May, 2011; accepted 16 June, 2011)
Abstract
Objectives: This study is aimed at identifying the influential factors on the pulmonary function of ordinary residents in the
surrounding areas of Yeosu Industrial Complex. Methods: The PFT (Pulmonary Function Test) was conducted on the target residents numbering 989 people (male 361, female 628). The exposed group (813 people) resided within the radius of 5km from Yeosu Industrial Complex and the control group (176 people) resided in the radius of more than 15 km from May 2007 to November 2007. The survey also took into account other factors including personal characteristics, life habits, respiratory diseases and allergic symptoms, medical histories, and the living environments of the residents in order to further identify influential factors on pulmonary function. Result: When comparing the PFT values of the exposure groups to the control group of the same city, values of the exposure groups were meaningfully lower with an %FEV1 of 107.05% and %FVC of 100.28%. Conversely, the control group reported an %FEV1 and %FVC of 107.26% and 102.85% respectively, indicating that ambient air pollutants reduce lung function. The odds ratio of asthma diagnosis history increased when a subjects residence was close to a heavily trafficked road, traffic amount was huge, a bed was used, and the family had less than four members. However the results were not statistically meaningful. The odds ratios of abnormal pulmonary function were statistically higher among those with asthma(OR=4.29, CI=1.75-10.56), wheezing (OR=2.59, CI=1.24-5.41), and nasal congestion (OR=2.87, CI=1.36-6.08) (p<0.01). The factors affecting FEV1 were symptoms including asthma, passive smoking and allergic eye disease (R2=0.049, p<0.001). For the FVC symptoms including asthma (R2=0.014, p<0.001) were measured. The analysis showed that FVC decreased with increases in O3 and CO(p<0.01). Furthermore, FEV1 decreased with increases in O3(p<0.01). Conclusions: These results will provide preliminary data for establishing responsive measures to protect the health of residents in industrial complexes from air pollution, and to develop lasting environmental health policies.Key Words : PFT, FEV
1, FVC, Odds ratio, O3, CO1)
1. Introduction
Environmental pollution is emerging as one of national priorities with posing a growing threat to
*Corresponding author : Bu-Soon Son, Department of Environmental Health Science, Soonchunhyang University, Chungnam 336-745, Korea
Phone: +82-41-530-1270 E-mail: [email protected]
lives and health of residents of industrial complexes
(Ministry of Environment(MOE), 2000). Therefore,
strengthened environmental policies have been
implemented in a way to protect their environmental
health(MOE, 2008). As environ- mental diseases
including asthma and allergy are increasing among
the residents of large-sized industrial complexes in
Gwangyang, Sihwa, Ulsan and Pohang, investigations
on environmental pollutions and their effects on the residents have been conducted for years(National Institute of Environmental Research(NIER), 2003-2008).
In particular, those who live near petrochemical industrial complexes were reported to be suffering odor and other symptoms continuously, proving that air pollution at the region is serious(Seo et al., 2003).
When air pollutions are inhaled or absorbed into the human body, the respiratory system contacts the pollutants directly. An on-going influence of the air pollutants on the system will weaken its self-defense function, causing various respiratory diseases(Shin et al., 2002). Air pollution has been known to increase acute respiratory diseases, lung malfunction, respiratory disease prevalence rate, hospitalization and related death rate. It also aggravates chronic respiratory diseases, asthma prevalence rate and asthma attack (Choi et al., 2000). Among others, the elderly, children, and those with health problems are the most vulnerable to the negative impacts of air pollution (Bae et al., 2008, 2009). The epidemiological investigation methods to evaluate effects of air pollution on the respiratory system are standardized questionnaire on respiratory symptoms, pulmonary function test and chest x-ray (Na et al., 2009).
Among them, pulmonary function test is widely used in air pollution epidemiology because of relatively low costs and convenience (Bae et al., 2004).
Because PFT(pulmonary function test) values vary with gender, age, height, health, region and ethnicity, it is common that the test results are compared not with the absolute values but with the normal predictive values (Choi et al., 2005). Prior studies indicated that respiratory diseases and symptoms are caused and aggravated by genetic tendency and exposure to the environmental factors (Maier et al., 2000), they are known as the main source of respiratory diseases as they reduce lung function and cause allergies (Sotir et al., 2003). As Yeosu industrial complex has more heavy chemical and
energy facilities than others, it has released large amount of HCs and NO
xeffluents into the air(Lee, 2005). Thereby, it was designated as an air quality regulated region in December 1999. This study conducted PFT and a survey on the residents in the Yeosu petrochemical industrial complex. The objective was to investigate environmental factors affecting lung function and respiratory symptoms of the residents while examining their relations. The study results will provide preliminary data for establishing responsive measures to protect health of the residents of industrial complexes from air pollution.
2. Method
2.1. Subjects and Survey
The study conducted from May 2007 to November 2007 by performing PFTs on the exposure group and the control group who are composed of residents within 5 km radius and 15 km radius of Yeosu Industrial Complex in South Jeolla respectively. In line with that, survey was conducted on their physical conditions, lifestyles, diseases, allergic symptoms, medical history and residential conditions to acknowledge other factors affecting pulmonary functions. The questionnaire of the survey developed by the National Institute of Environmental Research (Jeong et al., 2007) was utilized.
2.2. Pulmonary function test
For this study, Schiller model SP
1(Germany) was
used. Before actual test, the subjects were fully
educated with proper posture and use methods. And
the tester demonstrated how to use the tool. Among
other lung function values, FVC, FEV
1and FEV
1/FVC
ratio was evaluated in this study. As for FEV
1and
FVC, they were transformed into the percent-
predicted value for forced expiratory volume in the
one second (or FEV
1predictive value(%)) adjusted
with lung function, height, weight, gender and age of
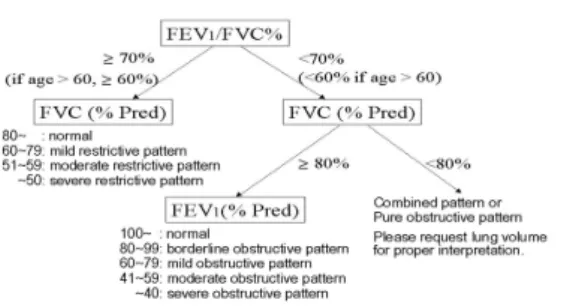
Korean people (Choi et al., 2005). The figure below shows the pulmonary function test standards.
Fig. 1. Pulmonary function test standards.
2.3. Decision Abnormal pulmonary function
FVC is an indicator for restrictive ventilatory impairment and FEV
1is used to evaluate obstructive ventilatory impairment. But FEV
1/FVC ratio must be considered to understand cause of decreases in FVC, because it can fall in case of airway obstruction (Table 1).
Patients with restrictive lung diseases record normal or higher than normal FEV
1/FVC ratio because FVC drops. Obstruction Lung Disease or OLD refers to the disorders caused by obstruction in the airways. When FEV
1/FVC ratio is less than 0.70 (< 0.70) and predicted FEV
1is lower than 80%(>80%), OLD is diagnosed (Cooper et al., 2010)18). In other words, OLD is diagnosed when FEV
1/FVC is low, and it includes asthma, chronic obstructive bronchitis and pulmonary emphysema.
Restrictive Lung Diseases or RLD refers to the conditions that lung and chest can't be fully expanded when inhaling. RLD is diagnosed when FVC is lower than 80% (<80%), although FEV
1/FVC is 0.70 or higher (≧ 0.70). In other words, RLD is diagnosed when FVC is low despite normal FEV
1/FVC. Asbestosis, pulmonary congestion, pneumothorax and limits in breathing are included.
Pattern FEV₁
(% predicted)
FVC (% predicted)
FEV₁/ FVC ratio
Normal ≧ 80% NA < 0.70
Normal NA ≧ 80% ≧ 0.70
Restricted NA < 80% ≧ 0.70
Obstructed < 80% NA < 0.70
Table 1. Definitions of lung disease
FEV₁; forced expired volume in 1sec, FVC; forced vital capacity, NA; not applicable.
2.4. Air pollution Monitoring Data
Air pollution was analyzed based on the data obtained with the Air Pollution Monitoring Network (Gwangmu, Samildong, Wolaedong) from March 2003 to February 2007 (Ministry of Environment, 2007).
2.5. Statistical analysis
For the analysis on the biology samples and questionnaire results, SPSS ver. 18.0 and EXCEL were used. As for the differences between the exposure group and control group, and T-test was used. In case of the differences among more than three groups, ANOVA was utilized. To find out factors affecting the lung function, multiple regression analysis was used while logistic regression analysis was used for odds ratio.
3. Results and Discussion
3.1. General characteristics of subjects
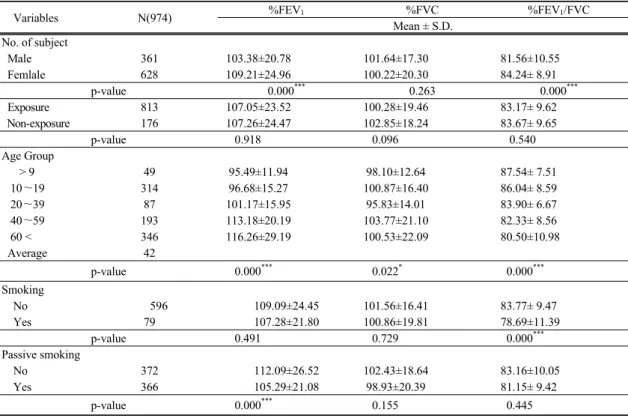
Table 2 shows pulmonary function levels by gender,
group and age. %FEV
1and FEV
1/FVC ratio is
103.38% and 81.56% among males and 109.21% and
84.24% among females respectively. As seen, males
recorded lower levels compared to female subjects
(p<0.001), but, %FVC was higher among males with
101.64%. Unlike prior expectation that males would
post higher values than their female counterparts in
the test, %FEV
1and %FEV
1/FVC were higher among
females. The result indicates that males recorded low
Variables N(974) %FEV
1%FVC %FEV
1/FVC Mean ± S.D.
No. of subject
Male 361 103.38±20.78 101.64±17.30 81.56±10.55
Femlale 628 109.21±24.96 100.22±20.30 84.24± 8.91
p-value 0.000
***0.263 0.000
***Exposure 813 107.05±23.52 100.28±19.46 83.17± 9.62
Non-exposure 176 107.26±24.47 102.85±18.24 83.67± 9.65
p-value 0.918 0.096 0.540
Age Group
> 9 49 95.49±11.94 98.10±12.64 87.54± 7.51
10∼19 314 96.68±15.27 100.87±16.40 86.04± 8.59
20∼39 87 101.17±15.95 95.83±14.01 83.90± 6.67
40∼59 193 113.18±20.19 103.77±21.10 82.33± 8.56
60 < 346 116.26±29.19 100.53±22.09 80.50±10.98
Average 42
p-value 0.000
***0.022
*0.000
***Smoking
No 596 109.09±24.45 101.56±16.41 83.77± 9.47
Yes 79 107.28±21.80 100.86±19.81 78.69±11.39
p-value 0.491 0.729 0.000
***Passive smoking
No 372 112.09±26.52 102.43±18.64 83.16±10.05
Yes 366 105.29±21.08 98.93±20.39 81.15± 9.42
p-value 0.000
***0.155 0.445
**p<0.01, ***p<0.001, S.D.; Standard Deviation, No.;Number
Table 2. Pulmonary function level according to Variables
%FEV
1which represents forced respiratory volume in 1 second although they hight have better lung capacity. In other words, they have a high possibility of suffering asthma or other pulmonary diseases. That is because of following two reasons. First, more female participants in the age groups from 20 to 39 and 40 to 59. Second, males have a higher chance to be exposed to environmental factors through outdoor activities and lifestyles such as smoking. Lee(2009) wrote that male workers who had been exposed to small particles at workspace presented much lower pulmonary function values than others. From the study, we can assume that males have a higher risk to be exposed to factors reducing lung function at work too. As for the comparison between exposure group and control group, the exposure group posted 107.05% of %FEV
1and %FVC of 100.28%, showing
weaker lung capacity. Meanwhile the control group recorded 107.26% and 102.85%. The study result shows that PFT values are lower among the exposure group than the control group, indicating that residents living near the industrial complexes are being exposed to the environmental factors reducing the lung function.
When factoring in age of subjects in the region,
%FEV
1becomes lower as they get younger(p<0.001).
%FVC value was lowest among those aged from 20 to 39, FEV
1/FVC ratio decreased meaningfully in line with age increases(p<0.001). Murray et al.(2007) wrote that morphological changes such as reductions in lung elasticity and emphysema rise with aging.
Hong(2004) also wrote that functional reserve took place with aging, reducing the lung function.
Goldman et al.(2004) also reported that %FEV
1and
FVC values went down due to aging. In this study, however, %FEV
1increased and FVC became irregular.
and %FEV
1/FVC in line with increases in age.
%FVC is an indicator for restrictive ventilatory impairment but it declines in case of airway obstruction.
But, in this case, decreases in %FVC coincided with decreases in %FEV
1/FVC, indicating that possibilities of restrictive ventilatory impairment rises with increases in age. Smokers in this study posted 107.28% and 100.86% in %FEV
1and %FVC which were lower than the values of nonsmokers who recorded 109.09% and 101.56%, respectively. As for FEV
1/FVC ratio, smokers posted 83.77%, while nonsmokers recorded 78.69%, showing a meaningful difference (p<0.001). Wen(2005) reported that %FEV
1decrease was associated with smoking. In addition the study found that complications found among the patients with weak lung function was also related to smoking.
Park et al.(2009) compared smokers and non-smokers and found out that vital capacity decreased with smoking although the difference was not meaningful.
Lee et al.(2000) also conducted a similar study respectively to find out that smoking reduced
%FEV
1. Lee et al.(2000)'s study was conduced on former smokers and smokers and found out that the lung function was in a negative relation with smoking pack years. This study found %FEV
1and %FVC values were low among smokers, corresponding to other study results. But, tracking smoking experience only with a survey is limited. Although smoking is associated with decreases in the lung function, there are also many other causes affecting on the lung function. As for passive smoking, %FEV
1and %FVC values were lower among the respondents who are exposed to passive smoking with %97.25 and
%98.53. Those who are not exposed to passive smoking posed %105.48 and %99.42 respectively.
According to Mannino(2007) and Zlotkowska et al.(2004), children who had been exposed to passive smoking developed bronchitis more than others,
showing that smoking of parents increased occurrence and frequency of respiratory diseases of their children. The study conducted by Whincup (2004) revealed that the exposure to passive smoking increased risk of chronic rhinosinusitis by 40%. All in all, nonsmokers who had been exposed to passive smoking have a high chance of developing respiratory diseases. This study results showed that
%FEV
1and %FVC values among those who had been exposed to passive smoking were lower like other studies.
3.2. Pulmonary function by Factors 3.2.1. Resident's environment
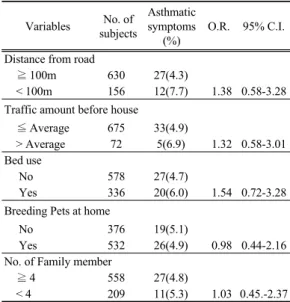
Table 3 show that influence of residential
environment (distance between residence and a road,
traffic amount, use of bed, pet breeding) on asthma
diagnosis history rate, which can be utilized as an
indirect index for the lung function. Asthma
diagnosis history rate refers to the proportion of those
who had been diagnosed with asthma before. And the
odds ratio of asthma diagnosis history increased with
traffic amount, the distance from road decreased, use
of bed and under 4 family member. Park et al.(2003)
reported that respiratory diseases were associated
with traffic amount because the lung function
decreased as the distance from road decreased and
traffic amount increased. Those who were using bed
recorded high the odds ratio of asthma diagnosis
history, complying with the trend reported by Maier
et al.(1997). This study results confirmed that traffic
amount and use of bed have an influence on the lung
function. The odds ratio of asthma diagnosis history
decreased for those who were breeding a pet and had
more than 4 family members. In Yeosu, a similar
trend was found with pet breeding. Thereby, pet
breeding and large family size seems to help increase
immunity against asthma. And Park et al.(2003)
found out chronic respiratory diseases and wheezing
doubled when the family members were 3 and less.
But the results were not statistically meaningful.
Table 3. The odds ratio of asthma diagnosis history
according to Residence environmentVariables No. of subjects
Asthmatic symptoms
(%)
O.R. 95% C.I.
Distance from road
≧ 100m 630 27(4.3)
< 100m 156 12(7.7) 1.38 0.58-3.28 Traffic amount before house
≦ Average 675 33(4.9)
> Average 72 5(6.9) 1.32 0.58-3.01 Bed use
No 578 27(4.7)
Yes 336 20(6.0) 1.54 0.72-3.28 Breeding Pets at home
No 376 19(5.1)
Yes 532 26(4.9) 0.98 0.44-2.16 No. of Family member
≧ 4 558 27(4.8)
< 4 209 11(5.3) 1.03 0.45.-2.37
**p<0.01, Wald test
3.2.2. Respiratory and Allergic symptoms Questionnaire
The odds ratio of abnormal pulmonary function according to respiratory (wheezing, asthma diagnosis history, wheezing during work-out) and allergic symptoms (nasal congestion, allergic eye disease, allergic rhinitis and allergic dermatitis) are seen in Table 4.
The odds ratio of abnormal pulmonary function was statistically high among those with asthma diagnosis history (OR=4.29, CI=1.75-10.56), wheezing (OR=2.59, CI=1.24-5.41), nasal congestion (OR=2.87, CI=1.36-6.08)(p<0.01), wheezing during work-out (OR=1.12), allergic eye disease (OR=1.13, CI=0.65-1.95) and allergic rhinitis (OR=1.09, CI=
0.80-1.82). Asthma diagnosis history is representative for all respiratory diseases. Wheezing refers to a high-pitched noise produced by movement of air through narrowed airways. This study found that the odds ratio of abnormal pulmonary function is
extremely high among those with wheezing, or wheezing during work-out. This indicates that they are exposed to factors which can cause respiratory diseases or damage lung capacity, and asthma or wheezing are the symptoms. Nasal congestion is one of the most typical symptoms of allergic rhinitis, and indoor dust and outdoor air pollution may have an influence on it(Kim, 2006). It is generally known that about 10 to 15% of entire population is suffering allergic diseases(Jin et al., 2007). And allergic rhinitis has been rising because of increases in air pollution and environmental pollution.
Table 4. The odds ratio abnormal pulmonary function
according to respiratory and allergic symptomsVariables No. of
subjects
Abnormal pulmonary
function(%) O.R. 95% C.I.
Asthma diagnosis history
No 880 94(10.7)
Yes 48 14(29.2) 4.29
**1.75-10.56 Wheezing
No 762 74( 9.7)
Yes 79 17(21.5) 2.59
**1.24-5.41 Exercising wheezing
No 768 95(12.4)
Yes 54 10(18.5) 1.12 0.63-1.84 Nasal obstruction
No 828 5( 4.9)
Yes 102 109(13.2) 2.87
**1.36-6.08 Allergic eye disease
No 643 34(12.5)
Yes 273 96(14.9) 1.13 0.65-1.95 Allergic rhinitis
No 693 15( 6.8)
Yes 222 92(13.3) 1.09 0.80-1.82 Atopy dermatitis
No 766 21(18.4)
Yes 114 105(13.7) 0.48 0.14-1.66
**p<0.01, Wald test
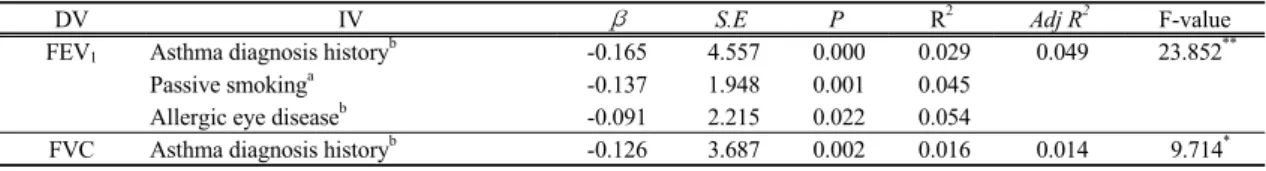
3.2.3. Multiple regression analysis of the factors influencing
To investigate the factors affecting the lung
function of residents, a stepwise multiple regression
analysis was conducted(Table 5). For the analysis,
PFT values including FEV
1and FVC were dependent
DV IV
βS.E P R
2Adj R
2F-value
FEV
1Asthma diagnosis history
b-0.165 4.557 0.000 0.029 0.049 23.852
**Passive smoking
a-0.137 1.948 0.001 0.045
Allergic eye disease
b-0.091 2.215 0.022 0.054
FVC Asthma diagnosis history
b-0.126 3.687 0.002 0.016 0.014 9.714
*DV, dependent variable; IV, independent variable; SE, standard error, *p<0.001 by F-test
a
smoking, Passive-smoking; 0=No, 1=Yes,
bnasal congestion, asthma, allergic rhinitis; 0=No, 1=Yes Table 5. Multiple linear regression by related variables of pulmonary function
Air pollutant Environmental standard Mean ± S.D. G.M.
SO
2(ppb) 50(ppb/24h) 6.13 ± 2.15 5.78
O
3(ppb) 60(ppb/ 8h) 23.58 ± 8.05 22.06
NO
2(ppb) 60(ppb/24h) 16.49 ± 5.52 15.49
CO(ppm) 9(ppm/8h) 5.96 ± 2.52 5.51
PM
10(㎍/㎥) 100(㎍/㎥/24h) 36.99 ± 9.64 35.70
G.M. ; Geometric Mean, S.D. ; Standard Deviation
Table 6. Air pollution concentration in Yeosu (Jan. 2006-Feb. 2007) variables. And independent variables were lifestyle (smoking, passive smoking), respiratory and allergic symptoms (asthma diagnosis history, wheezing, wheezing during work-out, nasal congestion, allergic eye disease, allergic rhinitis and allergic dermatitis).
As a result, the factors affecting FEV
1were symptoms including asthma diagnosis history, passive smoking and allergic eye disease (R
2=0.049, p<0.001) and FVC were symptoms including Asthma diagnosis history (R
2=0.014, p<0.001). Prior studies reported that asthma is more common in the study area that others(NIER, 2008). Therefore, residents in the region might be sensitive to respiratory diseases such as asthma. Choi et al.(2008) reported decreases in lung capacity and increases in asthma severity among patients with cigaret smoking habits or smoking experience. They reported high frequent clinical symptoms. This study result shows that asthma is the biggest cause of decreasing lung capacity. And passive smoking and allergic diseases such as allergic eye diseases posted lower FEV
1and FVC. In conclusion, those who are suffering respiratory and allergic diseases were found to require special management methods.
3.3. Air pollution and Pulmonary function level 3.3.1. Air pollution concentration
Air pollution was analyzed based on the data obtained with the Air Pollution Monitoring Network from March 2006 to February 2007(Table 6).
Average concentration of SO
2, O
3, NO
2, CO and PM
10were 10.77ppb, 28.39ppb, 17.58ppb, 6.01ppm, and 44.72㎍/㎥, below the air quality standards.
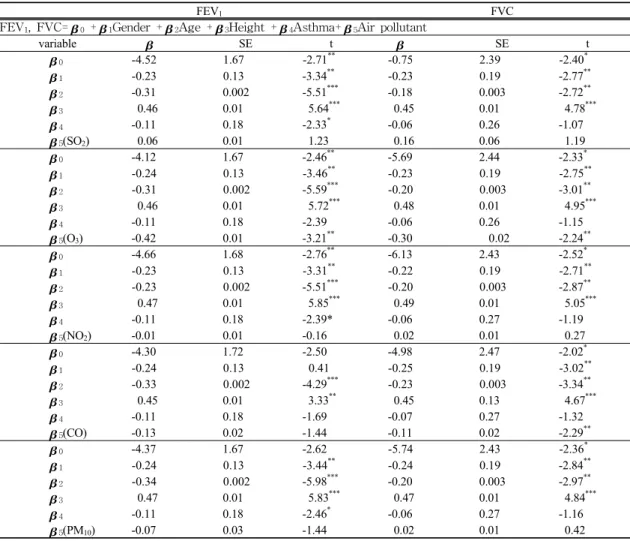
3.3.2. Multiple regression analysis
The controlling factors when conducting studies on relations between lung capacity and air pollution include age, gender, height, and asthma diagnosis history. Accordingly, correlations between air pollutants (SO
2, O
3, NO
2, CO, PM
10) and pulmonary function values(FEV
1, FVC) was analyzed with controling individual factors (gender, age, asthma diagnosis history) in this study. The results are presented in Table 7.
The analysis showed that FVC decreased with increases in O
3and CO(p<0.01). And, FEV
1decreased with increases in O
3.Yeosu Industrial
Complex is one of the largest petrochemical
industrial site with highest production capacity in
FEV1 FVC FEV1, FVC=0 +1Gender +2Age +3Height +4Asthma+5Air pollutant
variable SE t SE t
0 -4.52 1.67 -2.71** -0.75 2.39 -2.40*
1 -0.23 0.13 -3.34** -0.23 0.19 -2.77**
2 -0.31 0.002 -5.51*** -0.18 0.003 -2.72**
3 0.46 0.01 5.64*** 0.45 0.01 4.78***
4 -0.11 0.18 -2.33* -0.06 0.26 -1.07
5(SO2) 0.06 0.01 1.23
0.16
0.06
1.19
0 -4.12 1.67 -2.46** -5.69 2.44 -2.33*
1 -0.24 0.13 -3.46** -0.23 0.19 -2.75**
2 -0.31 0.002 -5.59*** -0.20 0.003 -3.01**
3 0.46 0.01 5.72*** 0.48 0.01 4.95***
4 -0.11 0.18 -2.39 -0.06 0.26 -1.15
5(O3) -0.42 0.01 -3.21** -0.30 0.02 -2.24**
0 -4.66 1.68 -2.76** -6.13 2.43 -2.52*
1 -0.23 0.13 -3.31** -0.22 0.19 -2.71**
2 -0.23 0.002 -5.51*** -0.20 0.003 -2.87**
3 0.47 0.01 5.85*** 0.49 0.01 5.05***
4 -0.11 0.18 -2.39* -0.06 0.27 -1.19
5(NO2) -0.01 0.01 -0.16 0.02 0.01 0.27
0 -4.30 1.72 -2.50 -4.98 2.47 -2.02*
1 -0.24 0.13 0.41 -0.25 0.19 -3.02**
2 -0.33 0.002 -4.29*** -0.23 0.003 -3.34**
3 0.45 0.01 3.33** 0.45 0.13 4.67***
4 -0.11 0.18 -1.69 -0.07 0.27 -1.32
5(CO) -0.13 0.02 -1.44 -0.11 0.02 -2.29**
0 -4.37 1.67 -2.62 -5.74 2.43 -2.36*
1 -0.24 0.13 -3.44** -0.24 0.19 -2.84**
2 -0.34 0.002 -5.98*** -0.20 0.003 -2.97**
3 0.47 0.01 5.83*** 0.47 0.01 4.84***
4 -0.11 0.18 -2.46* -0.06 0.27 -1.16
5(PM10) -0.07 0.03 -1.44 0.02 0.01 0.42
* p<0.05, **p<0.01, ***p<0.001, S.E : Standard error