Received: December 29, 2017 Revised: March 19, 2018 Accepted: March 19, 2018
OPEN ACCESS
HORTICULTURAL SCIENCE and TECHNOLOGY 36(4):598-605, 2018
URL: http://www.kjhst.org pISSN : 1226-8763 eISSN : 2465-8588
This is an Open Access article distributed under the terms of the Creative Commons Attribution Non-Commercial License which permits unrestricted non-commercial use, distribution, and reproduction in any medium, provided the original work is properly cited.
Copyrightⓒ2018 Korean Society for Horticultural Science.
This research was supported by the Export Promotion Technology Development program (315041-05), Ministry of Agriculture, Food and
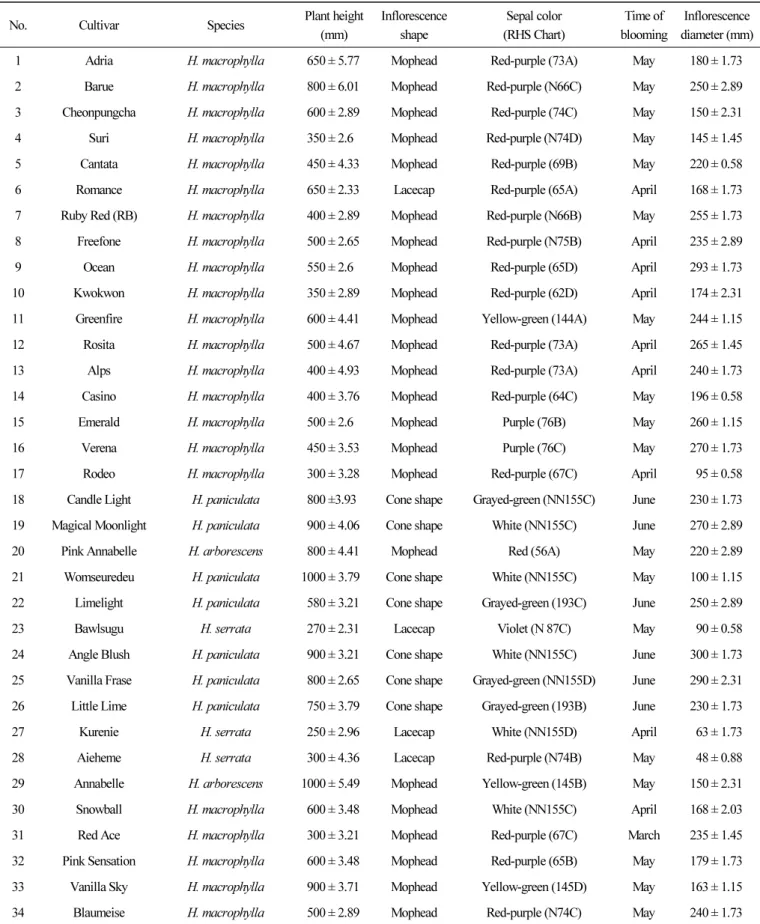
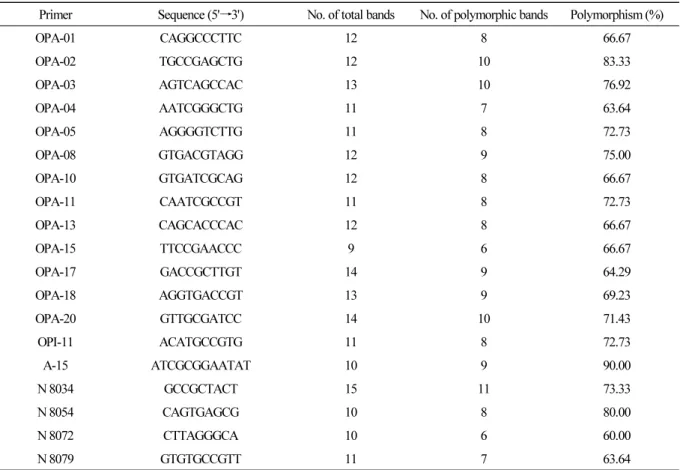
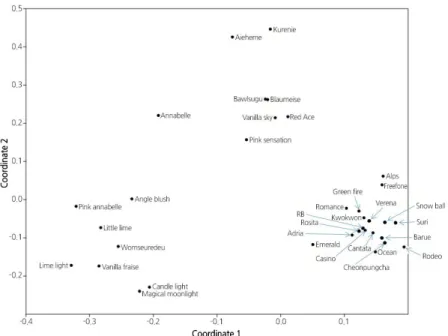
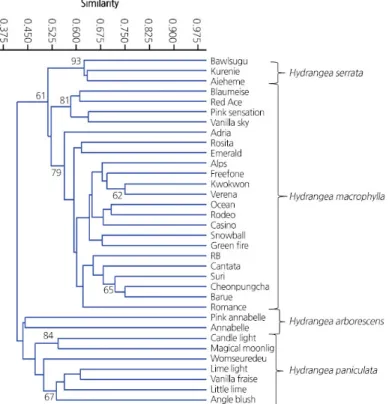
Characterization of Hydrangea Accessions Based on Morphological and Molecular Markers
May Thinn Khaing 1 , Hyo Jin Jung 1,2 , Jong Bo Kim 3 , and Tae-Ho Han 1,2*
1
Department of Horticulture, Chonnam National University, Gwangju 61186, Korea
2
GARDENPLANT(Co., Ltd.), Gwangju 61186, Korea
3