IEG 환경지질연구정보센터
17
0
0
전체 글
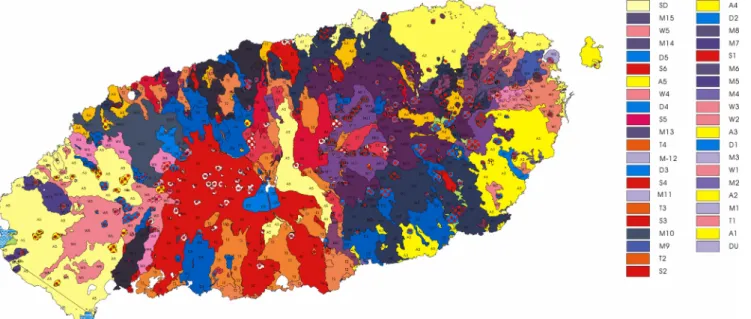
(2) 398. Taehee Kim, Deok-Cheol Moon, Won-Bae Park, Ki-Hwa Park and Gi-Won Ko. tracer studies of spring discharge have been performed for volcanic islands (Davis et al., 1970; Maoszewski, and Zuber, 1982; Lee et al., 1999; Koh et al., 2005). Lee et al. (1999) used 18O, a stable isotope, as an indicator to characterize groundwater circulation. Koh et al. (2005) used 3H and nitrate to evaluate the residence time of groundwater. Both of these studies tried to identify the groundwater circulation system of Jeju Island using environmental tracers, but the investigation of annual groundwater circulation using these kinds of tracers has rarely been reported. Hildenbrand et al. (2005) tried to identify the groundwater circulation system on the volcanic island of Tahiti using extensive isotopic data. Most isotopic environmental tracer studies cannot characterize the temporal aspects of the annual groundwater systems without evaluating reasonable conceptual models of the physical groundwater circulation system. From the viewpoint of water resource management, knowledge of the annual cycle of groundwater circulation is important to establish annual water supply plans. In annual water budget analysis, the most fundamental step is to evaluate precisely the total amount of annual precipitation, direct runoff, and groundwater discharge. Particularly, in cases in which the public water supply source is entirely dependent on groundwater resources, such as is the case on volcanic islands, the temporal relationships among rainfall and recharge of and discharge from the groundwater system are very important. Most groundwater discharge is highly related to widely distributed springs. On Jeju Island, the local government has surveyed the distribution of springs to aid in the efficient management of water resources; 911 springs have been reported along with their locations, apparent discharge rates, and major ion concentrations (Jeju Province, 1999). Recently, more detailed features of these. Fig. 1. Geologic map in Jeju (KIGAM, 2005).. springs have been surveyed, including temporal variation in spring discharge rates and the ratio of the maximum and minimum discharge rate for each spring (Jeju, 2001; Jeju Province, 2002; Jeju Province and KOWACO, 2003). However, these survey results have not been applied to the interpretation of the groundwater circulation system of Jeju Island. Therefore, our objectives were to: classify springs on Jeju Island using cluster analysis based on the recorded time series of spring discharge; investigate the relationship between geological features and the spring classification; and provide a robust conceptual model of groundwater circulation on Jeju Island. 2. GEOLOGICAL AND HYDROGEOLOGICAL FEATURES OF JEJU ISLAND For Jeju Island, the most important controlling factor of the groundwater flow system is the geological setting. The geological structure of Jeju Island is very complicated because of the sequence of eruption, properties of lava, and variation in the estimated paleological mean sea levels. The complicated hydrogeological features of Jeju Island are a consequence of the complex geological structure. One of the most important factors controlling the groundwater system is the depth of the U formation. Generally, the U formation is distributed at 120 m below mean sea level and is considered to represent coastal sediments near a widely distributed delta when Jeju Island was a peninsula of the continent; in other words, the mean sea level was much lower than it is now. The U formation is composed mainly of clay and sand with unconsolidated facies. The U formation is important hydrogeologically because it has a high water content that can interact with magma from the Earth’s core..
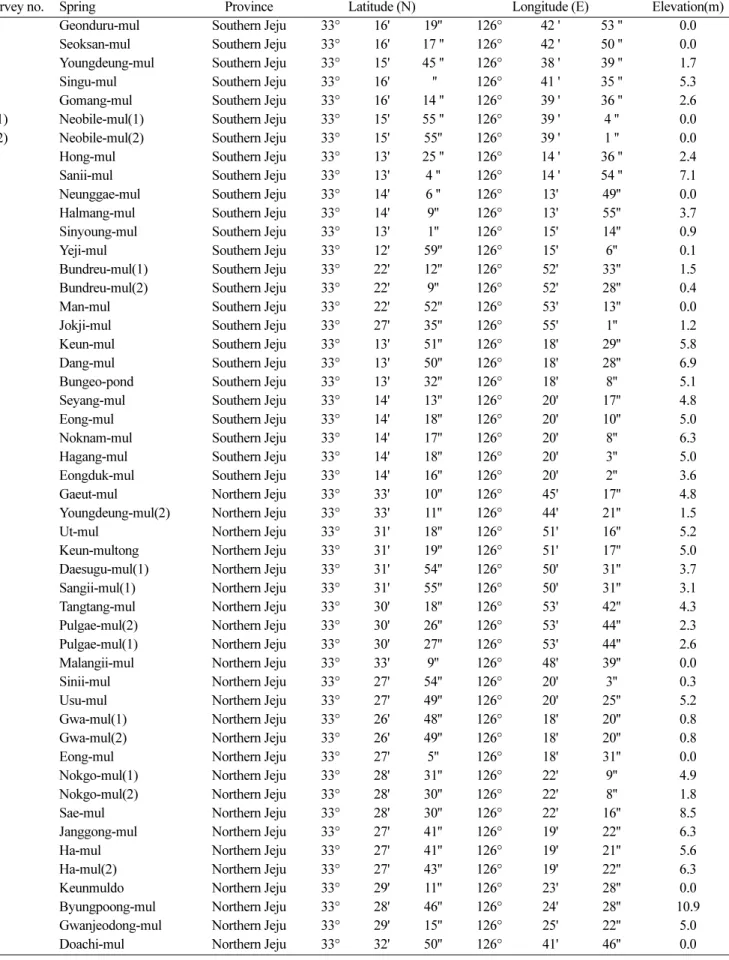
(3) Classification of springs (on Jeju Island) with clustering analysis. 399. Table 1. Locations of springs Survey no. 1 2 3 4 5 6(1) 6(2) 7 8 9 10 11 12 13 14 15 16 17 18 19 20 21 22 23 24 25 26 27 28 29 30 31 32 33 34 35 36 37 38 39 40 41 42 43 44 45 46 47 48 49. Spring Geonduru-mul Seoksan-mul Youngdeung-mul Singu-mul Gomang-mul Neobile-mul(1) Neobile-mul(2) Hong-mul Sanii-mul Neunggae-mul Halmang-mul Sinyoung-mul Yeji-mul Bundreu-mul(1) Bundreu-mul(2) Man-mul Jokji-mul Keun-mul Dang-mul Bungeo-pond Seyang-mul Eong-mul Noknam-mul Hagang-mul Eongduk-mul Gaeut-mul Youngdeung-mul(2) Ut-mul Keun-multong Daesugu-mul(1) Sangii-mul(1) Tangtang-mul Pulgae-mul(2) Pulgae-mul(1) Malangii-mul Sinii-mul Usu-mul Gwa-mul(1) Gwa-mul(2) Eong-mul Nokgo-mul(1) Nokgo-mul(2) Sae-mul Janggong-mul Ha-mul Ha-mul(2) Keunmuldo Byungpoong-mul Gwanjeodong-mul Doachi-mul. Province Southern Jeju Southern Jeju Southern Jeju Southern Jeju Southern Jeju Southern Jeju Southern Jeju Southern Jeju Southern Jeju Southern Jeju Southern Jeju Southern Jeju Southern Jeju Southern Jeju Southern Jeju Southern Jeju Southern Jeju Southern Jeju Southern Jeju Southern Jeju Southern Jeju Southern Jeju Southern Jeju Southern Jeju Southern Jeju Northern Jeju Northern Jeju Northern Jeju Northern Jeju Northern Jeju Northern Jeju Northern Jeju Northern Jeju Northern Jeju Northern Jeju Northern Jeju Northern Jeju Northern Jeju Northern Jeju Northern Jeju Northern Jeju Northern Jeju Northern Jeju Northern Jeju Northern Jeju Northern Jeju Northern Jeju Northern Jeju Northern Jeju Northern Jeju. 33° 33° 33° 33° 33° 33° 33° 33° 33° 33° 33° 33° 33° 33° 33° 33° 33° 33° 33° 33° 33° 33° 33° 33° 33° 33° 33° 33° 33° 33° 33° 33° 33° 33° 33° 33° 33° 33° 33° 33° 33° 33° 33° 33° 33° 33° 33° 33° 33° 33°. Latitude (N) 16' 16' 15' 16' 16' 15' 15' 13' 13' 14' 14' 13' 12' 22' 22' 22' 27' 13' 13' 13' 14' 14' 14' 14' 14' 33' 33' 31' 31' 31' 31' 30' 30' 30' 33' 27' 27' 26' 26' 27' 28' 28' 28' 27' 27' 27' 29' 28' 29' 32'. 19'' 17 '' 45 '' '' 14 '' 55 '' 55'' 25 '' 4 '' 6 '' 9'' 1'' 59'' 12'' 9'' 52'' 35'' 51'' 50'' 32'' 13'' 18'' 17'' 18'' 16'' 10'' 11'' 18'' 19'' 54'' 55'' 18'' 26'' 27'' 9'' 54'' 49'' 48'' 49'' 5'' 31'' 30'' 30'' 41'' 41'' 43'' 11'' 46'' 15'' 50''. 126° 126° 126° 126° 126° 126° 126° 126° 126° 126° 126° 126° 126° 126° 126° 126° 126° 126° 126° 126° 126° 126° 126° 126° 126° 126° 126° 126° 126° 126° 126° 126° 126° 126° 126° 126° 126° 126° 126° 126° 126° 126° 126° 126° 126° 126° 126° 126° 126° 126°. Longitude (E) 42 ' 42 ' 38 ' 41 ' 39 ' 39 ' 39 ' 14 ' 14 ' 13' 13' 15' 15' 52' 52' 53' 55' 18' 18' 18' 20' 20' 20' 20' 20' 45' 44' 51' 51' 50' 50' 53' 53' 53' 48' 20' 20' 18' 18' 18' 22' 22' 22' 19' 19' 19' 23' 24' 25' 41'. 53 '' 50 '' 39 '' 35 '' 36 '' 4 '' 1 '' 36 '' 54 '' 49'' 55'' 14'' 6'' 33'' 28'' 13'' 1'' 29'' 28'' 8'' 17'' 10'' 8'' 3'' 2'' 17'' 21'' 16'' 17'' 31'' 31'' 42'' 44'' 44'' 39'' 3'' 25'' 20'' 20'' 31'' 9'' 8'' 16'' 22'' 21'' 22'' 28'' 28'' 22'' 46''. Elevation(m) 0.0 0.0 1.7 5.3 2.6 0.0 0.0 2.4 7.1 0.0 3.7 0.9 0.1 1.5 0.4 0.0 1.2 5.8 6.9 5.1 4.8 5.0 6.3 5.0 3.6 4.8 1.5 5.2 5.0 3.7 3.1 4.3 2.3 2.6 0.0 0.3 5.2 0.8 0.8 0.0 4.9 1.8 8.5 6.3 5.6 6.3 0.0 10.9 5.0 0.0.
(4) 400. Taehee Kim, Deok-Cheol Moon, Won-Bae Park, Ki-Hwa Park and Gi-Won Ko. Table 1. (continued). Survey no. Spring 50 Sawonii-mul 51 Jeongjit-mul 52 Keun-mul(1) 53 Keun-mul(3) 54 Keun-mul(2) 55 Keun-mul(woman bath) 56 Sinheung-mul 57 Suruk-mul(1) 58 Suruk-mul(2) 59 Apbille-mul 60 Eok-mul(1) 61 Eok-mul(2) 62 Eok-mul(3) 63 bille-mul 64 Keun-mul 65 Sonde-mul 66 Singe-mul(man bath) 67 Singe-mul(woman bath) 68(1) Samdongnang-mul(1) 68(2) Samdongnang-mul(2) 69 Pae-mul 70 Gaemutgae 71 Eomsu-mul 72 Hwasang-su 73 Gumdeulegi-mul 74 Bangdanii-mul 75 No name 76 Dwe-mul 77 Keunii-mul 78 Mangeum-mul 79 Namdang-su 80 Old Man-bath 81 Eong-mul 82 Jakji-mul 83 Mumdu-mul 84 Jo-mul(1) 85 Eok-mul 86 Donji-mul(1) 87 Keun-mul 88 Don-mul 89(1) Eongduk-mul(1) 89(2) Eongduk-mul(2) 90 Maechi-mul 91 Joitong-mul 92 Seonguitnae-mul 93 Sojeongbang-spring(2) 94 Sojeongbang-spring(1) 95 Seogareum-mul 96 Eongduk-mul 97 Donggareum-mul. Province Northern Jeju Northern Jeju Northern Jeju Northern Jeju Northern Jeju Northern Jeju Northern Jeju Northern Jeju Northern Jeju Northern Jeju Northern Jeju Northern Jeju Northern Jeju Northern Jeju Northern Jeju Northern Jeju Northern Jeju Northern Jeju Northern Jeju Northern Jeju Northern Jeju Northern Jeju Northern Jeju Northern Jeju Northern Jeju Northern Jeju Northern Jeju Northern Jeju Northern Jeju Northern Jeju Northern Jeju Northern Jeju Northern Jeju Northern Jeju Northern Jeju Northern Jeju Northern Jeju Northern Jeju Northern Jeju Northern Jeju Northern Jeju Northern Jeju Northern Jeju Seguipo Seguipo Seguipo Seguipo Seguipo Seguipo Seguipo. 33° 33° 33° 33° 33° 33° 33° 33° 33° 33° 33° 33° 33° 33° 33° 33° 33° 33° 33° 33° 33° 33° 33° 33° 33° 33° 33° 33° 33° 33° 33° 33° 33° 33° 33° 33° 33° 33° 33° 33° 33° 33° 33° 33° 33° 33° 33° 33° 33° 33°. Latitude (N) 32' 32' 32' 32' 32' 32' 32' 31' 31' 31' 31' 31' 31' 32' 32' 21' 20' 20' 20' 20' 20' 19' 21' 21' 26' 26' 26' 26' 26' 26' 26' 26' 26' 24' 24' 24' 25' 25' 25' 25' 25' 25' 23' 13' 14' 14' 14' 14' 14' 14'. 49'' 49'' 3'' 4'' 4'' 39'' 40'' 59'' 58'' 57'' 59'' 59'' 58'' 10'' 16'' 36'' 25'' 22'' 20'' 20'' 28'' 43'' 39'' 46'' 7'' 22'' 24'' 25'' 26'' 37'' 41'' 44'' 33'' 4'' 3'' 2'' 32'' 29'' 19'' 22'' 54'' 53'' 35'' 46'' 24'' 37'' 36'' 1'' 2'' 2''. 126° 126° 126° 126° 126° 126° 126° 126° 126° 126° 126° 126° 126° 126° 126° 126° 126° 126° 126° 126° 126° 126° 126° 126° 126° 126° 126° 126° 126° 126° 126° 126° 126° 126° 126° 126° 126° 126° 126° 126° 126° 126° 126° 126° 126° 126° 126° 126° 126° 126°. Longitude (E) 41' 41' 37' 37' 37' 39' 39' 38' 38' 38' 38' 38' 38' 38' 38' 11' 10' 10' 10' 10' 10' 9' 11' 12' 16' 17' 17' 17' 17' 17' 18' 18' 18' 15' 15' 15' 15' 15' 15' 15' 16' 16' 14' 30' 26' 34' 34' 31' 31' 31'. 44'' 40'' 16'' 18'' 17'' 13'' 14'' 4'' 4'' 6'' 8'' 9'' 8'' 18'' 18'' 39'' 34'' 35'' 21'' 23'' 42'' 59'' 54'' 14'' 11'' 4'' 28'' 39'' 42'' 55'' 9'' 9'' 6'' 51'' 53'' 50'' 54'' 57'' 59'' 56'' 28'' 31'' 38'' 4'' 57'' 43'' 45'' 3'' 3'' 3''. Elevation(m) 3.2 4.8 0.6 0.2 0.7 5.0 5.0 0.6 1.3 1.1 0.0 0.0 0.0 1.1 1.1 5.2 3.1 2.5 4.7 4.7 0.0 2.4 0.7 4.1 0.0 1.4 1.7 1.3 0.0 0.8 0.0 1.2 5.4 6.4 5.4 1.7 0.0 1.7 4.2 4.3 4.3 0.4 20.3 48.6 0.0 0.0 0.0 0.0 0.0.
(5) Table 1. (continued). Survey no. Spring 98 Jomyung-mul 99 Jaguri-mul 100 Sonagmeori 101 Geomeutyeout-mul 102 Nonjit-mul(1) 103 Sanji-mul 104 Geumsan-mul 105 Orae-mul(2) 106 Orae-mul(1) 107 Mal-mul(2) 108 Mal-mul(1) 109 Keun-mul(1) 110 Jung-mul 110 Jung-mul 111(1) Eong-mul(1,2,3) 111(2) Eong-mul(1,2,3) 112 Dakeune-mul 113 Dong-mul 114 Gomang-mul 115 Swe-mul 116 Seochang-mul(1,2) 117 Gorae-mul. Classification of springs (on Jeju Island) with clustering analysis. Province Seguipo Seguipo Seguipo Seguipo Seguipo Jeju Jeju Jeju Jeju Jeju Jeju Jeju Jeju Jeju Jeju Jeju Jeju Jeju Jeju Jeju Jeju Jeju. 33° 33° 33° 33° 33° 33° 33° 33° 33° 33° 33° 33° 33° 33° 33° 33° 33° 33° 33° 33° 33° 33°. Latitude (N) 14' 14' 14' 14' 14' 30' 30' 30' 30' 30' 30' 31' 30' 30' 30' 30' 30' 29' 29' 31' 31' 31'. 47'' 20'' 25'' 30'' 3'' 44'' 46'' 2'' 3'' 23'' 22'' 33'' 44'' 44'' 28'' 29'' 52'' 38'' 28'' 19'' 16'' 19''. 126° 126° 126° 126° 126° 126° 126° 126° 126° 126° 126° 126° 126° 126° 126° 126° 126° 126° 126° 126° 126° 126°. Longitude (E) 24' 34' 34' 35' 23' 31' 31' 28' 28' 28' 28' 35' 30' 30' 29' 29' 30' 27' 27' 34' 33' 34'. 401. '' 11'' 19'' 15'' 26'' 52'' 59'' 11'' 10'' 47'' 48'' 28'' 58'' 59'' 8'' 8'' 9'' 6'' 17'' 10'' 60'' 12''. Elevation(m) 55.0 4.1 12.2 7.9 10.0 9.5 7.2 5.1 4.6 0.0 0.0 1.2 0.0 0.0 0.6 0.6 1.2 4.3 11.2 0.0 1.1 1.5. Fig. 2. locations of installed wells in Jeju (KIGAM, 2005).. This interaction can result in the formation of tuff with low permeability. Based on the ground surface geology of Jeju Island (Fig. 1; KIGAM, 2004), it is estimated that there were at least 41 eruptions, which produced various types of widely distributed basalt formation. Basalt distributed on the ground sur-. face can be categorized in to six types: basalt, olivine basalt, feldspar-augite trachy basalt, augite-feldspar trachy basalt (I), augite-feldspar trachy basalt (II), and trachyte (KIGAM, 2004). The superposed volcanic rocks, classified into six groups, compose complicated geological structures. The complexity of these geological structures hinders the inter-.
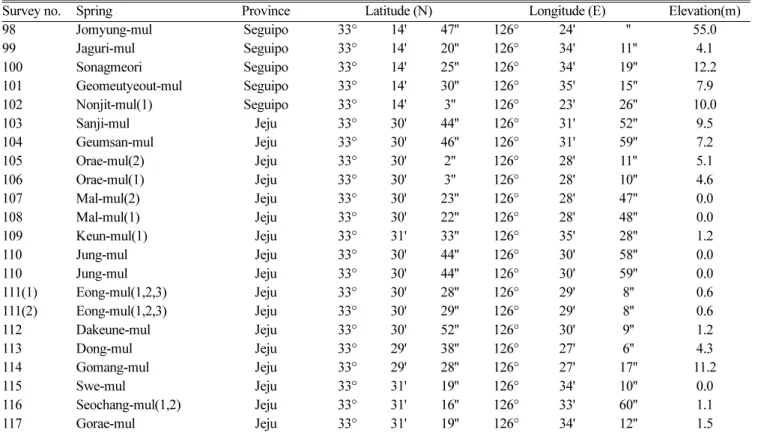
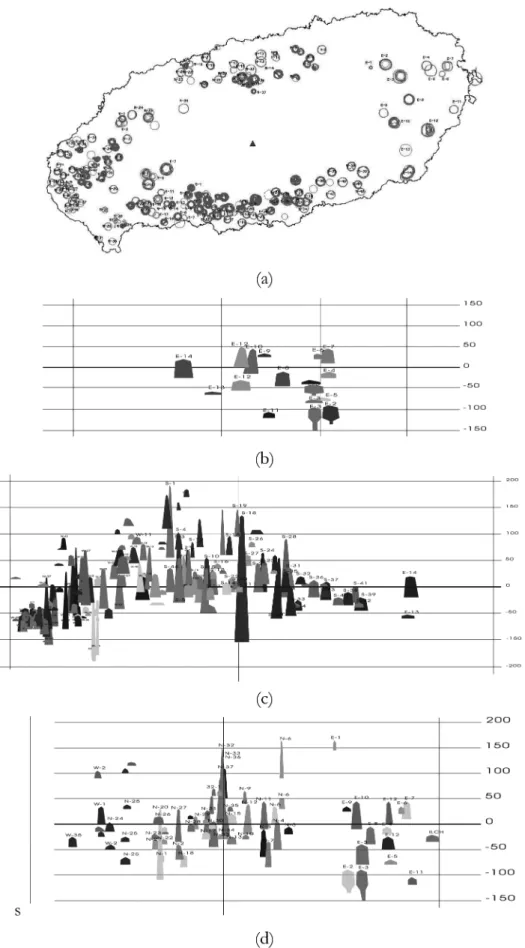
(6) 402. Taehee Kim, Deok-Cheol Moon, Won-Bae Park, Ki-Hwa Park and Gi-Won Ko. Fig. 3. Spatial distribution of tuff in Jeju : (a) plain view, (b) lateral view from east, (c) lateral view from south, and (d) lateral view from north (KIGAM, 2005)..
(7) Classification of springs (on Jeju Island) with clustering analysis. 403. Fig. 4. Hydraulic head and tuff cone distributions in Jeju Island (result of kriging with measured head data; KIGAM, 2005).. pretation of the hydrogeological system of Jeju Island. The most hydrogeologically important factors seem to be the locations of geological boundaries, paleological mean sea levels, and tuff distributions. It is evident that most springs on Jeju Island are located on geological boundaries (Table 1; Jeju Province, 1999), and the variation in paleological mean sea levels produced the various elevations of hyaloclastite, which can be formed by the interaction of low-viscosity lava with seawater and has high porosity and permeability. Thus, it can be deduced that the boundary between each volcanic formation and the distributed hyaloclastite can be a conduit for groundwater flow on Jeju Island. In contrast, tuff formations can be barriers to groundwater flow because those on Jeju Island have relatively low permeability. The distributions of underground tuff formations (Fig. 3a) were determined based on data from core descriptions (Fig. 2). It is quite interesting that the apparent hydraulic gradient, obtained from the measured hydraulic head (Fig. 2), is well correlated with the spatial distribution of tuff formations on Jeju Island (Fig. 4). 3. MATERIALS AND METHODS To analyze the regional groundwater system of Jeju Island, more meaningful data than conventional hydraulic tests such as pumping tests can be used to analyze correlations related to the temporal patterns of variation in spring discharge data. To interpret the regional groundwater sys-. tem of Jeju Island, we used cluster analysis of monthly discharge variables, i.e., discharge, electrical conductivity (EC), pH, and temperature, at 121 springs (Table 2, Fig. 5). Early data (between June 2002 and May 2003) were a portion of the results from an analysis by Jeju Province and KOWACO (2003). Beginning in March 2004, spring data were collected once every three months. To remove the tidal effect from coastal springs, spring flow rates were measured during ebb tide. We used the Pearson correlation method to apply cluster analysis to the interpretation of the regional groundwater system using collected spring data and to define the rescaled distance between clusters. Pearson correlation (P.C.) is defined as following equation (StatSoft, Inc., 2006),. ∑ ( xi – x ) ( yi – y ) i P.C. = -----------------------------------( n – 1 )Sx Sy. (1). where, xi and yi are i-th components of data set X and Y respectively, Sx and Sy sample means of X and Y, Sx and Sy sample standard deviations, n is total number of data point. When analyzing the regional groundwater system of a complex system using hydrological data, the absolute values of spring discharge rates are not as important as patterns of temporal variation in discharge. On Jeju Island, the absolute value of spring discharge is mainly related to the size of the conduit, which is related to local geological conditions. The distance or squared-distance methods (eq. (2); StatSoft, Inc.,.
(8) 404. Taehee Kim, Deok-Cheol Moon, Won-Bae Park, Ki-Hwa Park and Gi-Won Ko. Fig. 5. Locations of surveyed springs.. 2006), which are generally used in cluster analysis, can lead to inappropriate results in the analysis of regional groundwater systems using time series of spring discharges because the distance and squared distance between two data sets provide limited information that is highly related to local hydrological conditions such as the hydraulic conductivity of conduits that are directly linked to the ground surface. Distance(x, y) = ⎧ ( x – y )2 ⎪ ∑i i i ⎪ 1 ⎪ --⎪ ⎧ ( x – y ) 2 ⎫2 ⎪⎨∑ i i ⎬ ⎭ ⎪⎩ i ⎪ ⎨ ∑ xi – yi ⎪i ⎪ Maximum x – y i i ⎪ ⎪ 1 --⎪⎧ ⎫r ⎪ ⎨ ∑ ( xi – yi )p ⎬ ⎪⎩ i ⎭ ⎩. Enclidean Distance. Squared Enclidean Distance. able pattern in pH. Therefore, we analyzed only the discharge rate, temperature, and EC. We first performed a separate cluster analysis for each of discharge rate, temperature, and EC. These analyses indicated that the classification patterns for discharge rate and temperature were highly similar, but the pattern for EC was quite different. Thus, we used discharge and temperature data simultaneously in a cluster analysis. The most important controlling factor for EC at most springs was the spatial relation to the coastline. Temporal patterns in EC are less important than its absolute value. Therefore, we used Pearson correlation for cluster analyses of discharge and temperature and the nearest neighbor of EC. 4. RESULTS OF CLUSTER ANALYSIS. City-block Distance. (2) 4.1. Discharge and Temperature. City-block Distance Power Distance. The similarity in the pattern between sequences of data can be more important than the distance between absolute values in collected data sets. Among the data collected from the 121 springs that we analyzed (Table 2), there was no notice-. All 121 springs were divided into groups using cluster analysis of discharge rate and temperature data. Generally, groups with lower numbers had higher within-group similarity than did those with higher numbers; for example, springs in group 2 had higher similarity than did those in group 3. Based on the similarities evaluated using cluster analysis, all 121 springs were categorized into nine groups. Strong seasonal variation was explicitly observed in the groups with lower numbers (i.e., groups 1 to 3). The mea-.
(9) Classification of springs (on Jeju Island) with clustering analysis. 405. Fig. 6. Result of clustering analysis with discharge and temperature data.. sured flow rates were much higher in summer (June–September) than in winter. In contrast, there was little seasonal. variation in flow rates in groups that had higher numbers (i.e., groups 4 to 9). In these groups, there were multiple.
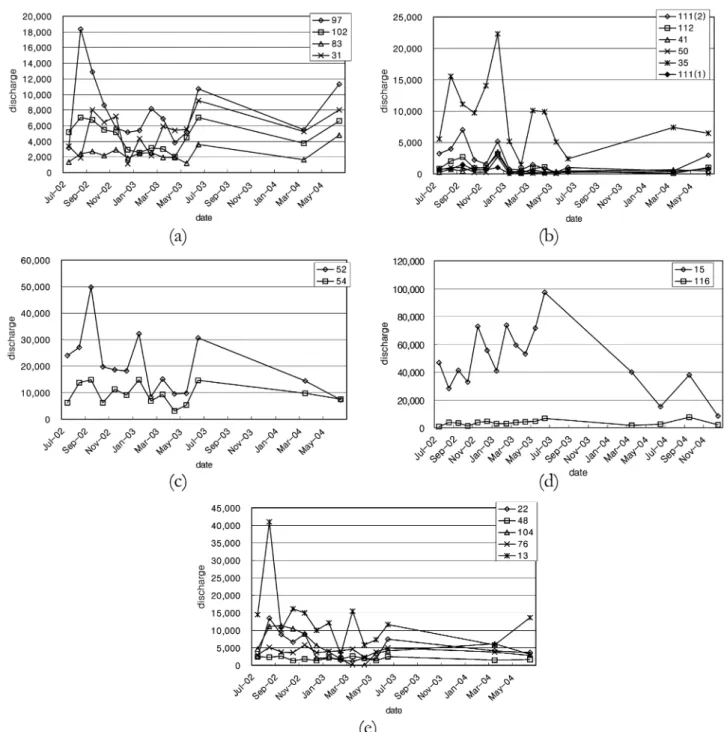
(10) 406. Taehee Kim, Deok-Cheol Moon, Won-Bae Park, Ki-Hwa Park and Gi-Won Ko. Fig. 7. Monthly variation of spring discharge (ton/day) in group 1: (a) 1-1, (b) 1-2, (c) 1-3, (d) 1-4, (e) 1-5.. peaks in flow rate in winter. Most springs in group 1 exhibited a peak flow rate in July or August and a decaying trend until the following late spring, even though some springs in group 1 had other smaller peaks (Fig. 7). These flow rate results for group 1 matched the seasonal distribution of rainfall on Jeju Island. Springs in group 1 can be subdivided into five subgroups, each of which can be distinguished based on their decaying trend in flow rate. Springs in subgroup 1-1 exhibited a peak. discharge rate in September and a decreasing trend until the following spring. The seasonal variation in discharge patterns in other subgroups were similar to those of springs in subgroup 1-1, but springs in subgroups 1-2 and 1-3 had a time-shifted discharge rate, with peak discharge rates in August. Subgroups 1-2 and 1-3 can be distinguished by the minor peak in discharge rates in March. Springs in subgroups 1-4 and 1-5 also had a decaying trend in flow rates from August to the following April, with multiple minor.
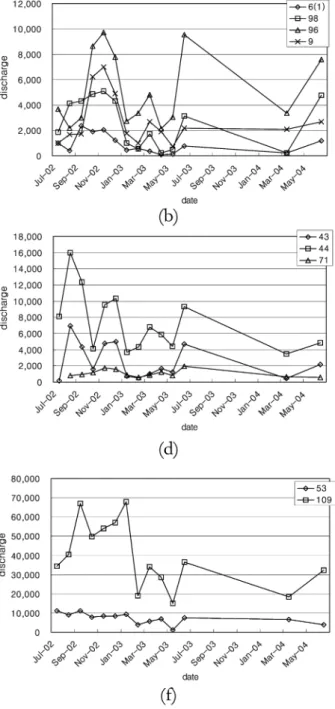
(11) Classification of springs (on Jeju Island) with clustering analysis. 407. Fig. 8. Monthly variation of spring discharge (ton/day) in group 2, 3, 4: (a) 2-1, (b) 2-2, (c) 3-1, (d) 3-2, (e) 3-3, (f) 4-1, (h) 4-2, (h) 4-3..
(12) 408. Taehee Kim, Deok-Cheol Moon, Won-Bae Park, Ki-Hwa Park and Gi-Won Ko. Fig. 9. Monthly variation of spring discharge (ton/day) in group 5: (a) 5-1, (b) 5-2, (c) 5-3, (d) 5-4, (e) 5-5.. peaks in discharge. The discharge rates of springs in groups 2 and 3 had features similar to the springs in group 1, although the timing of peak flow rates was later than in group 1 (in September and/or October). These features of groups 1, 2, and 3 were concordant with those of a previous survey in which it was reported that the peak flow rate occurs mainly between September and October and a there is a decaying trend in flow rates until the following spring (Jeju Province and KOWACO, 2003). However, only 49 of the 121 springs matched the pattern reported by Jeju Province and KOWACO (2003).. The time series of spring flow rates in other groups showed very complicated patterns. For groups 4-1, 4-3, 52, 9-1, and 9-2, peak flow rates were recorded even in winter (December–February). These measured results for springs in groups 4 to 9 did not match the results of a previous survey (Jeju Province and KOWACO, 2003). In these groups (4 to 9 and partly 3), multiple peaks in discharge rates were evident and later peaks were recorded in winter (December–March). At some springs, the highest discharges were measured in winter, rather than in summer or early fall (groups 4, 5-2, and 9-2)..
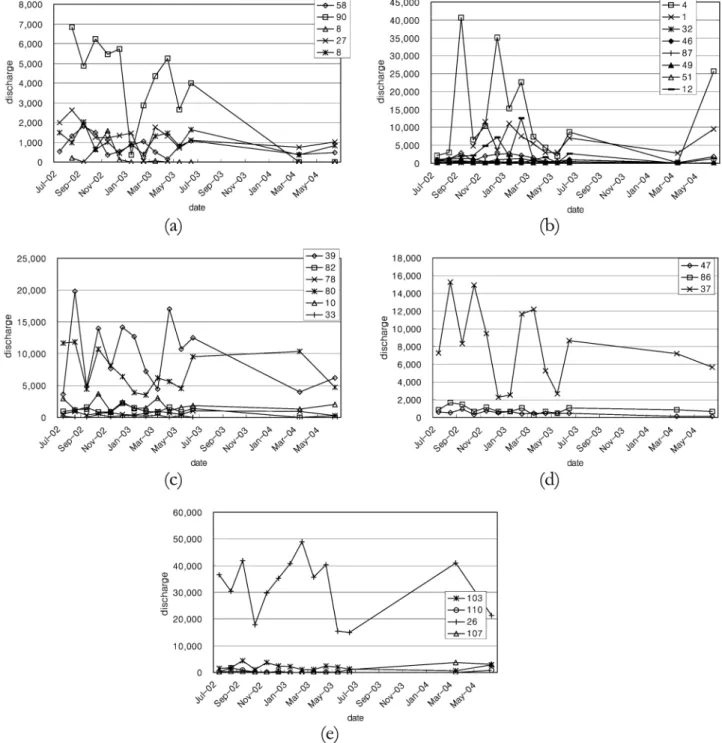
(13) Classification of springs (on Jeju Island) with clustering analysis. 4.2 Electrical Conductivity For variation in EC, springs were classified based on the distance between each measured data set; the 121 springs were divided into 10 groups. Group 1, the largest group among the 10 groups, was subdivided into four subgroups based on maximum EC: <500 µS/cm, group 1-1; 500–1000 µS/cm, group 1-2; 1000–5000 µS/cm, group 1-3; >5000 µS/cm, group 1-4. However, even within a group, the temporal variation in EC of each spring frequently showed a. 409. distinct pattern. Considering that conventional EC values in inland areas of Jeju Island are approximately 100 µS/cm, it is reasonable to assume that springs with EC > 500 µS/cm are influenced by seawater (unless there was substantial contamination). It is conventionally assumed that mixed zones that have both fresh and saline groundwater can be generally distributed in coastal aquifers. Therefore, we assumed that springs with EC > 1000 µS/cm were under the direct influence of seawater, but there is no definite criterion related to the intrusion of seawater. The Jeju provincial gov-. Fig. 10. Monthly variation of spring discharge (ton/day) in group 6, 7, 8, 9: (a) 6, (b) 7, (c) 8, (d) 9-1, (e) 9-2..
(14) 410. Taehee Kim, Deok-Cheol Moon, Won-Bae Park, Ki-Hwa Park and Gi-Won Ko. Fig. 11. Monthly distribution of rainfall in Jeju Island; (a) Jeju station, (b) Seongsanpo station, (c) Seoguipo station, (d) Gosan station (KMA).. ernment has suggested that 3.5% (1750 µS/cm) and 35% (17,500 µS/cm) of the typical EC of seawater (50,000 µS/ cm) can be used as criteria to distinguish “low-salt groundwater” from fresh groundwater (Jeju Province, 2002) such that spring water with EC between 1750 µS/cm and 17,500 µS/ cm is low-salt groundwater. In fact, it is very difficult to provide an explicit definition of “low-salt groundwater.” For this reason, we tried to classify the springs through cluster analysis using the relative distance between each of the measured data sets. Most springs in group 1 had low EC (< 500 µS/cm). Even though the maximum EC at springs in groups 1-3 and 1-4 were approximately 1000 µS/cm and 18,000 µS/cm, respectively, typical EC values in these subgroups were mostly <500 µS/cm. The maximum EC values were recorded in December 2002, January 2003, and March 2004 (the general drought period in Korea). These robust responses for maximum EC have been appropriately described in previous studies (Jeju Province, 2002; Jeju Province and KOWACO, 2003). However, if we analyze the measured data in detail, we can easily recognize that the temporal distribution of measured EC is more complicated. Compared to springs in group 1, springs in other groups (groups 3 to 10) always had high EC (> 500 µS/cm) and the maximum EC values were > 1300 µS/cm in every case. The springs in groups with higher numbers had higher maximum EC values. High EC (> 30,000 µS/cm) were frequently observed for springs in groups 9 and 10.. 5. DISCUSSION Groundwater systems on many volcanic islands are quite complicated, and the complexity of the groundwater system can present many difficulties in surveys and the establishment of public water supply plans (Jeju Province, 2002; Jeju Province and KOWACO, 2003; Hildenbrand et al., 2005). Groundwater is the most important source of water supply from the viewpoints of both quantity and quality. There have been plenty of attempts to identify the groundwater flow system of Jeju Island using conventional survey methods such as pumping tests, packer tests, EC logging, and groundwater level monitoring. However, conventional pumping and packer tests cannot provide sufficient information on the regional groundwater system of volcanic islands such as Jeju Island of Korea and Big Island of Hawaii because the transmissivities are too high to cause a remarkable drawdown in conventional pumping tests in many cases, especially on Jeju Island. Thus, we attempted to robustly identify the groundwater system of Jeju Island using cluster analyses of monthly measured spring data on discharge rate, temperature, and EC. Generally, the temporal variation in the hydraulic response is thought to depend primarily on the spatial distribution of hydraulic properties. From this viewpoint, time series studies of spring discharge can provide various types of information on groundwater systems. Cluster analysis is a powerful method by which to clas-.
(15) Classification of springs (on Jeju Island) with clustering analysis. sify springs based on their discharge rate and EC. Our analysis categorized 121 springs into 10 groups. Springs in groups 1 and 2 showed a general response of a shallow groundwater system to rainfall. For the groundwater system of springs in groups 1 and 2, the conventional groundwater management model of Jeju Island (basal-parabasal-high level, Jeju Province, 2002; Jeju Province and KOWACO, 2003) is a valid conceptual model for the management of groundwater resources. Basically, the groundwater management model of Jeju Island is based on the Ghyben-Herzberg model. Basal groundwater is conceptually defined as groundwater distributed on the fresh–saline water interface and is mainly distributed in the eastern part of Jeju Island and near coastal areas in western Jeju Island (Jeju Province and KOWACO, 2003). However, the temporal variation in discharge and EC at many springs is not concordant with the conventional management model of Jeju Province (i.e., groups 4 to 10 based on discharge rate; springs 4, 30, 31, 32, 49, 50, 55, 60, 68(1), 72, 88, 89, 94, 95, and 96 in Table 2 based on EC). Many of the springs in groups 3, 4, 5, 7, and 9 exhibit peak discharge rates in winter (December– February). The response of discharge from springs in groups 3, 4, 5, 7, and 9 to rainfall is very slow. If the temporal response is related to spatial hydraulic properties, the peak discharge rates in winter can be representative of relatively long flow pathways, rather than short and shallow pathways. This means that concerns about the groundwater system of Jeju Island, even near coastal areas, should be extended to a much wider area, requiring careful examination. To determine the extent of this area, we examined both the discharge rate and EC at specific springs (i.e., springs 4, 30, 31, 32, 49, 50, 55, 60, 68(1), 72, 88, 89, 94, 95, and 96). Jeju Province and KOWACO (2003) indicated that the temporal fluctuation in EC at each spring was inversely proportional to the discharge rate. However, we found that many springs (i.e., springs 4, 30, 31, 32, 49, 50, 55, 60, 68(1), 72, 88, 89, 94, 95, and 96; Fig. 13) near the coastline have features that are completely different from descriptions by Jeju Province and KOWACO (2003). The discharge rates and EC exhibit consistent behavior among these springs in winter (November–March; Fig. 13). For some springs (i.e., 89, 94, and 95), even in summer, discharge rates and EC show trends proportional to one another. These phenomena cannot be explained using the general Ghyben-Herzberg model, which considers the location and elevation of springs. All 121 springs except 94, 95, and 96 are located in areas with “basal groundwater” distributed on the interface between saline and fresh groundwater. Because most of these springs are very near the coastline, the consistency between the discharge rate and EC in winter may be a result of reverse flow into the spring induced by the tide. To remove the tidal effect, discharge rate and EC were always measured at the bottom of ebb tide. In addition, through 2 months of monitoring, we confirmed that these springs. 411. always flow out during floods and ebb tides. Accordingly, we conclude that the discharge water with high EC in winter originated partly from underground saline water. Nonetheless, there are some remaining problems that are related to the mechanism driving saline water to the ground surface. Some interesting phenomena related to this problem have been reported by Jeju Province (2002). Reductions in EC with increased depth were observed in wells at Jocheon (W-08), Taeheung (W-47), and Susan2 (W-33; Jeju Province, 2002). The reduction in EC at each of these wells indicates that seawater intrusion does not occur continuously in the vertical direction. In other words, the reduction in EC indicates that there should be two or more independent paths of fresh groundwater flow to the sea with weak vertical connections and there should be driving forces to prevent the dense saline water from flowing down through installed monitoring wells. It is inappropriate for the fresh or less saline groundwater located below the intruding seawater to be included in any classification (basal, parabasal, and basement groundwater; Jeju Province and KOWACO, 2003). It is almost impossible to explain the reduction in EC using data from the area containing basal groundwater. Therefore, studies should be extended to the mid-altitude areas. Some other interesting features involve the relationship between geology and hydraulic head distribution. This relationship can affect the behavior in EC at specific springs (i.e., 4, 30, 31, 32, 49, 50, 55, 60, 68(1),72, 88, 89, 94, 95, and 96) and the reduction in EC. The relationship between geology and hydraulic head distribution involves spatial distributions of tuff cones and hydraulic gradients (Figs. 3 and 4). Hydraulic gradients are very smooth and low near the coastline in basal groundwater areas, but become steep close to tuff cones (Fig. 4). In previous studies, the steepness of the hydraulic gradient was reported to be caused by the elevation of the Seoguipo formation. Although this explanation referencing the Seoguipo formation can serve as a conceptual model, this assumption is inappropriate, considering the high transmissivities on Jeju Island. Without considering any information on tuff cone distributions, it was mentioned that the steepness of the hydraulic gradient in mid-altitude areas is caused by the spatial differences in recharge rates (Jeju Province and KOWACO, 2003). Considering that hydraulic gradients at mid- or high-altitude areas are ten to one hundred times higher than those at low-altitude areas (< 200 m above mean sea level), the recharge rate at mid- or high-altitude areas is also ten or more times higher than that at low-altitude areas, even if it is assumed that Jeju Island has a conic topology. However, the referred relation between recharge rate and hydraulic gradient in mid- or high-altitude area should not be true because the annual amount of rainfall at mid- or high-altitude areas is only two or three times the amount at low-altitude areas and the topological steepness is also higher at.
(16) 412. Taehee Kim, Deok-Cheol Moon, Won-Bae Park, Ki-Hwa Park and Gi-Won Ko. Fig. 12. Seasonal fluctuations of discharge rate and EC at springs near to coastal line in Jeju Island. (solid line: discharge ton/day, dashed line: EC µS/cm); (a) spring number 4, (b) 30, (c) 31, (d) 32, (e) 49, (f) 50, (g) 55, (h) 60, (i) 68(1), (j) 72, (k) 88, (l) 89, (m) 94, (n) 95, (o) 96..
(17) Classification of springs (on Jeju Island) with clustering analysis. mid- or high-altitude areas. For this reason, an alternative conceptual model to the conventional management model holds that tuff formations have generally low hydraulic conductivity and may act as barriers to groundwater flow. Considering the mass balance of the water budget of Jeju Island, groundwater blocked by tuff formation should flow out through conduits. Certain observed phenomena such as the reduction in EC at Jocheon (W-08), Taeheung (W-47), and Susan2 (W-33) wells present the possibility of deep connections between mid-altitude areas and coastal areas. Thus, more precise studies are required to clarify the relationship among the responses at the surveyed springs, the hydraulic features of coastal areas, and the regional conceptual model of groundwater circulation for Jeju Island. 6. SUMMARY AND CONCLUSION We classified springs based on monthly measured time series of discharge rates and EC using cluster analysis. Using discharge rates, the surveyed springs were categorized into 10 groups; group 1 was subdivided into five subgroups, group 2 into two, group 3 into three, group 4 into three, group 5 into five, and group 9 into two. Springs in groups 1 and 2 exhibited peak discharge rates in late summer or early fall, whereas other springs in groups 4-1, 4-3, 5-2, 9-1, and 9-2 exhibited much later peaks in winter. Using EC, springs were also divided into 10 groups. Seawater effects were evident such as the intrusion of saline water and mixing of saline and fresh groundwater. The relationship between discharge rate and EC at springs near the intertidal zone was of interest. In contrast to a previous report (Jeju Province and KOWACO, 2003), some springs had positively correlated discharge rate and EC, especially in winter. These positive correlations were not caused by tides. Thus, it is necessary to evaluate appropriate conceptual models that are consistent with observed phenomena. For this purpose, we compared our results with various reported hydraulic features of Jeju Island (Jeju Province, 2002; Jeju Province and KOWACO, 2003). The conventional management model for the groundwater of Jeju Island was inappropriate for some hydraulic features. An alternative model to the conventional management model considers that tuff formations have generally low hydraulic conductivity and act as barriers to groundwater flow in mid-altitude areas. More precise studies are needed to clarify the relationship among the responses at the surveyed springs, the hydraulic features of coastal areas, and the regional conceptual model of groundwater circulation for Jeju Island. ACKNOWLEDGEMENTS: This study was supported by “Integrated analyses of groundwater occurrence in Jeju”.. 413. REFERENCES. Hildenbrand, A. Marlin, C. Conroy, A. Gillot, P.Y. Filly, A. and Massault, M. 2005, Isotopic approach of rainfall and groundwater circulation in the volcanic structure of Tahiti-Nui (French Polynesia). Journal of Hydrology, 302, 187, 208 Davis, G.H., Lee, Ch.K., Bradley, E. and Payne, B.R., 1970, Geohydrologic interpretations of a volcanic island from environmental isotopes. Water Resour. Res. 6, pp. 99−109. Jeju Province, 1999, Spring; Water in Jeju. Jeju Province, 2001, Comprehensive Investigation of Hydrogeology and Groundwater Resources for Jeju Island (I). Jeju Province. Jeju Province, 2002, Comprehensive Investigation of Hydrogeology and Groundwater Resources for Jeju Island (II). Jeju Province. Jeju Province and KOWACO, 2003, Comprehensive Investigation of Hydrogeology and Groundwater Resources in Jeju Island (III). Jeju Province. KIGAM, 2004, Annual Report on Establishment of Sustainable Groundwater Supply System in Jeju Island. Korea Institute of Geoscience and Mineral Resources. Kim, Y. Lee, K.S. Koh, D.C. Lee, D.H. Lee, S.G. Park, W.B. Koh, G.W. and Woo, N.C. 2003, Hydrogeochemical and isotopic evidence of groundwater salinization in a coastal aquifer: a case study in Jeju volcanic island, Korea. Journal of Hydrology, 270, 282−294. Koh, D.C. Chang, H.W. Lee, K.S. Ko, K.S. Kim, Y. and Park, W.B., 2005, Hydrogeochemistry and environmental isotopes of ground water in Jeju volcanic island, Korea: implications for nitrate contamination. Hydrological Process, 19, 2225−2245. Kovacs, A. Perrochet, P. Kiraly, L. and Jeannin, P.Y., 2005, A quantitative method for the characterisation of karst aquifers based on spring hydrograph analysis. Journal of Hydrology, 303, 152−164. Larocque, M., Mangin, A., Razack, M., and Banton, O., 1998, Contribution of correlation and spectral analyses to the regional study of a large karst aquifer (Charente, France). Journal of Hydrology vol. 205, 217−231 Laudon, H., H. F. Hemond, R. Krouse, and K. H. Bishop, 2002, Oxygen 18 fractionation during snowmelt: Implications for spring flood hydrograph separation. Water Resour. Res., 38(11), 1258, doi: 10.1029/2002WR001510. Lee, K.S. Wenner D.B. and Lee, I. 1999, Using H- and O-isotopic data for estimating the relative contributions of rainy and dry season precipitation to groundwater: example from Cheju Island, Korea. Journal of Hydrology, 222, 65−74. Maoszewski, P. and Zuber, A. 1982, Determining the turnover time of groundwater systems with the aid of environmental tracers 1. Models and their applicability. Journal of Hydology, 57, 207−231 StatSoft, Inc., 2006, Electronic Statistics Textbook. Tulsa, OK: StatSoft. WEB: http://www.statsoft.com/textbook/stathome.html. Winston, W.E., and R.E. Criss 2004, Dynamic hydrologic and geochemical response in a perennial karst spring. Water Resour. Res., 40, W05106, doi:10.1029/ 2004WR003054. Manuscript received February 6, 2006 Manuscript accepted December 10, 2007.
(18)
수치
+7


관련 문서
After first field tests, we expect electric passenger drones or eVTOL aircraft (short for electric vertical take-off and landing) to start providing commercial mobility
1 John Owen, Justification by Faith Alone, in The Works of John Owen, ed. John Bolt, trans. Scott Clark, "Do This and Live: Christ's Active Obedience as the
Szeles P., and Bacsi J., The Sapard Program in Hungary: Problems and Perspectives a Sapard Program Magyarorszagon, Journal of Central European Agriculture,
H, 2011, Development of Cascade Refrigeration System Using R744 and R404A : Analysis on Performance Characteristics, Journal of the Korean Society of Marine Engineering, Vol.
Characteristics of water quality at East China Sea in southwestern sea of Jeju Island in summer..
• 음식물 폐기물: collected by trucks food waste
• Controlled decomposition of organic materials such as plant materials, animal waste, food.. waste, and wastewater sludge
Construction New construction sites, road repair sites, demolition of buildings.
