* 레드원테놀러지([email protected])
** 순천대학교 정보통신공학부([email protected])
*** 조선대학교 제어계측로봇공학과([email protected])
**** KIOST([email protected])
***** KISTI([email protected])
****** 교신저자 : 전남대학교 전기·전자통신·컴퓨터공학부 ㆍ접 수 일 : 2016. 02. 26
ㆍ수정완료일 : 2016. 04. 13 ㆍ게재확정일 : 2016. 04. 24
ㆍReceived : Feb. 26, 2016, Revised : Apr. 13, 2016, Accepted : Apr. 24, 2016 ㆍCorresponding author : Young-Chul Bae
Division of Electrical · Electronics Communication and Computer Engineering, Chonnam National University
Email : [email protected]
수중 환경에서의 위상 지연을 이용한 음향 신호의 시간 차이 추정 기법
이영필*․문용선**․고낙용***․최현택****․이정구*****․배영철******
Estimation Technique of Time Difference of Acoustic Signal by phase delay in Underwater Environments
Young-Pil Lee
*․ Yong-Seon Moon
**․ Nak-Yong Ko
***․ Hyun-Taek Choi
****․ Jeong-Gu Lee
*****․ Young-Chul Bae
******요 약
최근에 UWAC에 대한 연구가 많은 연구자와 학자들에 의해 연구되고 있다. 수중 환경에서 두 신호 사이의 시간 차이 추정 기법은 배경이 없는 영역에서 도착 시간 추정, 상관관계 추정, 그리고 시간 지연 추정의 3가지가 제시되어 있다. 이 논문에서는 위상 지연에 기반하여 두 신호 사이에서의 시간 차이 추정 기법을 제시한다.
ABSTRACT
Recently, UWAC(: UnderWater Acoustic Communication) has been studied by many scholars and researchers. There are several method to estimate the time-difference between the two signals such estimating as the arrival time of the first non-background segment in both signals and calculate the temporal difference, calculating the cross-correlation between the two signal to infer the time-lagged, and estimating the phase delay to infer the time difference. In this paper, we present estimating method by the phase delay to infer the time difference in two signals.
키워드
Underwater Environments, Signal Processing, Time Difference, Acoustic Signal, Phase Delay 수중 환경, 신호 처리, 시간 차이, 음향 신호, 위상 공간, 위상 지연
Ⅰ. Introduction
In underwater environment, there is a pinger
periodically broadcast a signal with stable frequency.
Recently, UWAC(: UnderWater Acoustic
http://dx.doi.org/10.13067/JKIECS.2016.11.4.365
Communication) has been studied by many scholar s and researchers. DS-CDMA[1],[6],[12],[14-15], OFDM (: Orthogonal-Frequency Division Multiplexing) [1-3],[7], and MIMO (multi-input multi-output) [1],[4], modulation and error correction[5], and others [8-11],[13] techniques that can transmit high-speed data are used in UWAC.
There are several method to estimate the time-difference between the two signals such estimating as the arrival time of the first non-background segment in both signals and calculate the temporal difference, calculating the cross-correlation between the two signal to infer the time-lagged, and estimating the phase delay to infer the time difference.
In this paper, we present estimating method by the phase delay to infer the time difference in two signals.
Ⅱ. Data preprocessing
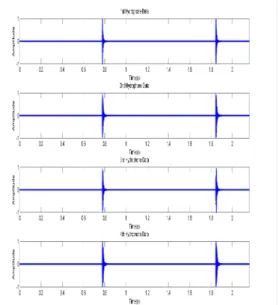
There is an array of
hydrophones which record the acoustic signal with sampling frequency
In the example showed in figure 1, there are two impulsive segments locating around 0.7755 and 1.8449 second in the data of the first hydrophone.
The problem is to estimate the time-difference between the two signals, three methods can be applied: (1) estimating the arrival time of the first non-background segment in both signals and calculate the temporal difference.
The input signal from each hydrophone is an integer array which valued in range
The purpose of preprocessing is to normalized the value range into (-1,1).
max
≤ ≤
≤ ≤ (1)
where
is a data sample and T is the total number of data sample.
Fig. 1 Data from four hydrophones
Ⅲ. Time difference estimation using phase delay
3.1 Preliminaries
We consider a source signal which is a sinusoid with unknown frequency
c like equation (1).
cos
(2)
Assume that there is two receivers which have
the sampling frequency
the real-valued signals
which received are equation (3).
cos
≈
(3)
The Discrete Fourier Transform (DFT) of equation (3) can be described by equation (4).
sin
sin
(4)
Where is the length of the sampled signals.
When
, we get equation (5) from equation (4).
≈
(5)
The Cross Power Spectrum of
and
at
is given by equation (6).
(6)
From equation (6), the phase delay between
and
is calculated by equation (7).
∠
arctan
(7)
where are correspondingly the real part and imaginary part of . Because
is unknown, we can estimate it as following equation (8).
argmax
argmax
(8)
Finally, the time difference between
and
is calculated by equation (9).
(9)
3.2 Algorithm
Algorithm for calculating sample cross-correlation function is following as:
Input: real-valued signal
,
, duration , sampling frequency
Output: time difference
between
and
. 1. Find
is the smallest power of 2 which
larger than or equal to ;
2. Compute the DFT
,
of
;
3. Estimate
using equation 8;
4. Calculate the phase delay
using equation 7;
5. Calculate the time different
using equation 9;
Ⅳ. Example and evaluation
4.1 Example
We take all of 1st and 2nd hydrophone data for
demonstration. The first step is to compute the
DFT of the two signals. The 1st and 2nd
hydrophone data and their corresponding
magnitude of the DFT is showed in figure 2 and
3.
Fig. 2 DFT of 1st hydrophone data
Fig. 3 DFT of 2nd hydrophone data
Then, we compute the square of magnitude of the DFT and find the frequency at maximum value of those peaks as shown in figure 4.
Fig. 4 Square of magnitude of DFT of 1st and 2nd hydrophone data
The frequency is
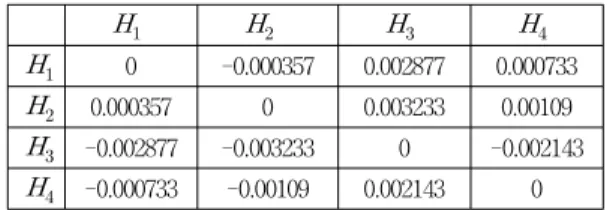
= 28774.17 Hertz, and the corresponding phase delay is 0.130122 radian. The time difference is estimated at 0.000001 second with estimation error is
=
second (the number -0.000357 comes from table 1).
4.2 Evaluation
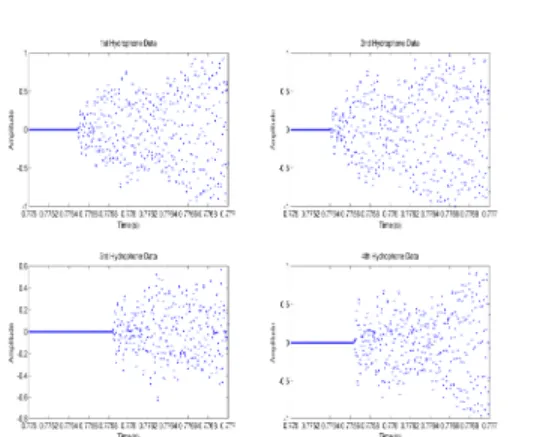
We experiment on the four hydrophones’ data as showed in figure 1. To make a reference, we plot out the original data at the first non-background segment from 0.775 to 0.777 second, as shown in figure 5.
0 -0.000357 0.002877 0.000733
0.000357 0 0.003233 0.00109
-0.002877 -0.003233 0 -0.002143
-0.000733 -0.00109 0.002143 0Table 1. Referenced time difference of four hydrophones’ data
where the data in row x and column y is the time difference between yth and xth hydrophone data. For example, in the second row, the data
the data corresponding to
respectively. The estimation error measured by mean absolute difference can be represented by equation (10)
(10)
where
is the number of Hydrophones (
),
is given in table 2 and
is the estimated time difference.
For example, with
, we can calculate
following equation (11).
(11)
Fig. 5 Start position of the first non-background segment
We implement algorithm using both Matlab and C programming language with using the FFTW library [16] (http://fftw.org) for FFT computation.
We get estimated Sinusoid Frequency and Phase Delay (in radian), they are represent at table 2 and 3, respectively.
28,702.64 28,774.27 28,768.16 28,664.30
28,774,16 28,845.69 28,838.68 28,735.83
28.767.16 28,838.68 28,831.67 28,728.82
28,664.30 28,735.83 28,728.82 28,625.97Table 2. Sinusoid Frequency estimated using phase
delay
0 0.130122 3.104033 0.927931
-0.130122 0 0.927931 0.799809
-3.104033 -0.927931 0 -2.176103
-0.927931 -0.799809 2.176103 0Table 3. Estimated phase delay
We acquire that the estimation error in mean absolute difference is
second.
Ⅴ. Conclusion
In this paper, we presented estimating method by the phase delay to infer the time difference in two signals.
Acknowledgments
“This research was a part of the project titled 'R&D center for underwater construction robotics', funded by the Ministry of Oceans and Fisheries(MOF) and Korea Institute of Marine Science &Technology Promotion(KIMST), Korea.”
Reference
[1] A. Ranjan and Ashish Ranjan,
“Underwater Wireless Communication Network,” Advance in Electronic and Electric Engineering, vol. 3, no. 1, 2013, pp. 41-46.
[2] P. J. Gendron, “Orthogonal frequency division multiplexing with on-off keying:
Noncoherent performance bounds, receiver design and experimental results,” U.S.
Navy J. of Underwater Acoustics, vol. 56, no. 2, 2006, pp. 267-300.
[3] M. Stojanovic, “Low complexity OFDM detector for underwater channels,” In Proc. Of MTS/IEEE OCEANS Conf., Boston, USA, Sept., 2006.
[4] B. Li, S. Zhou, M. Stojanovic, L. Freitag, and P. Willett, “Multicarrier communication over underwater acoustic channels with nonuniform Doppler shifts,”
IEEE J. of Oceanic Engineering, vol. 33, no.
2, Apr. 2008, pp. 198-209.
[5] Y. Labrador, Masoumeh Karimi, Deng
Pan, and Jerry Miller, “Modulation and
Error Correction in the Underwater
Acoustic Communication Channel,” Int. J.
of Computer Science and Network Security, vol. 9, no. 7, July 2009, pp. 123-130.
[6] H. Kang and W. Han, “Performance analysis of Variable Rate Multi-carrier CDMA under an underwater acoustic channel,” J. of Korean Institute of Intelligent Systems, vol. 7, no. 1, 2012. pp. 33-38.
[7] Y. Im and H. Kang, “Performance analysis of an adaptive OFDM over an underwater acoustic channel,” J. of Korean Institute of Intelligent Systems, vol. 5, no. 5, 2010, pp.
509-515.
[8] D. Lee and Y. Yang, “Two-Dimensional Localization Problem under non-Gaussian Noise in Underwater Acoustic Sensor Networks,” J. of the Korean Institute of Intelligent Systems, vol. 23, no. 5, 2013. pp.
418-422.
[9] S. Noh, N. Ko, and H. Choi,
“Implementation and Performance Comparison for an Underwater Robot Localization Methods Using Seabed Terrain Information,” J. of the Korean Institute of Intelligent Systems, vol. 25, no.
1, 2015, pp. 70-77.
[10] H. Son, J. Park, and Y. Joo, “Intelligent Range Decision Method for Figure of Merit of Sonar Equation,” J. of the Korean Institute of Intelligent Systems, vol. 23, no . 4, 2013, pp. 304-309.
[11] D. Shin, S. You Na, and J. Kim, “Fuzzy Distance Estimation for a Fish Robot,” Int.
J. of Fuzzy Logic and Intelligent Systems, vol. 5, no. 4, 2005, pp. 316-321.
[12] H. Kang and W. Han, “Performance analysis of Variable Rate Multi-carrier CDMA under an underwater acoustic,” J.
of the Korea Institute of Electronics Communications Sciences, vol. 7, no. 1, 2012, pp. 33-38.
[13] Y. Im, P. Lim, J. Lee, and C. Kim,
“Interface Effect Analysis between Undersea Fiber Optic Cable and Underwater Acoustic channel,” J. of the Korea Institute of Electronics Communications Sciences, vol. 10, no. 9, 2015, pp. 979-986.
[14] Y. Lee, Y. Moon, N. Ko, H. Choi, L.
Huang, and Y. Bae, “Measurement of DS-CDMA Propagation Distance in Underwater Acoustic Communication Considering Attenuation and Noise,” Int.
J. of Fuzzy Logic and Intelligent Systems, vol. 15, no. 1, 2015, pp. 25-26.
[15] Y. Lee, Y. Moon, N. Ko, H.Choi, L.
Huang, and Y. Bae, “DSSS-based Channel Access Technique DS-CDMA for Underwater Acoustic Transmission,” Int. J.
of Fuzzy Logic and Intelligent Systems, vol.
15, no. 1, 2015, pp. 53-59.
[16] Y. Im and H,Kang, “Performance analysis of an adaptive OFDM over an underwater acoustic channel,” J. of the Korea Institute of Electronics Communications Sciences, vol.
5, no. 6, 2010, pp. 509-515.
저자 소개
이영필(Young-Pil Lee)
2006년 2월 : 순천대학교 전자공 학과(공학사)
2008년 2월 : 순천대학교 전자공 학과(공학석사)
2008년 ~ 현재 : 레드원테크놀러지(주) 연구원
※ 관심분야 : 로봇 제어, 모터 제어, 산업통신망
문용선(Yong-Seon Moon)
1983년 2월 : 조선대학교 전자공 학과(공학사)
1989년 2월 : 조선대학교 대학원 전자공학과(공학박사)
1992년 ~ 현재 : 순천대학교 정보통신공학부교수
※ 주 관심분야 : 산업통신망 및 로봇, 실시간 모션
제어
고낙용(Nak-Yong Ko)
1985년 2월 : 서울대학교 제어계 측공학과(공학사)
1987년 2월 : 서울대학교대학원 제어계측공학과(공학석사) 1993년 2월 : 서울대학교 대학원 제어계측공학과(공학박사) 1997~1998, 2004~2005 미국 Carnegie Mellon Univ. Visiting research scientist
1992년~현재 조선대학교 제어계측로봇공학과 교수
※ 주 관심분야 : 지상로봇과 수중로봇의 자율주행
최현택(Hyun-Taek Choi)
1991년 : 한양대학교 전자공학과 (공학사)
1993년 : 한양대학교 대학원 전 자공학과(공학석사)
2000년 : 한양대학교 대학원 전자공학과(제어 및 로보 틱스)(공학박사)
1993년~1995년 : KT 연구개발S/W 연구소 전임연구원 2000년~2003년 : 하와이 주립대학교 기계공학과 Post-Doc.
2003년~현재 : 한국해양과학기술원, 선박해양플랜트 연구소 책임 연구원
※ 관심분야 : 수중로봇, 해양시스템, 강인제어
이정구(Jeong-Gu Lee)
1989년 충북대학교 전기공학과 졸업 1991년 충북대학교 대학원 전기 공학과 졸업(공학석사)
2008년 충북대학교 대학원 전기 공학과 졸업(공학박사)
1991년~2000년 산업기술정보원 책임연구원 2015년~한국과학기술정보연구원 책임연구원
※ 관심분야 : Display, Solar Cell, Information Communication, Information Analysis, Technology Commercialization etc.
배영철(Young-Chul Bae)