INTRODUCTION
The International Commission on Radiological Protection (ICRP) describes the skin as an essential organ for which radiation monitoring must be undertaken. Annual dose lim-its to skin are 50mSv for the general public and 500mSv for radiation workers. The estimation of skin dose is not simple topic. For the most of radionuclide contaminants of concern, the dose to skin consists of electron and photon. The
contri-butions to the skin dose of these types of radiation depend on their energy distributions and the attenuation of the con-tamination. Radiation measurement instruments such as sur-vey meters or personal dosimeters do not provide any useful information in the cases of accidents. It is therefore impera-tive to provide tolerable assessment of skin dose in case any worker accidentally gets exposed. Previous studies of skin dose were mostly performed using computational dosimetry codes such as VARSKIN code and Monte Carlo simulations, but there has been rarely performed using laboratory data (Amato and Italiano 2018; Dubeau et al. 2018). Exposure of hands and fingertips to relevant dose rates has been of great
Assessment of Occupational Exposure Dose to
Radiation Workers in Secondary Standard Dosimetry
Laboratory of Mongolia
Batbuyan Tseren1 and Juyoul Kim1,*
1Department of NPP Engineering, KEPCO International Nuclear Graduate School, 658-91 Haemaji-ro, Seosaeng-myeon, Ulju-gun, Ulsan 45014, Republic of Korea
Abstract - The most accurate calculation strategies available should be used for the estimation of radiation doses in the potential accident associated with radioactive sources in laboratories. The objective of this study was to estimate skin dose, eye dose and personal dose equivalent to radiation workers in the Secondary Standards Dosimetry Laboratory(SSDL) in Mongolia which nationwide provides calibration services for dosimetry instrument and ensures that radiation measurements are consistent with International System of Units(SI). Using a computer code for skin contamina-tion dosimetry, VARSKIN, in case of unexpected accidental exposure scenarios, we compared the results of computer code with the measurements of thermoluminescent dosimeter(TLD). Among the most frequently used radionuclides in the laboratory practices, 137Cs radiation source was
selected and analysis of data obtained from TLD was also described in this study. We studied a point and cylindrical source geometry assuming varying thicknesses of absorbing layers. The com-puter code was successfully used to calculate directional dose equivalent Hʹ(0.07) in terms of con-trol of skin dose and area monitoring, personal dose equivalent Hp(10) in terms of effective dose
and individual monitoring. Results indicated a good comparison between the calculation results and measurement data. The deviations between calculated and measured doses were found to be within the range of 2.6% for different time interval measurements. For the skin depth of 0.07mm, dose rates were 7~12 times higher than the depth of 3mm and 10mm for eye and equivalent dose, respectively.
Key words : SSDL, Radiation worker, Dose assessment, VARSKIN
─ 157 ─ Technical Paper
* Corresponding author: Juyoul Kim, Tel. +82-52-712-7306, Fax. +82-52-712-7375, E-mail. [email protected]
interest in the presence of high or moderate activities in uni-versity laboratories where operational radiation protection has not been usually optimized in terms of manipulation shields, tools and procedures. Radiation safety officers are therefore needed to estimate the potential exposure of given amounts of radionuclides and to assess skin doses from ab-normal exposures that may occur under emergency situations. The objective of this study is to estimate skin dose, eye dose and equivalent dose to the occupational worker of Secondary Standard Dosimetry Laboratory(SSDL) of Nuclear Energy Commission(NEC) in Mongolia. Calculation results of skin dose, eye dose and equivalent dose from the radiation source of 137Cs were compared with the dose limit of 500mSv per year whose limits were established from the ICRP.
MATERIALS AND METHODS
1. VARSKIN codeVARSKIN dosimetry code was developed to estimate the skin doses resulting from the spectrum of beta energies emit-ted from various radioactive contaminants, especially, skin dose at 0.07mm and dose at a depth of 10mm(Hamby et al. 2013; Hamby and Mangini 2018). Because VARSKIN code was based on the dose-point kernel method, the code need-ed the numerical integration of a point kernel over the entire source volume and dose averaging area of interest. While VARSKIN calculations were much faster than Monte Carlo simulations, their accuracy was sacrificed with the simplifi-cation of point kernel. The point kernel was generally given by Eq.(1). Gy Ḋβ(r)=
[
---]
sec J·g dis β MeV 1.6×10⁻¹⁰[
---]
·A[
---]
·Y[
---]
·E-- β[
---]
·Fβ(ξ) MeV·kg sec =---dis β g 4πr2·ρ[
---]
·X90[cm] cm3 (1) where A: activity(dis·sec-1)Y: beta yield per disintegration(β·dis-1) Ẽ: mean energy(MeV·β-1)
Fβ(ξ): scaled absorbed dose distribution
ξ: parameter for density scaled distance from the source point to the dose point
r: physical distance between the source point and the dose point
ρ: density(g·cm-3)
X90: ratio normalized to the distance
Five source geometries were available such as point, disk, cylinder, spherical and slab source. Source activity was as-sumed to be evenly distributed throughout the area or vol-ume of all source geometries. The point source geometry was simple to use in determining whether a regulatory limit was exceeded or not. The point source geometry did not account for electron self-shielding, so a three-dimensional source geometry was best for particulate contamination(Hamby and Mangini 2018). The point source model did not require any data describing the physical dimensions of the source and generally yielded the highest dose rate for a given activity of available source geometries. For electron dosimetry, a point source was automatically modeled as a cylindrical source with a thickness and a radius of 1 micron and a density of 0.001g·cm-3. In this study, the point source and cylindrical source geometry were selected(Hamby et al. 2013).
2. TLD measurements
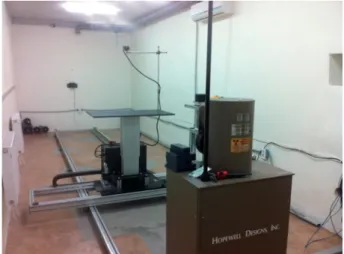
Irradiations of TLD were performed by 137Cs source with G10 gamma beam irradiator as shown in Fig. 1. The irradi-ator was used in SSDL where a source to detector distance (SDD) was 200cm. The beam profiles shown in Fig. 2 were measured by the Physikalisch-Technische Werkstätten(PTW) M32002 reference chamber. The energy response of PTW M32002 chamber could measure the energy within the range of 45keV to 1.3MeV. It achieved the measurement by a thin
layer of aluminum within its inner wall surface and provided increased photoelectric yield to compensate for absorption. With SDD of 200cm, the TLDs were irradiated in a water phantom of 30cm×30cm×15cm made by PTW as shown in Fig. 3. The irradiated TLDs available for this study were TLD-100 chips(Harshaw-4500) with dimensions of 3.2 mm ×3.2 mm×0.89 mm. The time intervals between irradiation and reading were 3 days(Budanec et al. 2008). For the use of VARSKIN code, the air gap was limited to a maximum of 20cm. In this study, air gap was selected as 20cm from the point source of maximum limit. TLDs were irradiated at 200cm from the radiation source of 137Cs. Using the inverse square law, the radiation dose at 20cm from a point source was calculated using Eq.(2).
Ḋ1X12=Ḋ2X22 (2)
where D and X are dose rate and distance to the point of
in-terest, respectively. From Eq.(2), radiation dose at 20cm was compared with that calculated by VARSKIN code.
RESULTS AND DISCUSSION
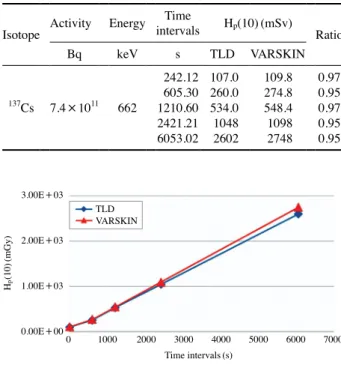
In this study, after the irradiation of TLD measurements were performed by Harshaw 4500 reader in Radiation Con-trol Laboratory(RCL) of General Agency for Specialized Investigation in Mongolia. The results showed that there were no appreciable differences between measured data and cal-culated doses by VARSKIN code. TLDs were used to verify the dose calculation model in different time intervals. Differ-ences between calculated and measured doses were found to be within 2.6% for different time intervals. These findings confirmed that the model adequately described the experi-ment. Table 1 shows results of personal dose equivalent of TLD measurements and dose calculations for the purpose of comparison(Bakali et al. 2001). Results between measur-ed and calculatmeasur-ed values using the VARSKIN code were in good agreement. The agreement in the case of personal dose equivalent was shown in Fig. 4.
Doses of VARSKIN were converted from mGy·h-1 to nGy·min-1. The dose rates were specific to the defined source strength, geometry, skin depth, source covering area
Relative response
(%)
-25 - 20 - 15 - 10 -5 0 5 10 15 20 25 Distance(cm)
Beam Profile of the Gamma calibrator Model G-10 at 100cm
Distance from Source, with standard Collimator and Chamber 32002 9 8 7 6 5 4 3 2 1 0
Fig. 2. Beam profile of G10 gamma beam irradiator.
Fig. 3. Irradiation of TLD.
Table 1. TLD measurements and personal dose equivalent Hp(10)
using VARSKIN Isotope Activity Energy
Time intervals Hp(10)(mSv) Ratio Bq keV s TLD VARSKIN 137Cs 7.4×10¹¹ 662 242.12 107.0 109.8 0.97 605.30 260.0 274.8 0.95 1210.60 534.0 548.4 0.97 2421.21 1048 1098 0.95 6053.02 2602 2748 0.95 0 1000 2000 3000 4000 5000 6000 7000 Time intervals(s) 3.00E+03 2.00E+03 1.00E+03 0.00E+00 TLD VARSKIN Hp (10) (mGy)
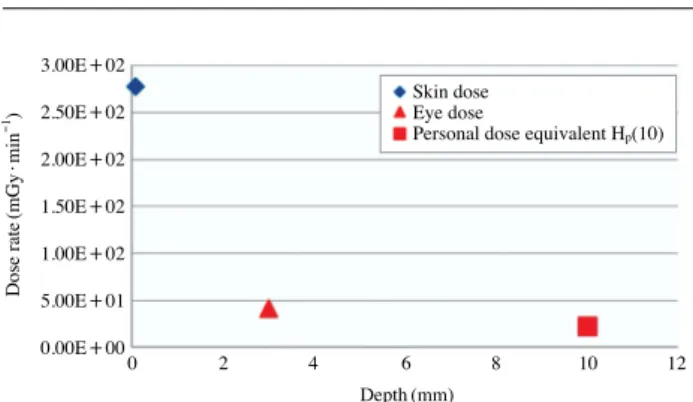
and radius. Fig. 5 shows a rapid increase in dose at the shal-lowest of depths due to increasing population of charged particles creating build up before electronic equilibrium is reached. Electronic equilibrium occurs at about 0.07mm, and then dose decreases with increase with depth. A depth interval of skin dose, eye dose and equivalent dose were con-sidered. Especially, at skin depth of 0.07mm, dose rate was 7~12 times higher than the depth of 3mm and 10mm. This high value could be explained as a result of dose contribu-tions from the electron on the surface of skin. Additionally, calculation results showed that the exact dose contributor to
the skin could be differentiated between photon and electron dose.
In this study, several comparison results were provided between one-dimensional point source and two-dimensional cylindrical source. A sensitivity analysis using geometry pa-rameters was available in VARSKIN code. Results showed that the most sensitive source dimension for calculating dose was source thickness. Also, the dose varied substantially for small differences in the value of the input parameters. All the related parameters were taken from the certificate of 137Cs cylindrical source with a thickness of 19.2mm, a radius of 8.7mm and a density of 8g·cm-3. In this calculation, point and cylindrical source geometry were selected and radiation doses were estimated at the depth of 10mm and the area of 1cm2 (Hamby et al. 2013). The comparison results are shown in Table 2. Fig. 6 shows a sensitivity analysis between point and cylindrical modeling geometry with 137Cs source and a good agreement was observed with the previous study.
CONCLUSION
VARSKIN code was a useful tool for estimating skin dose at 0.07mm, eye dose at 3mm and personal dose equivalent at a depth of 10mm. We compared the results of TLD mea-surements and VARSKIN calculations for a point geometry of 137Cs radiation source. We found good comparison results between TLD measurements and calculations using VAR-SKIN code for the case of one-dimensional source model in terms of personal dose equivalent Hp(10). The deviations be-tween calculated and measured doses were within the range of 2.6% for different time interval measurements. Calculation results showed that values of directional dose equivalent Hʹ (0.07) were 7~12 times higher than personal dose equivalent Hp(10) which was dose rate over area of 1cm2. Calculation results could give more precise results in a reasonable time and improve the accuracy of assessing skin doses in routine as well as accidental exposure. Even in cases of laboratory accidents, it was found that occupational radiation doses to laboratory workers by the unexpected exposures could be as-sessed using VARSKIN code.
ACKNOWLEDGMENT
This research was supported by the 2019 Reseach Fund of 3.00E+02 2.50E+02 2.00E+02 1.50E+02 1.00E+02 5.00E+01 0.00E+000 2 4 6 8 10 12 Depth(mm) Dose rate (mGy ·min -1) Skin dose Eye dose
Personal dose equivalent Hp(10)
Fig. 5. Dose rate as a function of depth from 137Cs source.
Table 2. Sensitivity analysis between point and cylindrical
geome-try for 137Cs source
Isotope Activity Energy
Time intervals VARSKIN geometry Point Cylinder Bq keV s mSv 137Cs 7.4×10¹¹ 662 242.12 109.8 100.6 605.30 274.8 250.8 1210.60 548.4 502.8 2421.21 1098.0 1005.6 6053.02 2748.0 2508.0 3.00E+03 2.40E+03 1.80E+03 1.20E+03 6.00E+02 0.00E+00 Dose (mSv) Time intervals(s) Point Cylinder
Fig. 6. Sensitivity analysis between point and cylindrical geometry
for 137Cs source.
the KEPCO International Nuclear Graduate School (KINGS), the Republic of Korea.
REFERENCES
Amato E and Italiano A. 2018. Evaluation of skin absorbed doses during manipulation of radioactive sources: a comparison between the VARSKIN code and Monte Carlo simulations.
J. Radiol. Prot. 38(1):262-272.
Bakali M, Fernandez F, Bouassoule T, Castelo J and Gonzalez A. 2001. Hot particle dosimetry at nuclear power plants.
Radiat. Meas. 34(1-6):487-490.
Budanec M, Knezevic Z, Bokulic T, Mrcela I, Vrtar M, Vekic B and Kusic Z. 2008. Comparison of doses calculated by the Monte Carlo method and measured by LiF TLD in the build-up region for a 60Co photon beam. Appl. Radiat. Isot. 66(12):
1925-1929.
Dubeau J, Witharana SSH, Sun J, Heinmiller BE and Chase WJ. 2018. A comparison of beta skin doses calculated with VARSKIN 5.35.3 and MCNP 5. Radiat. Prot. Dosimetry
182(4):502-507.
Hamby DM and Mangini CD. 2018. VARSKIN 6, A computer code for skin contamination dosimetry. NUREG/CR-6918, Rev. 3.
Hamby DM, Lodwick CJ, Palmer TS, Reese SR, Higley KA, Caffrey JA, Sherbini S, Saba M and Bush-Goddard SP. 2013. The new VARSKIN 4 photon skin dosimetry model. Radiat.
Prot. Dosimetry 154(3):356-363.
Received: 23 May 2019 Revised: 14 June 2019 Revision accepted: 18 June 2019