저작자표시-비영리-변경금지 2.0 대한민국 이용자는 아래의 조건을 따르는 경우에 한하여 자유롭게 l 이 저작물을 복제, 배포, 전송, 전시, 공연 및 방송할 수 있습니다. 다음과 같은 조건을 따라야 합니다: l 귀하는, 이 저작물의 재이용이나 배포의 경우, 이 저작물에 적용된 이용허락조건 을 명확하게 나타내어야 합니다. l 저작권자로부터 별도의 허가를 받으면 이러한 조건들은 적용되지 않습니다. 저작권법에 따른 이용자의 권리는 위의 내용에 의하여 영향을 받지 않습니다. 이것은 이용허락규약(Legal Code)을 이해하기 쉽게 요약한 것입니다. Disclaimer 저작자표시. 귀하는 원저작자를 표시하여야 합니다. 비영리. 귀하는 이 저작물을 영리 목적으로 이용할 수 없습니다. 변경금지. 귀하는 이 저작물을 개작, 변형 또는 가공할 수 없습니다.
A THESIS
FOR THE DEGREE OF MASTER OF SCIENCE
Evaluation of krill meal supplementation on growth,
feed utilization, intestinal morphology, innate
immunity and disease resistance of olive flounder
(Paralichthys olivaceus)
W M Kasun Tharaka Jayathilaka
Department of Marine Life Science GRADUATE SCHOOL JEJU NATIONAL UNIVERSITY
Evaluation of krill meal supplementation on growth,
feed utilization, intestinal morphology, innate
immunity and disease resistance of olive flounder
(Paralichthys olivaceus)
W M Kasun Tharaka Jayathilaka
(Supervised by Professor Kyeong-Jun Lee)
A thesis submitted in partial fulfillment of the requirement for the degree of MASTER OF SCIENCE
The thesis has been examined and approved by,
……….. Lee Seunghyung, Dr. of Aquafeed Research Center,
National Institute of Fisheries Science
……….. Park Sang-Rul, Prof. of Department of Marine Life Science,
Jeju National University
……….. Lee Kyeong-Jun, Prof. of Department of Marine Life Science,
Jeju National University 2020. 02.
Department of Marine Life Science GRADUATE SCHOOL JEJU NATIONAL UNIVERSITY
i
TABLE OF CONTENT
요약문 ………...iii ABSTRACT ………iv LIST OF TABLES ………..v LIST OF FIGURES………vi 1. INTRODUCTION ………..11.1 Replacement fish meal in aqua-feed…………..………....1
1.2 Krill meal……….………...2
1.3 Potential use of krill in aquaculture …………...………2
1.4 Olive flounder………3
2.
MATERIALS AND METHODS 2.1 Experimental diets………..………...42.2 Feeding trial and sample collection………...5
2.3 Determination of apparent digestibility coefficients…….………7
2.4 Analyses………..………...9
2.5 Morphology of body and intestine………....10
2.6 Expression levels of liver IGF-I mRNA………...11
2.7 Challenge test………....12
2.8 Statistical analysis……….…….13
ii 4. DISCUSSION………...………30 5. CONCLUSIONS………..36 6. REFERENCES………37 7. ACKNOWLEDGEMENT………..47
iii 한글 요약문 본 연구에서는 넙치(Paralichthys olivaceus) 저어분 사료 내 크릴의 첨가효과를 평가하였다. 대조사료는 총 2 가지로, 사료 내 어분의 함량이 56%인 HFM 와 28%인 저어분 대조구(LFM)로 조성되었다. 실험사료는 총 4 가지로, 크릴밀은 LFM 사료 내 어분을 각각 3, 6, 9, 12% (KM3, KM6, KM9, KM12) 대체하도록 설정되었다. 사육실험은 4 반복으로, 총 12 주간 진행되었다. 사육실험 결과, 사료 내 크릴의 첨가는 넙치의 성장과 사료효율을 증진시키는 것으로 나타났다. 넙치의 단백질과 건물 소화율은 크릴 3-9% 첨가구(KM3-9%)가 대조구에 비해 증가하는 것으로 나타났다. 헤모글로빈과 hematocrit 은 크릴 첨가구가 모두 증가한 것으로 나타났다. 비특이적 면역 지표인 anti-protease, lysozyme, GPx, SOD, Ig 의 활성은 KM3, 6, 9 실험구가 대조구에 비해 유의적으로 높았다. 실험어 장 내 goblet cell 의 수, 융모길이, 어체의 가식부비율 또한 모든 실험구(KM3-12)가 대조구에 비해 증가하는 것으로 나타났다. Edwardsiella tarda 병원체를 이용하여 25 일간 진행된 공격실험 결과, 누적폐사율은 LFM 구가 HFM 구와 크릴첨가구에 비해 높게 나타났다. 본 연구에서 저어분 사료 내 크릴의 첨가는 넙치의 성장, 사료효율, 소화율, 장의 발달과 기능, 비특이적 면역반응, 질병저항성을 향상시키는 것으로 나타났다. 결론적으로, 저어분 사료 내 크릴의 적정 첨가함량은 3-9%라고 판단된다.
iv
Abstract
The supplemental effect of krill meal into a low fish meal (FM) diet was evaluated for olive flounder (Paralichthys olivaceus). A 56% FM-based diet was regarded as a high FM inclusion diet (HFM) and a 28% FM inclusion was considered a low-FM diet (LFM). Four other diets were prepared by supplementing 3, 6, 9 and 12% krill meal into the LFM diet (designated as KM3, KM6, KM9 and KM12, respectively). Quadruplicate groups of fish were fed one of the diets for 12 weeks. The growth performance and feed utilization were improved by the dietary krill meal supplementation. Digestibility of dietary protein and dry matter was increased by the KM3-9 diets. Hematocrit and hemoglobin were increased by krill meal supplementation. The innate immunity assessed by antiprotease, lysozyme, GPx, SOD and Ig and the condition factor of fish were significantly increased by the KM3-9 diets. Moreover, goblet cell counts, villi length and fillet yield of fish were significantly improved by all the krill meal-containing diets (KM3-12). A 25-day long challenge test with the Edwardsiella tarda pathogen showed that the cumulative mortality was higher in fish fed the LFM diet than in fish fed either the HFM or krill meal-supplemented diets. The results indicate that dietary krill meal supplementation in a LFM diet can increase growth performance and feed utilization efficiency, diet digestibility, intestinal development and functions, innate immunity and disease resistance of olive flounder. The recommended level of krill meal inclusion seems to be between 6-9%, when FM feed inclusion is low.
v
LIST OF TABLES
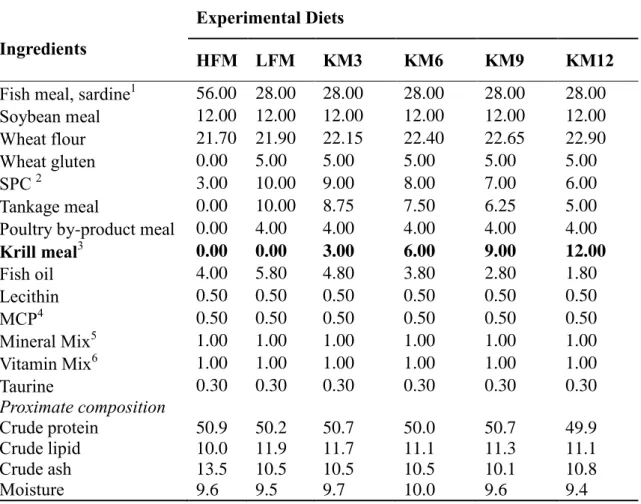
Table 1. Formulation and proximate composition of the experimental diets
for olive flounder. (%, dry matter basis).
16
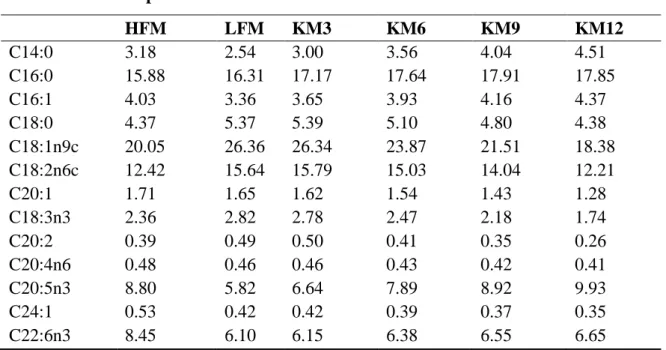
Table 2. Fatty acid composition (%) of the experimental diets for olive
flounder.
17
Table 3. Growth performance and feed utilization of olive flounder fed the
six experimental diets for 12 weeks.
18
Table 4. Apparent digestibility coefficients (%, ADC) for dry matter and
protein of the olive flounder fed the six experimental diets for 12 weeks.
20
Table 5. Hematological parameters of olive flounder fed the six
experimental diets for 12 weeks.
21
Table 6. The non-specific immune response of olive flounder fed the six
experimental diets for 12 weeks.
23
Table 7. Goblet cell counts, villi length and morphometric parameters of
olive flounder fed the six experimental diets for 12 weeks.
25
Table 8. Whole body proximate composition of olive flounder fed the six
experimental diets for 12 weeks.
vi
LIST OF FIGURES
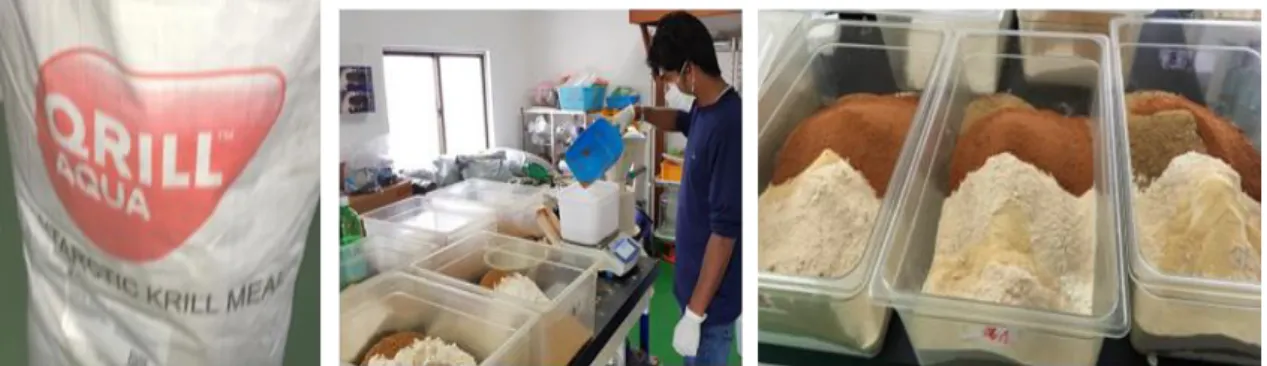
Figure 1. Preparation of six experimental diets. 4
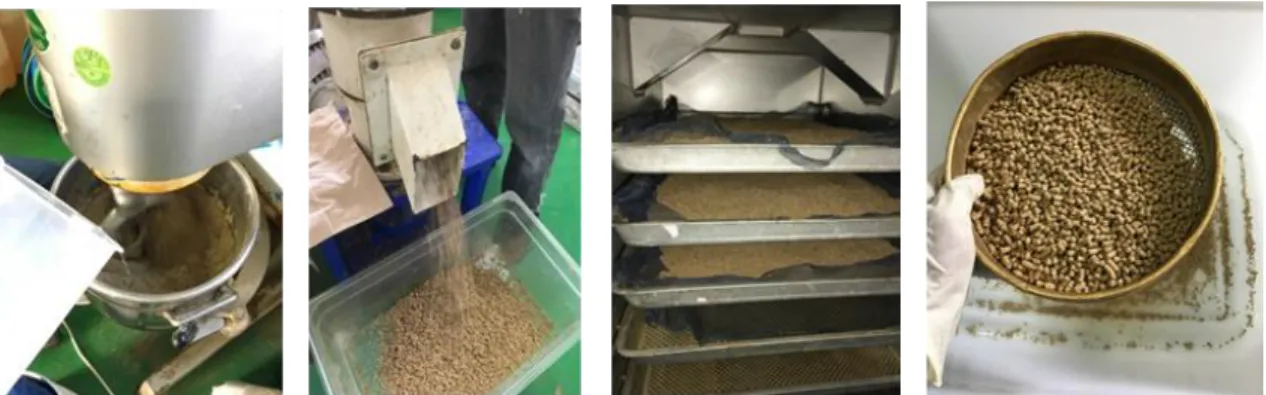
Figure 2. Mixing the ingredients of six experimental diets, pelleting and drying.
5
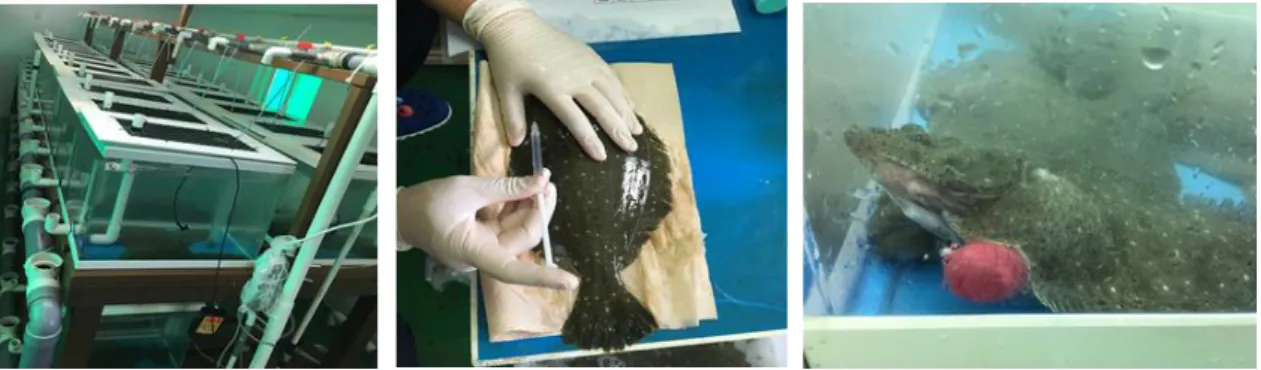
Figure 3. Diets and tank settings for the feeding trial. 6
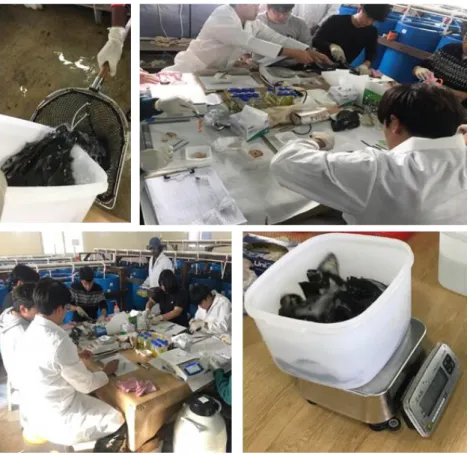
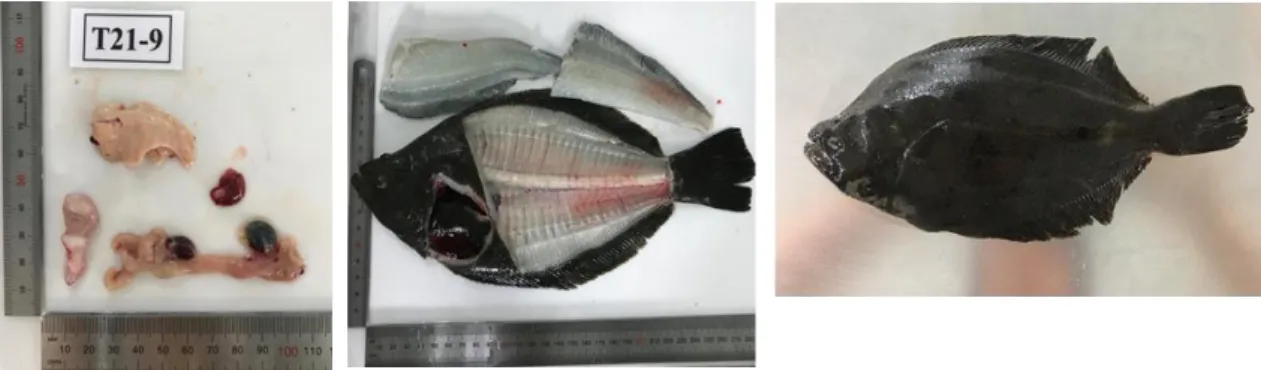
Figure 4. Weighing and sampling of fish at the end of feeding trial. 6
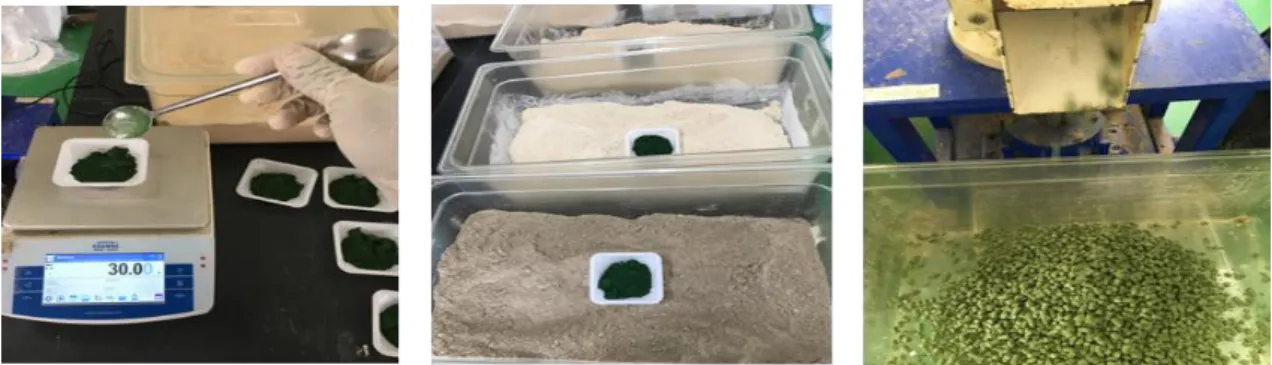
Figure 5. Preparation of digestibility test diets. 7
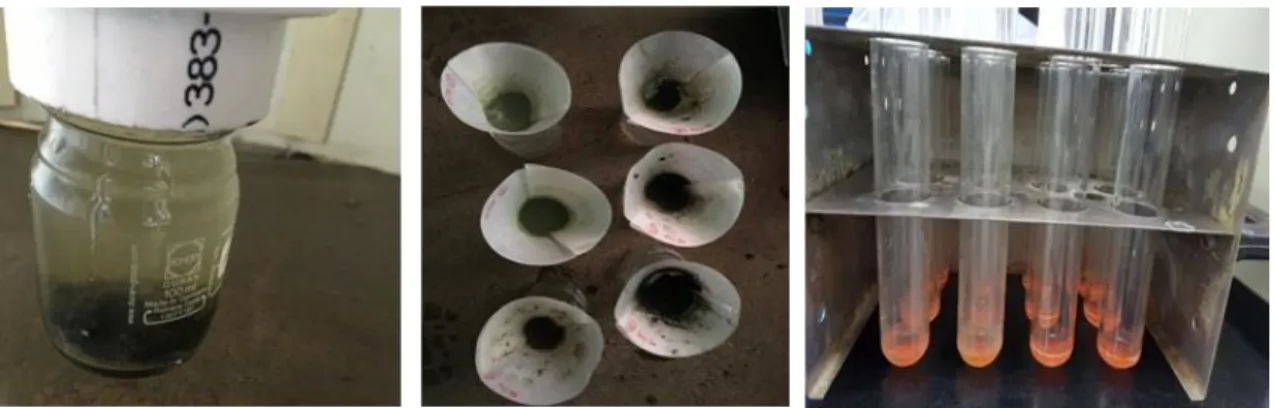
Figure 6. Fecal collection and chromic oxide analyzing. 8
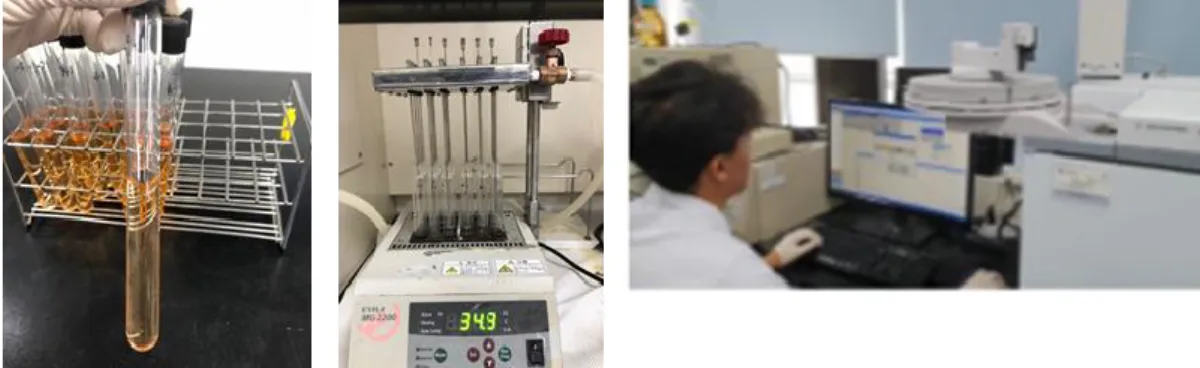
Figure 7. Fatty acid analysis of the diets and whole-body samples. 9
Figure 8. Observation for visual biometric traits of fish. 10
Figure 9. Preparation of slides for histological examination. 11
Figure 10. A tank system in quarantine room for challenge test. The fish
were showing the symptom of swollen and degutted intestine.
13
Figure 11. Growth performance and feed utilization of olive flounder fed
the six experimental diets for 12 weeks.
19
Figure 12. Apparent digestibility coefficients (%, ADC) for dry matter and
protein of the olive flounder fed the six experimental diets for 12 weeks.
vii
Figure 13. Hematological parameters of olive flounder fed the six
experimental diets for 12 weeks.
22
Figure 14. Non-specific immune response of olive flounder fed the six
experimental diets for 12 weeks.
24
Figure 15. Goblet cell counts, villi length and morphometric parameters of
olive flounder fed the six experimental diets for 12 weeks.
26
Figure 16. Visual appearance of internal organs of olive flounder fed the six
experimental diets for 12 weeks.
27
Figure 17. Macro-morphological characteristics of the olive flounder
intestine fed the six experimental diets for 12 weeks.
28
Figure 18. Macro-morphological characteristics of olive flounder liver fed
the six experimental diets for 12 weeks.
28
Figure 19. The survivals of olive flounder during the challenge test with
E.tarda (1×10⁵ CFU ml-1). The fish were fed six experimental diets for 12 weeks before the challenge test.
1
1. INTRODUCTION
1.1 Replacement of fish meal in aqua feed
In the feed production industry, fish meal (FM) has been the most limiting
ingredient due to its high demand and limited supply. In 2016, world total fish production reached 171 million tons and about 12% was used to produce FM and fish oil. Because of an increased demand of FM into aquaculture feeds, but a stagnating FM production, prices are predicted to increase (FAO, 2018). FM is still considered as an important ingredient in aqua-feed production (FAO, 2018) due to its high-quality protein with well-balanced essential amino acids and many other nutrients (Hertrampf and Piedad-Pascual, 2012). Over time, researchers have focused on finding suitable FM alternatives and found some successful plant protein sources that function up to some extent in feed formulations (Kaushik et al., 2004; Albrektsen et al., 2006; Espe et al., 2006; de Francesco et al., 2007; Brinker and Reiter, 2011; Kotzamanis et al.,2018; Rathore et al.,2018). On the other hand, most of plant-derived protein sources have nutritional limitations such as low protein and high fiber content, imbalanced amino acid profiles (Hardy, 2010) and a wide range of anti-nutritional factors (Francis et al., 2001) that negatively affect not only growth and health condition of fish, but also the palatability of the feeds.
1.2 Krill meal
Marine originated protein sources such as krill can be successfully supplemented in fish feeds, because they lack the unacceptable properties linked with plant proteins (Moren et al., 2006). Krill meal is mainly produced from captured raw Antarctic krill (Euphausia superba), which present nearly five hundred million tons of biomass in the Southern
2
Ocean. Inasmuch, it has a huge potential among a number of under-exploited marine resources at lower trophic levels (Olsen et al., 2006). Freshly captured krill is processed on board itself due to its rapid autolytic characteristic (Hertrampf and Piedad-Pascual, 2012). Based on the nutritional profile, krill has been specified with total protein and ash contents which are comparable to that of fish (Tou et al., 2007). And Hertrampf and Piedad-Pascual (2012) reported that krill’s amino acid profile is similar to the one of FM. Noteworthy are also the relatively high levels of EPA and DHA (Kohler et al., 2015), phospholipids, vitamins, nucleotides, trimethylamine N-oxide, chitin and natural astaxanthin of krill meal that stimulate the feeding behavior of fish, sometimes even better than FM (Everson, 2008).
1.3 Potential use of krill in aquaculture
Over the past years, several studies have been carried out to test the benefits of krill meal supplementation in diets for various fish species. Allahpichay and Shimizu (1984) observed stimulated feeding behaviors in red seabream (Pagrus major), Japanese eel (Anguilla japonica), black seabream (Mylio microcephalus) and yellowtail (Seriola
quinqueradiata), when krill meal was added to the diets. Moreover, Gaber (2005) reported a significant improvement in growth and feed intake of Nile tilapia (Oreochromis
niloticus) fed krill meal-supplemented diets. Partial or full replacement of FM with krill meal in diets for Atlantic salmon (Salmo salar) was possible without any adverse effects on growth performance, feed utilization and health parameters (Olsen et al., 2006).
Stimulated growths of Atlantic salmon and Atlantic halibut (Hippoglossus hippoglossus l.) were also observed when FM was partially replaced with krill meal (Suontama et al., 2007a). Hansen et al., (2011) reported that FM replacement with a mixture of partially deshelled krill meal and pea protein concentrates in diets for Atlantic salmon resulted in
3
significantly improved growth performance. Tibbetts et al. (2011) reported that moderate FM replacement (25 - 50%) with freeze-dried krill meal was able to obtain a significant improvement in feed intake and growth performance in Atlantic cod (Gadus morhua) and Atlantic halibut. in juvenile gilthead seabream (Sparus aurata), 9% krill meal inclusion in diets performed significantly better in growth and feed conversion ratio (Saleh et al., 2018). in addition, recent studies by our research group proved the beneficial effects of krill hydrolysates on growth performance, feed utilization and non-specific immune response of red seabream (Bui et al., 2014; Khosravi et al, 2015a; Khosravi et al, 2015b) and olive flounder (Paralichthys olivaceus) (Khosravi et al, 2014; Khosravi et al, 2015a).
1.4 Olive flounder
Olive flounder has been one of the most important flatfish species for marine
aquaculture in Asian countries. It is also the most important one in South Korean finfish production (Khosravi et al, 2014) and it accounts for approximately 50% of the total fish production. The objective of this study, therefore, was to examine the effects of different levels (3, 6, 9 and 12%) of krill meal inclusions in a low FM diet for olive flounder on growth performance, feed utilization, intestinal histology, digestibility, innate immunity, hematological parameters and disease resistance against Edwarsellia tarda, which is a serious bacterial pathogen in the flounder farms in South Korea.
4
2. MATERIALS AND METHODS
2.1 Experimental diets
Six experimental diets were formulated to be isonitrogenous (50% crude protein) and isocaloric (18 kJ g-1) (Table 1). A FM-based diet (56% FM) was regarded as a high FM diet (HFM) and a diet containing a mixture of soy protein concentrate, wheat gluten, tankage meal and poultry byproduct meal as substitutes for 50% FM was considered as a low-FM diet (LFM). Four other diets were formulated by supplementing 3, 6, 9 and 12% krill meal
(QrillTM Aqua; Aker BioMarine Antarctic AS, Norway) to the LFM diet (named as KM3,
KM6, KM9 and KM12, respectively). The experimental diets were prepared in the Institute of Marine Life Sciences, Jeju National University, South Korea. All dry ingredients were thoroughly mixed and after addition of fish oil, soybean oil and double-distilled water, the dough was extruded through a pellet machine (SP-50, Gum Gang Engineering, Daegu, Korea) in proper size, dried with electric drier (SI-2400, Shinil General Dryer Co., Ltd, Daegu,
Korea) at 25⁰C and then stored at -20⁰C until use (Figure 1 and 2). The proximate analysis and fatty acids composition of the different experimental diets are listed in Table 1 and 2, respectively.
5
Figure 2. Mixing the ingredients of six experimental diets, pelleting and drying
2.2 Feeding trial and sample collection
Olive flounder (approximately 40g size) were purchased from an olive flounder farm and transported to the Institute of Marine Life Sciences, Jeju National University, Jeju, South Korea. All fish were acclimatized to experimental conditions and facilities for two weeks while feeding a commercial diet. A total of 792 fish (initial mean body weight, 61.89±0.33g) were randomly distributed into 24 polyvinyl 300L circular tanks (33 fish per tank) with four replicates per diet (Figure 3). The tanks were supplied with filtered
seawater at a flow rate of 10 L min-1 and aerated with air-stones to maintain sufficient
dissolved oxygen. Fish were fed the experimental diets with apparent satiation (3 - 5% of body weight) twice a day (08:30h and 18:00h) for 12 weeks. Growth was checked at 3-week intervals. Feeding was stopped 18 hours prior to weighing to minimize handling stress. The uneaten feed was collected 20 min after feeding and reweighed to determine precise feed intake.
At the end of the 12 weeks of the feeding trial, all the fish were bulk weighed. Four fish from each tank were randomly selected, anesthetized with 2-Phenoxy ethanol solution (200 ppm) and blood was collected from caudal vein with heparinized syringes for
6
centrifugation at 5000×g for 10 min and stored at -70 0C until analysis of total
immunoglobulin (Ig), anti-protease activity and biochemical parameters. Another set of blood samples was taken from the caudal vein of four fish from each tank using non-heparinized syringes and clotting was allowed at room temperature for 30 min. The serum was separated by centrifugation for 10 min at 5000×g and stored at -70 °C for analysis of innate immunity parameters.
Figure 3. Diets and tank settings for the feeding trial.
7
2.3 Determination of apparent digestibility coefficients
For estimation of the apparent digestibility coefficient (ADC) of the experimental diets, chromic oxide (Cr2O3) (Sigma-Aldrich, St. Louis, USA) was included in the diets as an inert indicator at a concentration of 1%. All dry ingredients were thoroughly mixed and extruded through a pelletizer machine (SP-50, Gum Gang Engineering, Daegu, Korea) to proper size following the same procedure used in the experimental diet preparation. The pellets were dried with electric drier (SI-2400, Shinil General Dryer Co., Ltd, Daegu, Korea) at 25°C and kept in a freezer at -20 °C until used (Figure 5).
Figure 5. Preparation of digestibility test diets.
New sets of olive flounder (initial body weight, 100g) were distributed into 300 L capacity Guelph system (fecal collection system) tanks at a density of 75 fish per tank. The tank system (6 tanks) was supplied with cartridge-filtered seawater at a flow rate of 3 L
min-1 and aeration to maintain enough dissolved oxygen. Fish were hand-fed one of the
digestibility test diets to apparent satiation once daily at 18:00h. One hour after feeding, the tanks were brushed out to remove uneaten feeds and fecal residues. On the next morning, feces were collected from the fecal collection columns at 9:00h. A secondary fecal collection tube, under the collection tank, was additionally installed to collect all the possible feces. The collected feces in the tube were separated from supernatant water using
8
a paper filter and stored at -40 °C. Then, the fecal samples were freeze-dried for 24 h and stored at -20 °C until analyzed.
Figure 6. Fecal collection and chromic oxide analyzing.
Chromium oxide content of the experimental diets and collected feces samples were analyzed by the method described by Divakaran et al. (2002). Briefly, a known weight (5-10 mg) of ash samples of either diet or feces containing chromium oxide was placed in glass test tubes. Then, 4 ml of perchloric reagent was added along the sides of the test tube to wash down any adhering ash. Perchloric reagent was prepared as follows: two hundred milliliters of concentrated nitric acid was added to 100 ml of distilled water, cooled down and then 200 ml perchloric acid (70%) was added. The test tubes were set in a heating block and heated at 300 °C for 20 min, for oxidation of chromium oxide to
monochromate (CrO42-). Then the tubes were cooled down to room temperature and their
contents were quantitatively transferred and made up to 25 ml in a volumetric flask by rinsing repeatedly with distilled water. The absorbance of samples was read at 350 nm using a spectrophotometer (Beckman DU-730, USA). A known weight (2 – 4 mg) of chromium oxide was similarly treated and used as the standard (Figure 6).
The apparent digestibility coefficients for dry matter and protein of the
experimental diets were calculated by the following formula: ADC of dry matter (%) =
9
diet). ADC of protein (%) = 100 - 100 × (%Cr2O3 in diet / %Cr2O3 in feces) × (%protein in
feces /%protein in diet)
2.4 Analyses
Analyses of moisture and ash contents were performed by standard procedures (AOAC, 1995). Crude protein was measured by using automatic Kjeltec Analyzer Unit 2300 (FOSS, Sweden) and crude lipid using the method described by Folch et al., (1957). Fatty acid methyl esters (FAMEs) of the diets and whole-body samples were prepared using acid-catalyzed transesterification method (Metcalfe et al., 1961). FAMEs were analyzed by gas chromatography (GC, HP 6890, Agilent, Wilmington, Del., USA) using an HP-88 column (100 m x 250 μm x 0.25 μm: Agilent). The GC conditions were as follows: Injector and detector temperature was 260 °C: carrier gas, H2; and split ratio, 1/50 The programmed temperature was as follows: 140 °C for 5 min, increase of 4 °C min 1 to 240 °C; 240 °C for 10 min. Peaks were identified by comparison of retention times with those of corresponding FAMEmix-37 (Supelco, Bellefonte, PA, USA). Fatty acid concentrations were expressed as percentage (w / w) of total FAMEs (Figure 7).
Figure 7. Fatty acid analysis of the diets and whole-body samples.
Hematocrit was determined by microhematocrit technique (Brown, 1980). Hemoglobin and plasma levels of, total protein and cholesterol were determined by an
10
automated blood analyzer (SLIM, SEAC Inc, Florence, Italy). Expression level of liver IGF-I mRNA was determined according to Kim et al., (2017).
The oxidative radical production by phagocytes during respiratory burst was measured by an NBT assay described by Anderson and Siwicki (1995). Total immunoglobulin (Ig) levels were determined according to the method described by Siwicki and Anderson (1993). A turbidometric assay was used for determination of serum lysozyme levels through the method described by Hultmark (1980) with slight modifications. Serum myeloperoxidase (MPO) activity was measured according to Quade and Roth (1997). Serum superoxide dismutase (SOD) activity was measured by the percentage reaction inhibition rate of the enzyme with WST-1 (Water Soluble Tetrazolium dye) substrate and xanthine oxidase using a SOD Assay Kit (Sigma, 19160). The plasma anti-protease activity was measured according to the method described by Ellis (1990) with slight modifications (Magnadóttir et al., 1999). Glutathione peroxidase (GPx) and catalase activities were assayed using kits (Biovision, Inc. California, USA).
2.5 Morphology of body and intestine
Five fish per tank were randomly collected and the whole intestine was removed and sampled for histology examination. Body weights, fillet weights, liver and viscera weights, as well as fish lengths were measured and recorded for calculations of fillet yield, condition factor (CF), hepatosomatic index (HSI) and vicerasomatic index (VSI) (Figure 8).
11
Figure 8. Observation for visual biometric traits of fish.
The intestine samples were fixed in Bouins solution, dehydrated in graded series of ethanol, embedded in paraffin and then sectioned in 5µm sagittal serial sections. Slides were stained with Harris hematoxylin and 0.5% eosin for general histological observation and the Alcian blue (AB) at pH 2.5 and periodic acid Schiff (PAS) for observation of the mucus-secreting goblet cells (GC). The morphometric measurements of villus length (VL) and enterocyte height (EH) were made using the ImageJ 1.44 analysis software (Figure 9).
Figure 9. Preparation of slides for histological examination.
2.6 Expression levels of liver IGF-I mRNA
Liver total RNA was isolated using Trizol reagent (Sigma. T9424) and treated with RNase-free DNase (Omega Bio-Tek), following the manufacturer´s protocol. The quantity of the RNA was calculated using the absorbance at 260 nm. The integrity and relative quantity of RNA was checked by electrophoresis. PrimeScript RT reagent Kit with gDNA Eraser (Perfect Real Time) (TaKaRa Code. DRR047) was used to remove genomic DNA
12
and reverse transcription. One microgram of total RNA was reverse-transcribed into cDNA in a volume of 10 µL, containing 1 µL of gDNA Eraser and 2 µL of 5× gDNA Eraser Buffer. This mix was heated at 42 ºC for 2 min. and then 4 µL of 5 ×PrimeScript Buffer (for Real Time), 1 µL of PrimeScript RT Enzyme Mix I, 1 µL of RT Primer Mix and 4 µL of RNase-free dH2O were added to a final volume of 20 µL. After incubation at 37 ºC for 30 min, the reaction was stopped by heating to 85 ºC for 5 s.
Levels of IGF-I transcript were measured by real-time PCR (SYBR Green I), using 18S rRNA as a housekeeping gene. Primers for real-time PCR were designed based on the previously cloned sequence for IGF-I (NCBI Genbank accession no: AF061278) and 18S rRNA (NCBI Genbank accession no: EF126037). Real-time RT-PCR was conducted by amplifying 2.0 µL of cDNA with TaKaRa SYBR Premix Ex Taq (Perfect Real Time) (TaKaRa Code.DRR041A) on a TaKaRa PCR Thermal Cycler Dice Real Time System (TaKaRa Code.TP800). Amplification conditions were as follows: 30 s at 95 ºC; 40 cycles of 5 s at 95 ºC, 30 s at 60 ºC. Melting curve analysis of amplification products was
performed at the end of each PCR to confirm that a single PCR product was detected. Each sample was run in triplicate, and PCRs without the addition of the template were used as negative controls. Relative expression ratio of IGF-I was calculated based on the PCR efficiency (E) and the Ct of a sample versus the control (FM treatment) and expressed in comparison with the reference gene (18S rRNA), according to Pfaffl's mathematical model (Pfaffl, 2001).
Ratio = [(EIGF-I)ΔCt(control-sample)]/[(Eactin)Ct(control-sample)]
2.7 Challenge test
At the end of the feeding trial, twelve fish from each tank (48 fish per treatment) were intraperitoneally injected with E. tarda (ATCC 15947, Korea Collection for Type
13
and Aquatic Organism Disease Control Laboratory at the Department of Aquatic
Biomedical Sciences, Jeju National University, South Korea. Injected fish were distributed into twenty-four 120 L acryl tanks and their behavior and mortality were monitored and recorded every 2 hours for 25 days (Figure 10).
Figure 10. A tank system in quarantine room for challenge test. The fish were
showing the symptom of swollen and degutted intestine.
2.8 Statistical analysis
All data were tested for normality and homogeneity of variances. Means and standard deviations were calculated for each parameter measured. Differences among dietary treatments were established by one-way ANOVA. When p values were significant (p < 0.05), individual means were compared using Tukey’s HSD test. Data are presented as mean ± SD. Percentage data were arcsine transformed before analysis. Analyses were performed using the SPSS Statistical Software System v19.0 (SPSS; SPSS Inc, Chicago, IL USA).
14
3. RESULTS
Growth performance, feed utilization, relative expression levels of liver IGF-1 mRNA and survival of fish fed the experimental diets are shown in Table 3 and Figure 11. Final body weight and weight gain of fish fed KM6 were significantly higher than those of fish fed the LFM and HFM diets. Feed intake (FI), feed conversion ratio (FCR), and specific growth rate (SGR) of KM3, KM6, and KM9 groups were significantly improved compared to the LFM group. FI and SGR of the KM12 group were lower compared to the other krill meal groups. Significantly higher protein efficiency ratio (PER) values were observed in the KM6 and KM9 groups compared to the LFM group. Overall, there is a positive tendency of improved performance in growth and feed utilization in the KM3, KM6, and KM9 groups when compare to the HFM group, even though there were no significant differences between the groups. The relative expression level of liver IGF-1 mRNA and survival of fish were not affected by the dietary treatments.
In the apparent digestibility coefficients (Table 4 and Figure 12), KM3, KM9 and KM12 diets showed significantly higher dry matter digestibility than LFM diet. The ADC of protein of the krill meal supplemented diets groups were significantly higher compared to the LFM diet.
Hematocrit and hemoglobin were increased by krill meal supplementation. The plasma triglyceride level of the KM6 group was significantly higher when compared to the LFM group. There were no significant differences in plasma cholesterol, total protein, AST and ALT levels among all the dietary groups (Table 5 and Figure 13).
Non-specific immune responses of fish are provided in Table 6 and Figure 14. Anti-protease and lysozyme activities of KM3, KM6 and KM9 groups were significantly increased compared to the LFM group. In the case of GPx activity, the KM3 group showed the highest
15
value, which was significantly higher than the LFM group. SOD activity of KM6 and KM9 groups were significantly improved compared to the LFM group. Ig levels of fish fed KM6 diet were significantly higher than of fish fed the LFM diet. Histological and morphometric parameters of fish are provided in Table 7 and Figure 15. GC and VL were significantly increased in all the krill meal groups compared to the LFM group. CF of KM3, KM6 and KM9 groups and hepatosomatic index (HSI) of KM6 group were significantly higher than LFM group. Significantly higher fillet weight was found in fish fed the krill supplemented diets when compared to fish fed the LFM diet. Enterocyte height (EH) and viscerosomatic index (VSI) values showed no significant differences among dietary treatments.
Whole-body proximate compositions were not significantly affected by the
supplementation of krill meal (Table 8). No visual morphological abnormalities were found in terms of organ adhesion, melanin in viscera and organs, and liver and heart appearances (Figure 16). Histological characteristics of olive flounder intestine and liver were shown in Figure 17 and Figure 18, respectively. There were no significant histological changes in all the diet groups.
In the challenge test, the first mortality was observed in the LFM group on day 4 after the injection challenge of E. tarda. Cumulative mortalities were not significantly different among the diet groups. However, mortality was higher in the fish fed the LFM diet than in the fish fed the other diets during the 25 days of the challenge test. The highest survival against E. tarda pathogen was found in the fish fed KM9 (Fig. 19).
16
Table 1. Formulation and proximate composition of the experimental diets for olive flounder.
(%, dry matter basis)
1
Orizin S.A, Chile. 2
Soyprotein concentrate, Flavor corporation of Korea, South Korea. 3
Aker Bio Marine, Norway. 4
Mono-calcium phosphate. 5
Mineral premix (g kg-1 of mixture): MgSO4.7H2O, 80.0; NaH2PO4.2H2O, 370.0; KC 130.0;
Ferric citrate, 40.0; ZnSO4.7H2O, 20.0; Ca-lactate, 356.5; CuCl, 0.2; AlCl3. 6H2O, 0.15; Na2Se2O3, 0.01; MnSO4.H2O, 2.0; CoCl2.6H2O, 1.0.
6
Vitamin premix (g kg-1 of mixture): L-ascorbic acid, 121.2; DL- tocopheryl acetate, 18.8;
thiamin hydrochloride, 2.7; riboflavin, 9.1; pyridoxine hydrochloride, 1.8; niacin, 36.4; Ca-D-pantothenate, 12.7; myo-inositol, 181.8; D-biotin, 0.27; folic acid, 0.68; p-aminobezoic acid, 18.2; menadione, 1.8; retinyl acetate, 0.73; cholecalficerol, 0.003; cyanocobalamin, 0.003.
Ingredients
Experimental Diets
HFM LFM KM3 KM6 KM9 KM12
Fish meal, sardine1 56.00 28.00 28.00 28.00 28.00 28.00
Soybean meal 12.00 12.00 12.00 12.00 12.00 12.00
Wheat flour 21.70 21.90 22.15 22.40 22.65 22.90
Wheat gluten 0.00 5.00 5.00 5.00 5.00 5.00
SPC 2 3.00 10.00 9.00 8.00 7.00 6.00
Tankage meal 0.00 10.00 8.75 7.50 6.25 5.00
Poultry by-product meal 0.00 4.00 4.00 4.00 4.00 4.00
Krill meal3 0.00 0.00 3.00 6.00 9.00 12.00 Fish oil 4.00 5.80 4.80 3.80 2.80 1.80 Lecithin 0.50 0.50 0.50 0.50 0.50 0.50 MCP4 0.50 0.50 0.50 0.50 0.50 0.50 Mineral Mix5 1.00 1.00 1.00 1.00 1.00 1.00 Vitamin Mix6 1.00 1.00 1.00 1.00 1.00 1.00 Taurine 0.30 0.30 0.30 0.30 0.30 0.30 Proximate composition Crude protein 50.9 50.2 50.7 50.0 50.7 49.9 Crude lipid 10.0 11.9 11.7 11.1 11.3 11.1 Crude ash 13.5 10.5 10.5 10.5 10.1 10.8 Moisture 9.6 9.5 9.7 10.0 9.6 9.4
17
Table 2. Fatty acid composition (%) of the experimental diets for olive flounder.
HFM, high fish meal; LFM, low fish meal; KM3, krill meal 3%; KM6, krill meal 6%; KM9, krill meal 9%; and KM12, krill meal 12%.
Experimental Diets HFM LFM KM3 KM6 KM9 KM12 C14:0 3.18 2.54 3.00 3.56 4.04 4.51 C16:0 15.88 16.31 17.17 17.64 17.91 17.85 C16:1 4.03 3.36 3.65 3.93 4.16 4.37 C18:0 4.37 5.37 5.39 5.10 4.80 4.38 C18:1n9c 20.05 26.36 26.34 23.87 21.51 18.38 C18:2n6c 12.42 15.64 15.79 15.03 14.04 12.21 C20:1 1.71 1.65 1.62 1.54 1.43 1.28 C18:3n3 2.36 2.82 2.78 2.47 2.18 1.74 C20:2 0.39 0.49 0.50 0.41 0.35 0.26 C20:4n6 0.48 0.46 0.46 0.43 0.42 0.41 C20:5n3 8.80 5.82 6.64 7.89 8.92 9.93 C24:1 0.53 0.42 0.42 0.39 0.37 0.35 C22:6n3 8.45 6.10 6.15 6.38 6.55 6.65
18
Table 3. Growth performance and feed utilization of olive flounder fed the six experimental diets for 12 weeks.
Diets IBW1 (g) FBW2 (g) WG3 (%) FI4 FCR5 SGR6 PER7 IGF-I8 Survival (%)
HFM 62.02±0.38 237±6bc 283±11bc 284±10a 1.53±0.05ab 1.60±0.03ab 1.29±0.04ab 1.00±0.00 85.61±7.97 LFM 62.02±0.43 209±6d 237±10d 252±10b 1.67±0.06a 1.45±0.04c 1.19±0.04b 0.88±0.09 88.64±6.25 KM3 62.02±1.17 246±7ab 296±8ab 294±7a 1.49±0.04b 1.64±0.02a 1.33±0.03ab 1.05±0.53 81.82±6.06 KM6 62.02±0.38 254±8a 308±15a 286±8a 1.41±0.04b 1.67±0.04a 1.42±0.04a 1.20±0.66 87.88±6.55 KM9 62.02±0.37 247±4ab 301±6ab 284±3a 1.46±0.05b 1.65±0.02a 1.36±0.05a 1.08±0.33 87.88±5.53 KM12 62.02±0.31 227±7c 270±13c 263±5b 1.51±0.14ab 1.56±0.04b 1.33±0.12ab 0.78±0.19 87.88±8.92
Values are mean of quadruplicate groups and presented as mean ± S.D. Values with different superscripts in the same column are significantly different (P < 0.05). The lack of superscript letter indicates no significant differences among treatments. HFM, high fish meal; LFM, low fish meal; KM3, krill meal 3%; KM6, krill meal 6%; KM9, krill meal 9%; and KM12, krill meal 12%.
1Initial body weight
2Final body weight
3Weight gain = [(final body weight - initial body weight)/ initial body weight] x 100
4Feed intake (g/fish) = dry feed consumed (g)/fish
5
Feed conversion ratio = dry feed fed/wet weight gain 6
Specific growth rate (%) = [(ln final body weight − ln initial body weight) / days] × 100. 7
Protein efficiency ratio = fish weight gain (g)/protein 8
19
Figure 11. Growth performance and feed utilization of olive flounder fed the six
20
Table 4. Apparent digestibility coefficients (%, ADC) for dry matter and protein of the olive
flounder fed the six experimental diets for 12 weeks.
Diets ADCd (%)1 ADCp (%)2
HFM 56.55±6.55a 90.37±1.45b LFM 48.13±0.68b 86.62±0.18c KM3 61.07±2.39a 92.13±0.48a KM6 54.18±3.04ab 89.61±0.69b KM9 60.30±2.96a 90.39±0.72b KM12 55.19±4.41a 88.83±1.10b
Values are mean of four replicate groups and presented as mean ± S.D. Values with different superscripts in the same column are significantly different (P < 0.05). HFM, high fish meal; LFM, low fish meal; KM3, krill meal 3%; KM6, krill meal 6%; KM9, krill meal 9%; and
KM12, krill meal 12%.
1
Apparent digestibility coefficient of dry matter 2
Apparent digestibility coefficient of protein
Figure 12. Apparent digestibility coefficients (%, ADC) for dry matter and protein of the
21
Table 5. Hematological parameters of olive flounder fed the six experimental diets for 12 weeks.
Values are mean of quadruplicate groups and presented as mean ± S.D. Values with different superscripts in the same column are significantly different (P < 0.05). The lack of superscript letter indicates no significant differences among treatments. HFM, high fish meal; LFM, low fish meal; KM3, krill meal 3%; KM6, krill meal 6%; KM9, krill meal 9%; and KM12, krill meal 12%.
1Hematocrit (%)
2Hemoglobin (g dL-1)
3Triglyceride (mg dL-1)
4Total cholesterol (mg dL-1)
5Total proteins (g dL-1)
6Aspartate Transaminase (U/l)
7Alanine Transaminase (U/l)
Diets Ht1 Hb2 TG4 Cho5 TP6 AST7 ALT8
HFM 29.6±2.87ab 4.95±0.37ab 147±7ab 91.4±10.5 1.40±0.27 11.1±5.66 8.03±4.86 LFM 20.8±1.97d 4.83±0.40b 144±6b 94.2±4.86 1.27±0.07 7.44±3.37 10.0±4.87 KM3 23.8±1.37cd 5.24±0.22ab 152±1ab 86.7±11.5 1.42±0.15 8.60±2.43 7.98±0.65 KM6 24.2±1.69bcd 5.48±0.19a 153±1a 93.3±6.15 1.69±0.32 10.4±4.95 10.7±3.19 KM9 28.6±1.64abc 5.47±0.17a 151±1ab 105±11 1.65±0.30 11.8±4.32 8.31±1.42 KM12 31.5±3.51a 5.35±0.14ab 152±1ab 106±8 1.42±0.33 8.67±2.38 10.2±1.39
22
Figure 13. Hematological parameters of olive flounder fed the six experimental diets for 12
23
Table 6. The non-specific immune response of olive flounder fed the six experimental diets for 12 weeks.
Diets Antiprotease1 Catalase2 GPx3 Lysozyme4 MPO5 NBT6 SOD7 Ig8
HFM 21.29±1.05a 0.21±0.03 73.91±1.79ab 42.26±0.76a 1.80±0.31 0.43±0.01 60.82±1.66bc 17.69±1.60 ab LFM 17.27±0.44b 0.21±0.03 67.17±1.28b 36.99±2.68b 1.74±0.16 0.40±0.03 53.79±1.64d 14.72±0.52b KM3 20.15±0.75a 0.22±0.04 77.59±9.72a 44.13±1.13a 1.85±0.31 0.44±0.03 58.23±1.37bcd 16.01±2.62ab KM6 21.47±0.89a 0.22±0.03 76.07±1.61ab 44.81±0.75a 1.85±0.24 0.46±0.02 67.10±2.18a 18.91±1.24a KM9 21.15±1.41a 0.24±0.03 75.72±2.12ab 44.39±0.39a 1.91±0.28 0.46±0.05 63.47±2.98ab 17.59±1.46ab KM12 19.64±1.73ab 0.23±0.03 71.73±2.16ab 39.08±1.96b 1.66±0.23 0.46±0.01 54.75±4.80cd 16.17±0.64ab
Values are mean of quadruplicate groups and presented as mean ± SD. Values in the same column having different superscript letters are
significantly different (P < 0.05). The lack of superscript letter indicates no significant differences among treatments. HFM, high fish meal; LFM, low fish meal; KM3, krill meal 3%; KM6, krill meal 6%; KM9, krill meal 9%; and KM12, krill meal 12%.
1 Antiprotease (% inhibition)
2 Catalase activity (mU ml-1)
3 Glutathione peroxidase activity (mU ml-1)
4 Lysozyme activity (µg mL-1)
5 Myeloperoxidase level
6 Nitro blue tetrazolium activity
7Superoxide dismutase (% inhibition)
24
Figure 14. Non-specific immune response of olive flounder fed the six experimental diets for
25
Table 7. Goblet cell counts, villi length and morphometric parameters of olive flounder fed the six experimental diets for 12 weeks.
Values are mean of triplicate groups and presented as mean ± S.D. Values with different superscripts in the same column are significantly different (P < 0.05). The lack of superscript letter indicates no significant differences among treatments. HFM, high fish meal; LFM, low fish meal; KM3, krill meal 3%; KM6, krill meal 6%; KM9, krill meal 9%; and KM12, krill meal 12%.
1
Goblet Cell count 2
Villi Length (µm) 3
Enterocyte Height (µm) 4
Conditional factor = (Fish weight/ Fish length3)*100 (gcm-3)
5
Hepatosomatic index= (Liver weight/ Fish weight)*100 6
Viscerosomatic index= (Viscera weight/ Fish weight)*100
7Fillet yield= (Fillet weight/Fish weight) x 100
Diets GC1 VL2 EH3 CF4 HSI5 VSI6 Fillet yield 7
HFM 776±77bc 1355±312ab 58.1±17.5 1.04±0.01ab 1.57±0.11ab 4.51±0.16 47.19±2.37a LFM 628±50c 1029±221b 55.7±12.3 0.95±0.02c 1.50±0.15b 5.04±0.24 42.05±0.98b KM3 944±68a 1693±173a 60.4±13.3 1.05±0.03a 1.71±0.21ab 5.05±0.33 48.07±1.09a KM6 932±60a 1700±180a 62.1±16.2 1.06±0.04a 1.87±0.23a 4.96±0.23 49.20±1.04a KM9 932±77a 1633±145a 60.6±6.0 1.04±0.01ab 1.78±0.09ab 4.95±0.16 47.89±0.79a KM12 907±76ab 1550±166a 59.6±3.0 0.99±0.02bc 1.52±0.09b 4.51±0.03 46.43±1.37a
26
Figure 15. Goblet cell counts, villi length and morphometric parameters of olive flounder fed
27
Table 8. Whole body proximate composition of olive flounder fed the six experimental diets
for 12 weeks
Diets Dry matter Protein Lipid Ash
HFM 26.80±0.15 73.00±1.91 12.22±0.76 13.54±1.85 LFM 26.01±0.47 70.55±7.70 13.70±2.70 14.14±1.17 KM3 26.31±1.06 75.01±3.79 13.01±2.19 13.00±2.86 KM6 26.73±0.32 75.17±4.30 14.00±2.06 11.84±1.50 KM9 26.52±1.21 80.04±2.53 13.42±0.67 12.31±0.97 KM12 26.46±1.21 76.19±5.12 10.82±1.51 14.26±2.54
Values are mean of quadruplicate groups and presented as mean ± S.D. HFM, high fish meal; LFM, low fish meal; KM3, krill meal 3%; KM6, krill meal 6%; KM9, krill meal 9%; and KM12, krill meal 12%.
Figure 16. Visual appearance of internal organs of olive flounder fed the six experimental
diets for 12 weeks. . 1-HFM, 2-LFM, 3-KM3, 4-KM6, 5-KM9, 6-KM12. Liver (A); Heart (B); Intestine (C). HFM, high fish meal; LFM, low fish meal; KM3, krill meal 3%; KM6, krill meal 6%; KM9, krill meal 9%; and KM12, krill meal 12%.
28
Figure 17. Macro-morphological characteristics of the olive flounder intestine fed the six
experimental diets for 12 weeks. 1-HFM, 2-LFM, 3-KM3, 4-KM6, 5-KM9, 6-KM12. Detail of intestine villus with measures of villus length (VL); Enterocyte Height (EH); (►) Goblet Cells (GC). Bar: 200 µm. HFM, high fish meal; LFM, low fish meal; KM3, krill meal 3%; KM6, krill meal 6%; KM9, krill meal 9%; and KM12, krill meal 12%.
Figure 18. Macro-morphological characteristics of olive flounder liver fed the six
experimental diets for 12 weeks. . 1-HFM, 2-LFM, 3-KM3, 4-KM6, 5-KM9, 6-KM12. Vacuolation (A); Blood vessels (B). Bar: 50µm. HFM, high fish meal; LFM, low fish meal; KM3, krill meal 3%; KM6, krill meal 6%; KM9, krill meal 9%; and KM12, krill meal 12%.
29
Figure 19. The survivals of olive flounder during the challenge test with E. tarda (1×10⁵ CFU ml-1). The fish were fed six experimental diets for 12 weeks before the challenge test. HFM, high fish meal; LFM, low fish meal; KM3, krill meal 3%; KM6, krill meal 6%; KM9, krill meal 9%; and KM12, krill meal 12%.
0 10 20 30 40 50 60 70 80 90 100 1 2 3 4 5 6 7 8 9 10 11 12 13 14 15 16 17 18 19 20 21 22 23 24 25 S u rvival %
Days after injection
HFM LFM KM3 KM6 KM9 KM12
30
4. DISCUSSION
According to the results of the present study, partial inclusion of krill meal
improved the growth performance and feed utilization of olive flounder confirming earlier investigations on dietary krill meal supplementation for several other fish species (Gaber, 2005; Olsen et al., 2006; Suontama et al., 2007a; Suontama et al., 2007b; Hansen et al., 2011; Tibbetts et al., 2011; Saleh et al., 2018). The improved FIs of the KM3, KM6 and KM9 groups compared to the LFM group may be a result of feed attractant properties of krill, which led to higher appetite as described by Kolkovski et al., (2000). In addition to the well-balanced nutritional profile similar to FM (Tou et al., 2007), krill meal contains high levels of phospholipids (Storebakken, 1988; Xie et al., 2019) and astaxanthin
(Higuera-Ciapara et al., 2006; Ambati et al., 2014) that are considered to be stimulators of fish growth (Betancor et al., 2012; Saleh et al., 2013). Therefore, both increased
palatability and growth stimulators can explain the improved growth performance of KM3, KM6 and KM9 groups over the LFM group. The present results also indicate that the krill meal inclusion by 3 - 9% into an LFM diet in which FM (i.e. sardine) level is lower than 30% can produce significantly improved growth and feed utilization performances of olive flounder, which are comparable to those of a HFM diet with FM level higher than 50%.
ADC of dry matter and protein of the diets were improved by krill meal supplementation compared to the LFM diet alone, although there was no clear trend
among the KM diet groups. Similar results were observed in Nile tilapia (Gaber, 2005) and Atlantic halibut (Tibbetts et al., 2011), when a krill meal supplemented diet was fed to the fish. Moreover, previous studies conducted by our laboratory proved the positive effects of krill hydrolysates on dry matter (Khosravi et al., 2014; Khosravi et al., 2015a; Khosravi et al., 2017) and protein (Khosravi et al., 2015a; Khosravi et al., 2017) digestibility for olive flounder diets. Comparatively lower digestibility values of the LFM diet might be due to
31
relatively higher contents of SPC or tankage meal in the diet. However, Olsen et al. (2006) did not observe any significant difference in the digestibility by krill meal inclusion in diets for Atlantic salmon. Also, Suontama et al. (2007a) reported no differences in the digestibility of diets for Atlantic salmon and Atlantic halibut. It seems that the dietary composition would be the most critical factor in the diet digestibility, when the krill meal is added.
Hemoglobin content of fish blood is an indicator of O2 caring capacity and
hematocrit is a primary diagnostic parameter for fish health (Houston, 1997). Hence, in the present study, increased values of hemoglobin and hematocrit in the KM groups over the LFM group indicate that krill meal could improve fish health comparable to that of fish fed a HFM diet. The present data on hemoglobin and hematocrit are well confirmed with earlier investigations on krill meal or its hydrolysate inclusion in diets for Atlantic cod and Atlantic halibut (Tibbetts et al., 2011), Atlantic salmon (Suontama et al., 2007a), red seabream (Bui et al., 2014; Khosravi et al., 2015a; Khosravi et al., 2015b) and olive flounder (Khosravi et al., 2014; Khosravi et al., 2015a). Triglyceride content of plasma in the LFM group seemed to be reduced compared to other diet groups at the end of the feeding trial. Plasma triglyceride levels tend to be declined after cessation of feeding (Storebakken et al., 1991). Although the fish in the present study were not starved, the reduced feed intake of the LFM group might have induced such a result. According to Peres et al. (2014), reduction of both plasma levels of triglycerides and cholesterol could occur, when the feed intake is reduced, and it could be faster in triglycerides than in cholesterol. In the present study, the cholesterol levels of all the fish groups were not significantly different. Therefore, it implies that lower feed intake could have affected slightly on the energy or lipid metabolism in the LFM fish. Plasma protein, cholesterol, AST and ALT levels in the present study were not significantly different by the
32
supplementation of krill meal and these data were similar to previous results reported in Atlantic salmon (Olsen et al., 2006; Hansen et al., 2010). Almost the same results were also found in olive flounder when fed with krill hydrolysate (Khosravi et al., (2014); Khosravi et al., (2015a).
Regarding the non-specific immune response in fish, serum anti-protease, catalase, SOD, GPx, respiratory burst (NBT activity), MPO, lysozyme activity and immunoglobulin play important roles as substantial indicators (Martinez-Alvarez et al., 2005; Bergljót Magnadóttir, 2006; Esteban et al., 2013). Overall, in the present study, the krill meal supplemented diets improved performances over the LFM diet in non-specific immune parameters. Notably, the KM6 group performed significantly better than the HFM group in SOD activity. Although there was no investigation regarding the direct effect of krill meal on the fish immune system, the results of the present study demonstrated the immune-stimulatory effect of compounds such as astaxanthin and phospholipids present in krill. Amar et al., (2001) observed significantly higher serum lysozyme and immunoglobulin levels in rainbow trout (Oncorhynchus mykiss) fed an astaxanthin supplemented diet. Thompson et al. (1995) reported an increased anti-protease activity in the same fish species. According to Feng et al., (2016), dietary phospholipids increased SOD, catalase and GPx activities in gills of grass carp (Ctenopharyngodon idella). Moreover, krill is considered as a rich source of chitin and the positive effect of chitin as an
immunostimulator for many fish species has been well documented (Ringo et al., 2012). Furthermore, quiet similar results to the present study were obtained from the previous studies in olive flounder (Khosravi et al., 2014; Khosravi et al., 2015a; Khosravi et al., 2017) and red seabream (Bui et al., 2014; Khosravi et al., 2015a; Khosravi et al., 2015b). Therefore, it is suggested that the optimum inclusions of krill meal into a LFM diet having approximately 30% FM would be 3 - 6% for boosting the innate immune system of olive
33
flounder.
Histological study of the fish anterior intestine is one of the major aspects to evaluate the nutritional impact, because the gastrointestinal tract acts as the main site of nutrient absorption (Khosravi et al., 2015b). Villi length is a useful parameter to explain the development of intestinal morphology (Baeverfjord and Krogdahl, 1996) and the increase of the villi length implies a greater absorption of nutrients through increasing the surface area (Caspary, 1992). In the present study, the increased villi length of fish fed all krill meal diets were in an agreement with the results of Khosravi et al. (2017) where dietary krill hydrolysate supplementation increased the villi length of olive flounder. Therefore, it can be suggested that krill meal has a beneficial effect on the development of intestinal morphology even though we could not find a direct mechanism for the increase. Goblet cells are involved in protection or digestion processes in the alimentary tract through synthesizing and secreting mucus (Marchetti et al., 2006; Cerezuela et al., 2013). In the current study, goblet cell counts of the krill supplemented groups were significantly higher compared to the LFM group confirming the results of Khosravi et al. (2017). Interestingly, the KM3, KM6 and KM9 groups had significantly increased goblet cell counts compared to the HFM group. Many other studies have suggested that goblet cells positively affect the absorption of digestible substances (Osman and Caceci, 1991; Domeneghini et al., 2005; Shin et al., 2014). Therefore, the developed intestinal
morphology along with villi length or the increased goblet cell counts may be an indirect reason for the enhanced digestibility and growth performance of krill meal groups in the present study. Ringo et al. (2006) reported an increment of total viable counts of aerobic bacteria colonizing in hindgut of Atlantic salmon. In their hindgut, a larger number of goblet cells were identified in the krill meal supplemented group over a non-supplemented basal diet group, although no reason was mentioned. On the other hand, Hansen et al.
34
(2010; 2011) did not observe any histological difference in intestine of Atlantic salmon by deshelled or whole krill meal supplemented diets. Further investigations are required to evaluate the effects of dietary krill meal on intestinal morphology and find the underlying mechanism for it.
CF reflects the nutritional status of fish and HSI is an indirect measure of growth rate (McIntyre, 1993) as well as fillet weight, which commercially, is the most important part of fish (Bugeon et al., 2010). In the present study, CF and fillet weight in the KM3, KM6 and KM9 groups and HSI in the KM6 group were significantly improved over the LFM group, supporting the increased growth performance. Similarly, Tibbetts et al. (2011) reported an elevated HSI value in Atlantic cod fed diets supplemented with a freeze dried krill meal. Increased values of CF over a control diet was reported in Atlantic halibut (Suontama et al., 2007a) fed a diet containing 60% krill meal and Atlantic salmon (Olsen et al., 2006) fed diets with 20 - 40% krill protein.
To our best knowledge, there is no available data on disease resistance of fish fed krill meal included diets against pathogens. In the present study, the challenge test results indicated no significant survival difference among all the diet groups. However,
cumulative mortality of the LFM diet group seemed to be much higher than that of krill meal groups. This result is similar to the results (Khosravi et al., 2014, 2015a) where a krill hydrolysate supplementation in a LFM diet improved the survival of olive flounder
challenged with E. tarda pathogen. Also, the krill hydrolysate supplementation
significantly increased the survival over a control diet of olive flounder (Khosravi et al., 2017) and red seabream (Bui et al., 2014, Khosravi et al., 2015b) against E. tarda. The increased survival of the fish against the pathogen can clearly be explained with the improved or boosted innate immune system mentioned above.
35
In conclusions, dietary krill meal supplementation into a LFM diet can increase the growth performance and feed utilization efficiency, protein and dry matter digestibility, intestinal development and functions, innate immunity and disease resistance of olive flounder. The optimal supplemental levels of krill meal would be between 6 – 9%, when the FM level is reduced in feeds.
36
5. CONCLUSIONS
1. Dietary krill meal supplementation can increase the growth performance and feed utilization efficiency of olive flounder when they are fed a low fish meal feed. 2. Dietary krill meal supplementation can improve the intestinal functions (increased
goblet cell and villi length) for digestibility and thereby enhances the protein and dry matter digestibility of a low fish meal diet for olive flounder.
3. Dietary krill meal supplementation can improve the innate immunity, health of olive flounder and thereby increase its disease resistance against Edwardsiella tarda which is a serious bacterial pathogen in the flounder farms in South Korea. 4. The fillet yield of olive flounder could be increased by approximately 10 – 17%
when krill meal is properly supplemented into a low fish meal feed.
5. The optimum supplemental level of krill meal would be approximately 6 – 9% when low fish meal feeds are used for olive flounder.
6. Further studies are necessary on the effects of krill meal supplemented diets regarding intestinal and digestive function of olive flounder.
37
6. REFERENCES
Albrektsen, S., Mundheim, H., Aksnes, A., 2006. Growth, feed efficiency, digestibility and nutrient distribution in Atlantic cod (Gadus morhua) fed two different fish meal qualities at three dietary levels of vegetable protein sources. Aquaculture 261, 626– 640.
Allahpichay, I., Shimizu, C., 1984. Supplemental effect of the whole body krill meal and the non-muscle krill meal of Euphausia superba in fish diet. Bull. Jpn. Soc. Sci. Fish. 50, 815–820.
Amar, E.C., Kiron, V., Satoh, S., Watanabe, T., 2001. Influence of various dietary synthetic carotenoids on biodefence mechanisms in rainbow trout, Oncorhynchus mykiss (Walbaum). Aquaculture Research. 32, 162-173.
Ambati, R.R., Phang, S.M., Ravi, S., Aswathanarayana, R.G., 2014. Astaxanthin: sources, extraction, stability, biological activities and its commercial applications-a review. Mar. Drugs 12, 128–52.
Anderson, D.P., Siwicki, A.K., 1995. Basic hematology and serology for fish health
programs. In: Shariff, M., Arthur, J.R., Subasinghe, R.P. (Eds.), Diseases in Asian Aquaculture II. Philippines fish health section, Asian Fisheries Society, Manila, pp. 185–202.
AOAC (Association of Official Analytical Chemists), 1995. Official Methods of Analysis of Official Analytical Chemists International, 16th ed. Association of Official
Analytical Chemists, Arlington, VA, USA.
38
induced enteritis in Atlantic salmon, Salmo salar L., distal intestine: A comparison with the intestines of fasted fish. J. Fish Dis. 19, 375–387.
Betancor, M.B., Nordrum, S., Atalah, E., Caballero, M.J., Benítez-Santana, T., Roo, J., Robaina, L., Izquierdo, M., 2012. Potential of three new krill products for seabream larval production. Aquac. Res. 43, 395–406.
Brinker, A., Reiter, R., 2011. Fish meal replacement by plant protein substitution and guar gum addition in trout feed, Part I: Effects on feed utilization and fish quality.
Aquaculture 310, 350–360.
Brown, B.A., 1980. Routine hematology procedures. In: Brown, B.A. (Ed.), Hematology, Principles and Procedures. Lea and Febiger, Philadelphia, PA, USA, pp. 71–112. Bugeon, J., Lefevre, F., Cardinal, M., 2010. Flesh quality in large rainbow trout with high
or low fillet yield. J. Muscle Foods 21, 702–721.
Bui, H.T.D., Khosravi, S., Fournier, V., Herault, M., Lee, K.J., 2014. Growth performance, feed utilization, innate immunity, digestibility and disease resistance of juvenile red seabream (Pagrus major) fed diets supplemented with protein hydrolysates. Aquaculture 418–419, 11–16.
Caspary, W.F., 1992. Physiology and pathophysiology of intestinal absorption, in: American Journal of Clinical Nutrition. pp. 299S-308S.
Cerezuela, R., Fumanal, M., Tapia-Paniagua, S.T., Meseguer, J., Moriñigo, M.Á ., Esteban, M.Á ., 2013. Changes in intestinal morphology and microbiota caused by dietary administration of inulin and Bacillus subtilis in gilthead sea bream (Sparus aurata L.) specimens. Fish Shellfish Immunol. 34, 1063–1070.
De Francesco, M., Parisi, G., Pérez-Sánchez, J., Gómez-Réqueni, P., Médale, F., Kaushik, S.J., Mecatti, M., Poli, B.M., 2007. Effect of high-level fish meal replacement by
39
plant proteins in gilthead sea bream (Sparus aurata) on growth and body/fillet quality traits. Aquac. Nutr. 13, 361–372.
Divakaran, S., Obaldo, L.G., Forster, I.P., 2002. Note on the methods for determination of chromic oxide in shrimp feeds. J. Agric. Food Chem. 50, 464–467.
Domeneghini, C., Arrighi, S., Radaelli, G., Bosi, G., Veggetti, A., 2005. Histochemical analysis of glycoconjugate secretion in the alimentary canal of Anguilla anguilla L. Acta Histochem. 106, 477–487.
Ellis, A.E., Stolen, J.S., Fletcher, T.C., Anderson, D.P., Roberson, W.B., Vanmuiswinker, W.B., 1990. Serum antiprotease in fish. Techniques in Fish Immunology. SOS Publication, Fair Haven, USA, pp. 95–99.
Espe, M., Lemme, A., Petri, A., El-Mowafi, A., 2006. Can Atlantic salmon (Salmo salar) grow on diets devoid of fish meal?. Aquaculture 255, 255–262.
Esteban, M.A., Cuesta, A., Chaves-Pozo, E., Meseguer, J., 2013. Influence of melatonin on the immune system of fish: a review. Int. J. Mol. Sci. 14, 7979–7999.
Everson, I. ed., 2008. Krill: biology, ecology and fisheries. John Wiley & Sons.
FAO, 2018. The State of World Fisheries and Aquaculture 2018 - Meeting the sustainable development goals. Rome.
Feng, L., Chen, Y.P., Jiang, W.D., Liu, Y., Jiang, J., Wu, P., Zhao, J., Kuang, S.Y., Tang, L., Tang, W.N., Zhang, Y.A., Zhou, X.Q., 2016. Modulation of immune response, physical barrier and related signaling factors in the gills of juvenile grass carp (Ctenopharyngodon idella) fed supplemented diet with phospholipids. Fish Shellfish Immunol. 48, 79–93.
40
Folch, J., Lees, M., Sloane Stanley, G.H., 1957. A simple method for the isolation and purification of total lipids from animal tissues. J. Biol. Chem. 226, 497–509. Francis, G., Makkar, H.P.S., Becker, K., 2001. Antinutritional factors present in
plant-derived alternate fish feed ingredients and their effects in fish. Aquaculture 199, 197 – 227.
Gaber, M.M.A., 2005. The Effect of Different Levels of Krill Meal Supplementation of Soybean-based Diets on Feed Intake, Digestibility, and Chemical Composition of Juvenile Nile Tilapia Oreochromis niloticus, L. J. World Aquac. Soc. 36, 346– 353.
Hansen, J.Ø., Penn, M., Øverland, M., Shearer, K.D., Krogdahl, Å., Mydland, L.T.,
Storebakken, T., 2010. High inclusion of partially deshelled and whole krill meals in diets for Atlantic salmon (Salmo salar). Aquaculture 310, 164–172.
Hansen, J.Ø., Shearer, K.D., Øverland, M., Penn, M.H., Krogdahl, A., Mydland, L.T., Storebakken, T., 2011. Replacement of LT fish meal with a mixture of partially deshelled krill meal and pea protein concentrates in diets for Atlantic salmon (Salmo salar). Aquaculture 315, 275–282.
Hardy, R.W., 2010. Utilization of plant proteins in fish diets: Effects of global demand and supplies of fishmeal. Aquac. Res. 41, 770–776.
Hertrampf, J.W., Piedad-Pascual, F., 2012. Handbook on ingredients for aquaculture feeds. Springer Science & Business Media 23, 221–227.
Higuera-Ciapara, I., Félix-Valenzuela, L., Goycoolea, F.M., 2006. Astaxanthin: A review of its chemistry and applications. Crit. Rev. Food Sci. Nutr. 46, 185–196.
41
Houston, A.H., 1997. Review: Are the Classical Hematological Variables Acceptable Indicators of Fish Health? Trans. Am. Fish. Soc. 126, 879–894.
Hultmark, D., steiner, H., rasmuson, T., boman, H.G., 1980. Insect Immunity. Purification and Properties of Three Inducible Bactericidal Proteins from Hemolymph of Immunized Pupae of Hyalophora cecropia. Eur. J. Biochem. 106, 7–16.
Kaushik, S.J., Hemre, G.I., 2008. Plant proteins as alternative sources for fish feed and farmed fish quality, in: Improving Farmed Fish Quality and Safety. Woodhead Publishing, pp. 300–327.
Khosravi, S., Bui, H.T.D., Herault, M., Fournier, V., Kim, K.D., Lee, B.J., Kim, K.W., Lee, K.J., 2017. Supplementation of Protein Hydrolysates to a Low-fishmeal Diet Improves Growth and Health Status of Juvenile Olive Flounder, Paralichthys olivaceus. J. World Aquac. Soc. 49, 897–911.
Khosravi, S., Bui, H.T.D., Rahimnejad, S., Herault, M., Fournier, V., Jeong, J.B., Lee, K.J., 2014. Effect of dietary hydrolysate supplementation on growth performance, non-specific immune response and disease resistance of olive flounder (Paralichthys olivaceus) challenged with Edwardsiella tarda. Aquac. Nutr. 21, 321–331.
Khosravi, S., Bui, H.T.D., Rahimnejad, S., Herault, M., Fournier, V., Kim, S.S., Jeong, J.B., Lee, K.J., 2015a. Dietary supplementation of marine protein hydrolysates in fish-meal based diets for red sea bream (Pagrus major) and olive flounder (Paralichthys olivaceus). Aquaculture 435, 371–376.
Khosravi, S., Rahimnejad, S., Herault, M., Fournier, V., Lee, C.R., Dio Bui, H.T., Jeong, J.B., Lee, K.J., 2015b. Effects of protein hydrolysates supplementation in low fish
42
meal diets on growth performance, innate immunity and disease resistance of red sea bream Pagrus major. Fish Shellfish Immunol. 45, 858–868.
Kim, J.M., Malintha, G.H.T., Gunathilaka, G.L.B.E., Lee, C., Kim, M.G., Lee, B.J., Kim, J.D., Lee, K.J., 2017. Taurine supplementation in diet for olive flounder at low water temperature. Fish. Aquat. Sci. 20, 20.
Köhler, A., Sarkkinen, E., Tapola, N., Niskanen, T., Bruheim, I., 2015. Bioavailability of fatty acids from krill oil, krill meal and fish oil in healthy subjects-a randomized, single-dose, cross-over trial. Lipids Health Dis. 14, 19.
Kolkovski, S., Czesny, S., Dabrowski, K., 2000. Use of krill hydrolysate as a feed attractant for fish larvae and juveniles. J. World Aquac. Soc. 31, 81–88.
Kotzamanis, Y., Kouroupakis, E., Ilia, V., Haralabous, J., Papaioannou, N., Papanna, K., Richards, R., Gisbert, E., 2018. Effects of high-level fishmeal replacement by plant proteins supplemented with different levels of lysine on growth performance and incidence of systemic noninfectious granulomatosis in meagre (Argyrosomus regius). Aquac. Nutr. 24, 1738–1751.
Magnadóttir, B., 2006. Innate immunity of fish (overview), in: Fish and Shellfish Immunology. Academic Press, pp. 137–151.
Magnadóttir, B., Jónsdóttir, H., Helgason, S., Björnsson, B., Jørgensen, T., Pilström, L., 1999. Humoral immune parameters in Atlantic cod (Gadus morhua L.). I. The effects of environmental temperature. Comp. Biochem. Physiol. - B Biochem. Mol. Biol. 122, 173–180.
43
Marchetti, L., Capacchietti, M., Sabbieti, M.G., Accili, D., Materazzi, G., Menghi, G., 2006. Histology and carbohydrate histochemistry of the alimentary canal in the rainbow trout Oncorhynchus mykiss. J. Fish Biol. 68, 1808–1821.
Martínez-Á lvarez, R.M., Morales, A.E., Sanz, A., 2005. Antioxidant defenses in fish: Biotic and abiotic factors. Rev. Fish Biol. Fish. 15, 75–88.
McIntyre, A.D., 1993. Methods for fish biology. Fish. Res. 16, 277–278.
Metcalfe, L.D., Schmitz, A.A., 1961. The Rapid Preparation of Fatty Acid Esters for Gas Chromatographic Analysis. Anal. Chem. 33, 363–364.
Moren, M., Suontama, J., Hemre, G.I., Karlsen, Olsen, R.E., Mundheim, H., Julshamn, K., 2006. Element concentrations in meals from krill and amphipods, - Possible alternative protein sources in complete diets for farmed fish. Aquaculture 261, 174–181.
Olsen, R.E., Suontama, J., Langmyhr, E., Mundheim, H., Ringø, E., Melle, W., Malde, M.K., Hemre, G.I., 2006. The replacement of fish meal with Antarctic krill, Euphausia superba in diets for Atlantic salmon, Salmo salar. Aquac. Nutr. 12, 280–290.
Peres, H., Santos, S., Oliva-Teles, A., 2014. Blood chemistry profile as indicator of nutritional status in European seabass (Dicentrarchus labrax). Fish Physiol. Biochem. 40, 1339–1347.
Pfaffl, M.W., 2001. A new mathematical model for relative quantification in real-time RT-PCR. Nucleic Acids Res. 29, 45e – 45.
44
Quade, M.J., Roth, J.A., 1997. A rapid, direct assay to measure degranulation of bovine neutrophil primary granules. Vet. Immunol. Immunopathol. 58, 239–248.
Rathore, S.S., Chandravanshi, A., Sahu, D. and Chandravanshi, P., 2018. Growth, feed utilization and body composition of magur (Clarias batrachus) fed diets containing different plant proteins: Partial or total substitution of fish meal. J. Entomol. Zool. Stud. 6, 1687–1690.
Ringø, E., Sperstad, S., Myklebust, R., Mayhew, T.M., Mjelde, A., Melle, W., Olsen, R.E., 2006. The effect of dietary krill supplementation on epithelium-associated
bacteria in the hindgut of Atlantic salmon (Salmo salar L.): A microbial and electron microscopical study. Aquac. Res. 37, 1644–1653.
Ringø, E., Zhou, Z., Olsen, R.E., Song, S.K., 2012. Use of chitin and krill in aquaculture - the effect on gut microbiota and the immune system: A review. Aquac. Nutr. 18, 117–131.
Saleh, R., Betancor, M.B., Roo, J., Benítez-Santana, T., Hernández-Cruz, C.M., Moyano, F.J., Izquierdo, M., 2013. Optimum krill phospholipids content in microdiets for gilthead seabream (Sparus aurata) larvae. Aquac. Nutr. 19, 449–460.
Saleh, R., Burri, L., Benitez-Santana, T., Turkmen, S., Castro, P., Izquierdo, M., 2018. Dietary krill meal inclusion contributes to better growth performance of gilthead seabream juveniles. Aquac. Res. 49, 3289–3295.
Shin, N.R., Lee, J.C., Lee, H.Y., Kim, M.S., Whon, T.W., Lee, M.S., Bae, J.W., 2014. An increase in the Akkermansia spp. population induced by metformin treatment improves glucose homeostasis in diet-induced obese mice. Gut 63, 727–735. Siwicki, A., Anderson, D., 1993. Nonspecific defence mechanisms assay in fish II: