초분광 이미지를 이용한 배나무 화상병에 대한 최적 분광 밴드 선정
강예성1, 박준우1, 장시형1, 송혜영1, 강경석1, 유찬석1*, 김성헌2, 전새롬3, 강태환4, 김국환5 1) 1경상대학교 농업생명과학대학 애그로시스템공학전공, 2큐슈대학교, 3주식회사 호티젠, 4공주대학교 농업생명과학대학 생물산업기계공학과, 5농촌진흥청 농업공학부 (2021년 3월 2일 접수; 2021년 3월 18일 수정; 2021년 3월 22일 수락)Spectral Band Selection for Detecting Fire Blight Disease in
Pear Trees by Narrowband Hyperspectral Imagery
Ye-Seong Kang1, Jun-Woo Park1, Chan-Seok Ryu1*, Si-Hyeong Jang1, Hye-Young Song1, Kyung-Suk Kang1, Seong-Heon Kim2, Sae-Rom Jun3, Tae-Hwan Kang4 and Gul-Hwan Kim5
1Department of Agro-System Engineering, GyeongSang National University (Institute of Agriculture & Life Science), Jinju 52828, Republic of Korea,
2Granduate School of Bioresource and Bioenvironmental Science, Kyushu Universtiy, 744 Motooka, Nishi-ku, Fukuoka 819-0395, Japan
3Hortizen Co. Ltd., Jinju, 52818, Republic of Korea,
4Bio Industry Mechanical Engineering, Kongju National Universtiy, Kongju, 32588, Republic of Korea, 5National Academy of Agricultural Science, Rural Development Administration, 54875, Jeonju, Republic of Korea
(Received March 2, 2021; Revised March 18, 2021; Accepted March 22, 2021) ABSTRACT
In this study, the possibility of discriminating Fire blight (FB) infection tested using the hyperspectral imagery. The reflectance of healthy and infected leaves and branches was acq uired with 5 nm of full width at high maximum (FWHM) and then it was standardized to 10 nm, 25 nm, 50 nm, and 80 nm of FWHM. The standardized samples were divided into training and test sets at ratios of 7:3, 5:5 and 3:7 to find the optimal bands of FWHM by the decision tree analysis. Classification accuracy was evaluated using overall accuracy (OA) and kappa coefficient (KC). The hyperspectral reflectance of infected leaves and branches was significantly lower than those of healthy green, red-edge (RE) and near infrared (NIR) regions. The bands selected for the first node were generally 750 and 800 nm; these were used to identify the infection of leaves and branches, respectively. The accuracy of the classifier was higher in the 7:3 ratio. Four bands with 50 nm of FWHM (450, 650, 750, and 950 nm) might be reasonable because the difference in the recalculated accuracy between 8 bands with 10 nm of FWHM (440, 580, 640, 660, 680, 710, 730, and 740 nm) and 4 bands was only 1.8% for OA and 4.1% for KC, respectively. Finally, adding two bands (550 nm and 800 nm with 25 nm of FWHM) in four bands with 50 nm of FWHM have been proposed to improve the usability of multispectral image sensors with performing various roles in agriculture as well as detecting FB with other combinations of spectral bands. Key words: Fire blight, Hyperspectral image, Machine learning, Decision tree, Multispectral
image sensor
* Corresponding Author : Chan-Seok Ryu ([email protected])
I. lntroduction
Fire blight (FB) is a highly contagious disease caused by the bacteriophage Erwinia amylovora. This virus was first developed in North America in 1780 and migrated to Europe in the late 1950s (Jock et al., 2002), often developing in apple and pear treas. In South Korea, the first FB infection case was reported in 2015 in Anseong, Gyeonggi Province. The infection path involves E. amylovora entering through flowers or wounded areas on plants, blocking the nutrients flow through the leaves, thus slowly withering the tree (Bagheri et al., 2018). When the leaves and branches have withered, their colour changes from green to dark brown or black (Van et al., 1979). To prevent additional diffusion of FB, which has a strong capability of infection, fruits within a radius of 100 m from the infected plant are buried, and fruit cultivation is prohibited for 20 years, for detecting and preventing FB, which causes damage to the country’s economy every year. In the United States, 240 hectares of apple orchards withered in southwest Michigan in 2000, causing a total economic loss of 42 million dollars (Norelli et al., 2003). In Switzerland, approximately 40,000 fruits over 100 hectare were infected in 2007, costing approximately 50 million dollars in order to bury them (Gusberti et al., 2015), with an additional 9 million dollars spent every year to prevent a further FB outbreak (Hasler et al., 2001).
To minimize economic loss by FB, many national institutions are conducting various studies using real-time polymerase chain reaction (PCR), or pulsed-field gel electrophoresis (PFGE) identifying genetic information that respond to FB in DNA analysis (Hinze et al., 2016; Kim et al., 2001 ). To delay or weaken the spread of FB using the genetic information, chemical analysis based on benzoth- iadiazole (Thomson et al., 1998), streptomycin, potassium phosphites, and acibenzolar-S-methyl (Aćimović et al., 2015) or biological analysis based on pantoea agglomerans P10c (Smail et al., 2016) or gene analysis based on pantoea (ACBP2),
brevibacterium (SF3 and SF4), and bacillus (LMR2) (Bahadou et al., 2018) were also being studied.
Fruits with FB resistance have been produced through antibiotic administration and genetic modification and have been introduced in the field. However, unsuitable product types have made them difficult to commercialize (Norelli et al., 2003). An antibiotic that can effectively control FB was developed in 2005 in North America, but is no longer effective due to increased antibiotic resistance (Buchanan et al., 1980). Research into FB resistance has received continued attention, but measures to minimize damage through continuous monitoring of FB are also required.
Disease experts monitor FB during four periods (mid-May, late June, mid-July, and late November). If parts of the pear tree are suspected to be contaminated by FB, the infected leaves or branches are sampled and investigated using DNA analysis. The Disease Control Division ultimately decides whether trees are infected or not. However, DNA analysis takes time and it is possible that the movement of FB monitoring teams can cause secondary infection. Therefore, it is necessary to identify FB infection using non-contact, non- destructive, and less time-consuming methods.
Consequently, research on disease monitoring using multispectral or hyperspectral images has been conducted for agricultural studies, such as late blight of tomato (Broggini et al., 2005; Zhang et al., 2003), fusarium head blight of wheat (Jarolmasjed et al., 2019; Jaillais et al., 2015; Qiu et al., 2019), Verticillium wilt of olive (Calderón et al., 2019), cercospora of sugar cane (Mahlein et al., 2016), and sugar beet (Zhou et al., 2015; Leucker et al., 2015; Mahlein et al., 2012).
Attempts have been made to use high-resolution images of large areas acquired through multispectral imaging sensors mounted in unmanned aerial vehicles (UAVs) for disease monitoring (Berni et al., 2009). Disease monitoring techniques for crops require customized imaging sensors because the wavelength range and the number of bands reacting to each
disease are different. However, when using a commercialized, multispectral imaging sensor, it is essential to use hyperspectral imaging sensors that have numerous, wide spectral bands because there are wavelength ranges and numbers of bands that do not react to diseases (Chan et al., 2008).
The high-dimensional data acquired through hyperspectral imaging sensors are actively applied to agricultural research because they provide a detailed understanding of the spectral characteristics of crops based on a wide range of wavelengths. For example, one study predicted the nitrogen content of rice using hyperspectral imaging sensors (Ryu et al., 2011), and another study classified infections by using the spectral differences of pathogens found in the leaves of beets (Mahlein et al., 2012). Thus, crop categories, growth stage, and the presence or absence of disease can be visualized by using hundreds of spectral bands for analysis. However, not all high-dimensional data acquired through hyperspectral imaging sensors are essential for disease classification. Thus, the desired spectral information can be accompanied by irrelevant information from the region of interest, due to the high correlation between continuous spectral bands (Medjahed et al., 2016). To solve this so-called “curse of dimensionality” problem, imaging data can be increased to obtain a higher classification accuracy. However, there is an issue of both time and cost in acquiring such images (Sun et al., 2015). Therefore, it is not necessary to analyze all bandwidths, and it is important to select a band of the wavelength range that includes significant information about the region of interest (Du et al., 2003; Sarhrouni et al., 2012). Furthermore, it is essential to select a significant wavelength range to reduce the cost of sensors for commercialization (Li et al., 2016).
To choose a band for FB detection, the DT can easily identify major descriptive variables among the machine learning algorithms. DT learns given data, classifies target classes by formulating explicit rules, and predicts about them (Goel et al., 2003). DT has been applied to a study that classified cabbage and
radish based on hyperspectral images (Kang et al., 2018), a study on urban cover observation classification model based on LiDAR (Light Detection and Ranging) (Tooke et al., 2009), and a GIS-based virus outbreak control measure against foot-and-mouth disease (Tomassen et al., 2002). The main purpose of the project is to give information about location of infected pear orchards to FB monitoring teams. Therefore, it is necessary to develop a new multispectral senor that have the specific bands to identify whether trees are infected by FB or not. This study aimed to acquire spectral data for both healthy and FB infected leaves and branches in pear trees using a hyperspectral camera. The purpose of this study was to verify the possibility of non-destructive FB detection by selecting a wavelength range that can classify FB using a decision tree (DT), which has been applied in various fields, and by evaluating the classification accuracy.
II. Material and Methods
2.1. Study area
From May 2017 to July 2018, images were acquired for FB-infected pear trees in Orchard A (36°92’65.9624"N, 127°23’10.0087"E) and Orchard B (36°92’49.2473"N, 127°23’38.6288"E) in Song+ jeong-ri, Orchard C (36°90’82.8211"N, 127°27’61.55 63"E) in Cheongyong-ri, and Orchard D (36°92’05. 4528"N, 127°25’66.0283"E) in Sanpyeong-ri, Seoun- myeon, Anseong-si, Gyeonggi-do, Orchard E (37°03’ 30.99"N, 127°24’33.07"E) in Daedeok-myeon, and Orchard F in Dokjeong-ri, Ipjang-myeon, Cheonan-si, Chungcheongnam-do (36°92’42.0224"N, 127°22’70. 6734"E). In addition, images of non-infected by FB for pear trees were taken in Orchard G (35°01’ 27.9912"N, 126°44’53.0412"E) in the Pear Research Center of the National Institute of Horticulture & Herbal Science in Naju-si, Jeollanam-do (Fig. 1). The breed of the pear trees (Pyrus pyrifolia cv.) was Singo (Jungang Gardening & Seedling, Korea). Since FB has a strong infection rate, hyperspectral images were taken only during the regular forecast period (May,
June, July, and November) together with experts to judge whether or infection of FB in the Disaster Response Department of the Rural Development Administration.
2.2. Hyperspectral data and processing
Hyperspectral images of healthy leaves and branches, and those infected by FB in pear trees were obtained using the VNIR spectral imaging sensor (PS, (A)
(B) (C)
Fig. 1. Locations of the study field (red box, green box) in the Republic of Korea (A), Songjung-ri, Dokjeong-ri (blue box), Cheongyong-ri (yellow box), Sanpyeong-ri (cyan box) and Mosan-ri (magente box) (B), Pear Research Center of the National Institute of Horticulture & Herbal Science in Naju-si (orange box) (C).
SPECIM, Finland), which is a hyperspectral images sensor with a 22.1° field of view (FOV). The spectral resolution of the captured hyperspectral images was 5.6 nm, and the images consisted of 519 bands in the wavelength region of 400–1000 nm. Photographs were taken from the side of the leaves and branches of the pear tree. For reflectance calibration and dark current calibration of the hyperspectral images, a 18% white reference board was acquired with pear trees, and the dark current was additionally obtained before
taking images (Fig. 2).
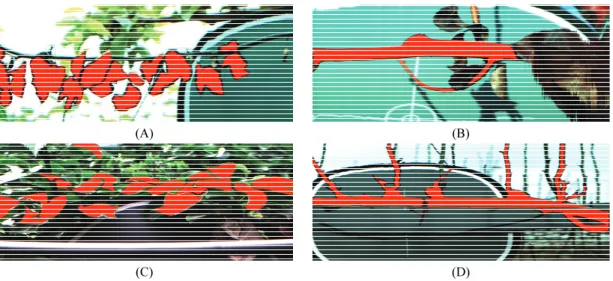
The acquired images were separated into vegetation and non-vegetation areas by the Ortho’s threshold method using the image processing software, ENVI 5.3 (Exeils Visual Information Solution Inc., USA). The reflectance of leaves and branches infected with FB in fields A- F, and the reflectance of healthy leaves and branches in field G, were extracted using a function of the region of interest (ROI) (Fig. 3). The reflectance values were
(A) (B)
(C) (D)
Fig. 2. RGB images of leaf (A) and branch (B) of FB-infected pear tree and leaf (C) and branch (D) of FB-uninfected pear tree.
(A) (B)
(C) (D)
Fig. 3. Extraction of ROIs of the leaf (A) and branch (B) of FB-infected pear tree and the leaf (C) and branch (D) of FB-uninfected pear tree.
standardized into 10 nm of the interval and then recalculated based on 25 nm, 50 nm, and 80 nm of FWHM such as commercial band pass filter to develop a sensor for FB detection.
2.3. Decision-tree
The DT procedure is a recursive classification of the defined training data at each node. DT consisted of branches with an arc value for categorizing specific classes from the upper node and leaves representing the final order of classes. The nodes connected to each branch consisted of one upper node and two lower nodes that included attribute values for classification. DT develops a classification model using training samples and evaluates the classification accuracy using test samples as validation data. However, if training samples are not generalized properly, the DT can become too complex and reproducibility can be lowered. Thus, the overfitting problem was minimized using pruning (Friedl et al., 2010).
Specifically, to perform pruning in the upper node, DT used the Gini index, which is a measure of uncertainty and a binary partition. Gini index measures impurity at each node and is expressed as a probability of misclassification of a random object that belongs to the jth category of the target variable (Breiman et al., 1984). The equation for the Gini index is:
≤ ≤ (Eq. 1) where Gi is the Gini index at the ith node, Pij is the probability that a random object at ith node belongs to the jth category, and c is the number of categories. The Gini index has a range of 0 to 0.5. When the
Gini index is closer to zero, the degree of classification is higher; when it is closer to 0.5, the degree of classification is lower.
The DT consisted of a data set of training and test samples used to select significant bands at ratios of 7:3, 5:5, and 3:7 based on the concept of induction principles for limited Boltzmann machine learning (Marlin et al., 2010). The reason dividing the various ratio of training and test datasets was to verify the similarity of the combination of bands that respond to FB through maximum utilization of the limited number of data. This statistical analysis was performed using the rpart package from the statistical software R (version 3.5.1, Lucent Technologies Inc., USA).
2.4. Classification accuracy
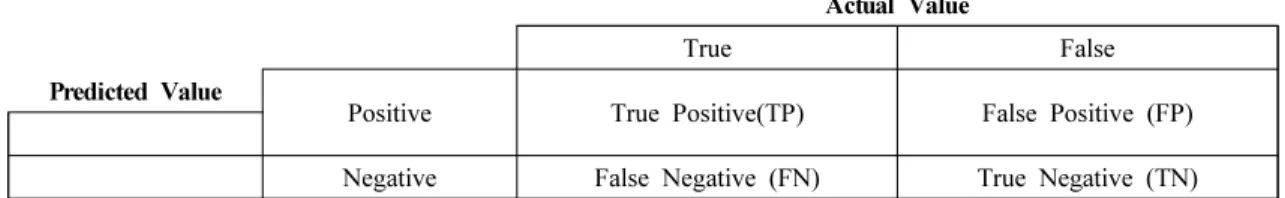
To evaluate the classification accuracy, the overall accuracy (OA) and kappa coefficient (KC) were calculated by using the confusion matrix (Deng et al., 2016), which is a machine learning concept that can visualize classification learning system (Table 1). The descriptive statistic OA is expressed as a sum of the correct classifications between actual and predicted classes among the total classes, as follows:
Overall accuracy (OA) = TP + FP + FN + TNTP + TN (Eq. 2) The multivariate statistic KC is expressed by an equation of the degree of classification considering the cases of misclassifications in OA and is calculated as the sum of the number of correctly classified classes xii and the number of miscalculated classes as follows:
Actual Value
True False
Predicted Value
Positive True Positive(TP) False Positive (FP)
Negative False Negative (FN) True Negative (TN)
Kappa coefficient (KC) = Overall accuracy – P(e)1 – P(e) (Eq. 3)
P (e) = (TP + FP) × (FN + TN) × (FP + TN)(TP + FP + FN +TN)2 (Eq. 4)
where P(e) is a hypothetical expected probability of agreement under an appropriate set of baseline constraints such as total independence of observer classifications(Landis et al., 1977). In the classific- ation ability, there was no problem if the classifier detected that leaves were infected by FB, despite the absence of infection. Contrastingly, as a case of a false negative (FN), the developed classifier could not identify the infected leaves at the pear orchard, hindering the infection’s prevention. Thus, to evaluate the classification accuracy for FN, the confusion matrix was recalculated to calculate the overall accuracy (OA) and kappa coefficient (KC). (Table 2.)
Recalculated overall accuracy (OA) = TP + FP + TN
TP + FP + FN + TN (Eq. 5) Recalculated kappa coefficient (KC) =
Recalculated overall accuracy – P′(e)
1 - P′(e) (Eq. 6) P′(e) = (TP + FP) × (FN + TN) × TN(TP + FP + FN +TN)2 (Eq. 7)
III. Results and Discussion
Severe noise by a flaw in the hyperspectral camera occurred in two sections, 747-765 nm and 899-921
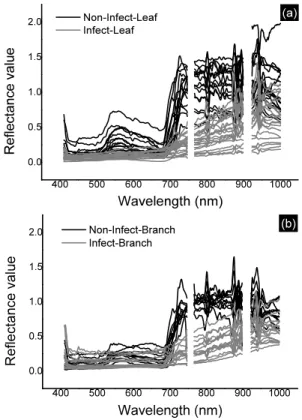
nm. One of them, which contained tiny fluctuation of whole wavelength, appeared imbalanced in light because we took images from the side of the pear tree. The other appeared after parts of NIR likely due to camera noise Thus, the two sections were removed (Fig. 4; gaps). There were the differences in the reflectance at green region (around 550 nm), and from 700-850 nm which is part of red-edge (RE) and near infrared (NIR) region (Fig. 4). The reflectance in green, RE and NIR bands were the sensitive region
400 500 600 700 800 900 1000 0.0 0.5 1.0 1.5 2.0 R efl ect ance val ue Wavelength (nm) Non-Infect-Leaf Infect-Leaf (a) 400 500 600 700 800 900 1000 0.0 0.5 1.0 1.5 2.0 (b) Re flect ance va lu e Wavelength (nm) Non-Infect-Branch Infect-Branch
Fig. 4. Reflection curve of leaf (a) and branch (b) according to the FB infection of pear tree. Note that severe noise from 747-765 nm and 899-921 nm were removed
Actual Value
True False
Predicted Value
Positive True Positive (TP) + False Positive (FP) 0
Negative False Negative (FN) True Negative (TN)
to respond to vegetation growth. The difference in the characteristic of reflectance between healthy and infected vegetation showed a significantly low reflection value in infected leaves and branches of pear trees compared to those of healthy trees.
A total of 214 images of infected leaves, 34 images of non-infected leaves, 33 images of infected branches, and 50 images of non-infected branches were applied for DT analysis depending on the several conditions of ratio with the number of training and testing samples (Table 3).
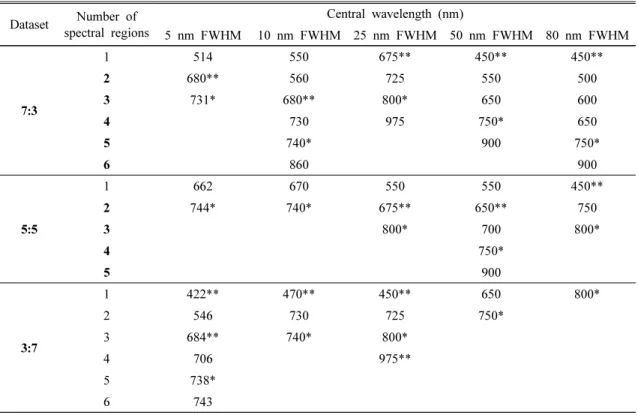
In all ratios of the original condition (5 nm of FWHM), at least one band was selected in each of Red (662 nm, 680 nm, and 684 nm) and RE (706 nm, 731 nm, 738 nm, 743 nm, and 744 nm) regions. Approximately 65% of the selected bands for all the conditions existed in Red and RE regions. Moreover, 740 nm, 750 nm, and 800 nm were selected as the important bands for classifying healthy and infected leaves, because those bands were selected first, regardless of any ratio conditions and FWHMs (Table 4, asterisks). Regardless of the conditions of the ratio
Variety Number of training samples Number of test samples
7:3 5:5 3:7 7:3 5:5 3:7
Leaf Infect 150 107 64 64 107 150
Non-infect 24 17 10 10 17 24
Branch Infect 17 12 6 6 11 17
Non-infect 35 25 15 15 25 35
Table 3. Numbers of training samples and test samples for classifying FB infection and non-infection
Dataset spectral regionsNumber of Central wavelength (nm)
5 nm FWHM 10 nm FWHM 25 nm FWHM 50 nm FWHM 80 nm FWHM 7:3 1 514 550 675** 450** 450** 2 680** 560 725 550 500 3 731* 680** 800* 650 600 4 730 975 750* 650 5 740* 900 750* 6 860 900 5:5 1 662 670 550 550 450** 2 744* 740* 675** 650** 750 3 800* 700 800* 4 750* 5 900 3:7 1 422** 470** 450** 650 800* 2 546 730 725 750* 3 684** 740* 800* 4 706 975** 5 738* 6 743
* first node, ** second node
with training and testing samples, the selected bands with the common in all conditions were 740 nm with 10 nm of FWHM, 800 nm with 25 nm of FWHM, and 650 nm and 750 nm with 50 nm of FWHM. However, there was no band with the common in all conditions with 80 nm of FWHM.
FWHM. However, there was no band with the common in all conditions with 80 nm of FWHM.
It is possible to classify the infected leaves with 95.5% for OA and 88.9% of KC using the selected bands with 25 nm of FWHM based on the 7:3 ratio of training and testing samples. When the ratio of training and testing samples is 7:3, the classification accuracies such as OA and KC are higher than the other ratio with training and testing samples, except KC of 7:3 with the original condition (5 nm) FWHM as 66.6% (Fig. 5). In the case of KC, the highest value was 70.5% with the condition of 5:5 and 3:7 ratios. KC decreased compared with OA because it considers the cases of misclassifications in OA. Therefore, the accuracy of KC was adopted as a standard measure of classification accuracy in some circumstances even if there was argued (Smits et al., 1999).
When the results from Tables 4 and 5 were compared to each other, the difference in the accuracy of KC depended on the selection of moisture- sensitive bands, such as 975 nm (Pu et al., 2016). When the leaves and branches in pear trees were infected by FB, they were gradually withering.
The recalculated classification accuracy was higher than or equal to the original classification accuracy (Fig. 6). There was a difference in the improvement of accuracy between OA and KC. The accuracy of OA was better than KC because OA may have been allocated to the correct class purely by chance, while KC was accommodating the effects of chance agreement (Foody., 2002). Thus, the improvement of KC was better than that of OA. However, the value for KC at a ratio of 3:7 with 5 nm of FWHM improved only by 2%, but for the other conditions increased more than 18% on average. In the case of 7:3 with 50 nm of FWHM, the KC value was 75.4% (Fig. 5) and the modified KC value was 100% (Fig. 6). This suggests that all misidentified leaves were determined to be infected by FB even if they were healthy. Thus, any other leaves that were infected by FB were not determined to be non-infected leaves.
1 2 3 4 5 0 20 40 60 80 100 48.8 57.0 76.679.2 83.2 91.0 59.560.2 75.4 82.6 83.9 91.0 70.5 69.6 88.9 87.9 87.3 95.5 60.7 59.2 76.6 84.184.6 91.0 68.7 59.0 66.6 86.0 83.9
7:3(OA) 5:5(OA) 3:7(OA) 7:3(KC) 5:5(KC) 3:7(KC)
Classification accuracy (%) Fu ll width at half max imum (FW HM ) 80nm 50nm 25nm 10nm 5nm 87.6
Fig. 5. Classification accuracy for the infection of pear tree leaves for each FWHM using selected peak wavelength.
In addition, the ratio of training and testing samples might play an important role in classification performance because the accuracy of OA and KC had a tendency to decrease when the number of training samples decreased.
In the case of the original condition (5 nm of FWHM), one band was selected in the RE region (730 nm, 737 nm, and 746 nm), regardless of the ratio conditions, and 420 nm was additionally selected in the condition of 7:3 ratios (Table 5). Regardless of any condition of ratio with training and testing samples, moreover, the bands selected as the first node were 740 nm or 770 nm with 10 nm of
FWHM, 800 nm with 25 nm of FWHM, 750 nm with 50 nm of FWHM, and 800 nm with 80 nm of FWHM. When the selected bands between leaves and branches were compared to each other, the infected branches were more simply classified using only one or two bands, regardless of any commercial FWHM. In addition, the first nodes used to identify whether leaves and branches are infected or not in pear orchards for the classifier based on the commercial FWHM were 740, 750, and 800 nm. It means those three bands are important bands to classify the infected and non-infected leaves and branches in pear tree or orchards. 1 2 3 4 5 0 20 40 60 80 100 70.6 80.2 93.6 89.493.3 97.8 71.7 78.2 100 88.491.9 100 82.6 80.0 94.3 93.2 91.9 97.8 78.0 85.3 93.6 91.995.3 97.8 70.6 80.7 92.7 87.893.3 97.8
7:3(OA) 5:5(OA) 3:7(OA) 7:3(KC) 5:5(KC) 3:7(KC)
Recalculated classification accuracy (%)
Fu ll w idt h at h al f m axi m um (F W H M ) 80nm 50nm 25nm 10nm 5nm
Fig. 6. Recalculated classification accuracy for the infection of pear tree leaves for each FWHM using selected peak wavelength.
Dataset spectral regionsNumber of Central wavelength (nm)
5 nm FWHM 10 nm FWHM 25 nm FWHM 50 nm FWHM 80 nm FWHM 7:3 1 420 430 450 450 600 2 730* 770* 800* 750* 800* 5:5 1 746* 740* 800* 750* 800* 2 3:7 1 737* 740* 800* 750* 800* 2
* first node, ** second node
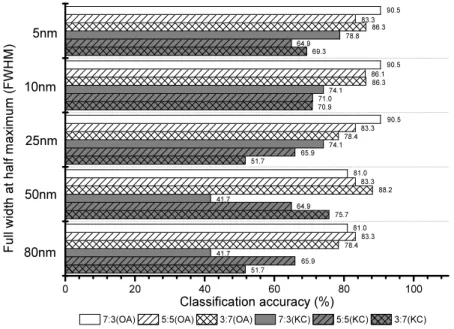
The accuracy of the original condition with 5 nm of FWHM was less than 90.5% for OA and 78.8% for KC (Fig. 7). It means the accuracy of the classifier for branches was less than the leaves when the accuracy in Fig. 5 and 7 were compared to each other.
When the ratio of training and testing samples was 7:3, the classification accuracies were higher than those of the other ratios, except KC of 3:7 with 50 nm of FWHM. Moreover, the classification accuracy of the selected bands with 10 nm of FWHM was the
1 2 3 4 5 0 20 40 60 80 100 51.7 65.9 41.7 78.4 83.3 81.0 75.7 64.9 41.7 88.2 83.3 81.0 51.7 65.9 74.178.4 83.3 90.5 70.971.0 74.1 86.3 86.190.5 69.3 64.9 78.8 86.3 83.3 90.5
7:3(OA) 5:5(OA) 3:7(OA) 7:3(KC) 5:5(KC) 3:7(KC)
Classification accuracy (%) Fu ll w id th a t h al f m ax im um (F W H M ) 80nm 50nm 25nm 10nm 5nm
Fig. 7. Classification accuracy for infection of pear tree branches using a selected peak wavelength. 1 2 3 4 5 0 20 40 60 80 100 18.921.5 41.7 68.6 66.7 81.0 41.8 26.1 41.7 74.5 69.4 81.0 18.921.5 74.1 68.6 66.7 90.5 39.8 34.6 74.1 74.5 72.2 90.5 47.2 26.1 53.3 78.4 69.4 81.0
7:3(OA) 5:5(OA) 3:7(OA) 7:3(KC) 5:5(KC) 3:7(KC)
Recalculated classification accuracy (%)
Full width at half maximum (FWHM ) 80nm 50nm 25nm 10nm 5nm
Fig. 8. Recalculated classification accuracy for infection of pear tree branches using a selected peak wavelength.
highest compared to any other condition of ratios, except KC of 3:7 with 50 nm of FWHM.
When the classification accuracies of classifier for leaves and branches were compared to each other, the performance of classifier for leaves was better than those of branches. One of the reasons might be an insufficient number of the samples for branches compared with the number of samples for leaves (Table 3). In addition, there was a difference in the number of selected bands as the classifier between leaves and branches.
The recalculated accuracy was equal to the probability except that it was determined that the branches were not infected by FB even though they were (Fig. 8). Generally, the improvement of KC is better than that of OA (as mentioned in Fig. 6). In the case of the 7:3 ratio, regardless of any conditions of commercial FWHM, there was no improvement in both OA and KC. This means that there were no branches misidentified as infected braches, even if they were not infected. However, with the exception of the 7:3 ratio, OA and KC increased more than 12% and 35%, respectively, suggesting that recalculation was effective for all other ratios and the conditions of FWHM. In the case of leaf analysis, the ratio of training and testing samples played an important role in classification performance but it did not show any effectiveness for branch analysis, which may have been influenced by the difference in the number of samples (Table 3).
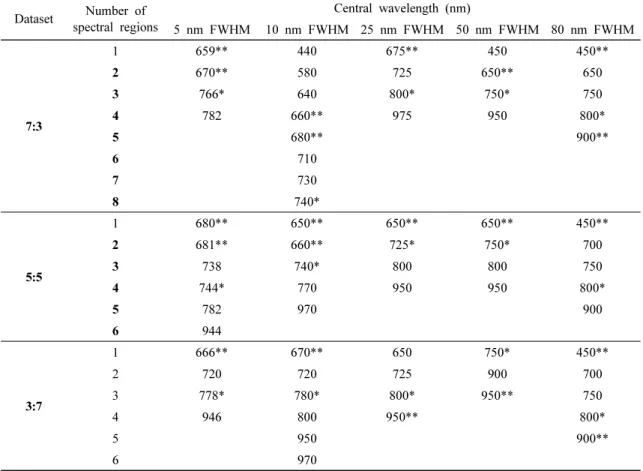
Because leaves and branches coexist in natural environments, the possibility of classification is considered when the infection of leaves and branches is in the same image (Table 6). In the case of the original condition (5 nm of FWHM), the selected bands as the first node were mainly in the RE region (744 nm, 766 nm, and 778 nm), regardless of the ratio conditions, and the selected bands as the second node existed in the Red regions (659 nm, 666 nm, 670 nm, 680 nm, 681 nm). Wavelengths of 740 nm or 780 nm and 725 nm or 800 nm were selected as the first node, with 10 nm or 25 nm of FWHM, respectively. In the case of 50 nm and 80 nm of
FWHM, 750 nm and 800 nm were selected as the first node respectively, regardless of any condition of ratio with training and testing samples. In the narrower 5 nm or 10 nm of FWHM, adjacent bands with similar reflectance were selected. With pruning to avoid overfitting in the decision tree, other bands were not selected because the adjacent bands show sufficient classification accuracy to detect FB. However, it is disadvantageous for various uses in agriculture other than FB. Therefore, if sufficient classification accuracy is shown, a broader FWHM (25, 50 and 80 nm) in which bands in various wavelength ranges are selected may be advantageous with a variety of use in agriculture.
The bands selected as the first node were 750 nm and 800 nm to identify whether the infection of leaves and branches when the results in Tables 4, 5 and 6 were compared to each other. This suggests that those two bands were important to classify the infected and non-infected leaves and branches in pear tree orchards.
The accuracy of the original condition with 5 nm of FWHM was more than 91 .9% for OA and 82.8% for KC, except the condition of the 3:7 ratio. The accuracy of classifier was the highest with 10 nm of FWHM regardless of any condition of FWHM, and it was also the highest with the 7:3 ratio regardless of any condition of FWHM (Fig. 9).
When the accuracy of classifier was compared among Figures 5, 7, and 9, the highest accuracy with the original condition (5 nm) and 10 nm of FWHM was in the data of all (leaves and branches) and it with 25 nm of FWHM was in the data of leaves, regardless of any condition of ratio. In the other conditions, the highest accuracy did not show a tendency but the highest accuracy was in the data of all or leaves.
The accuracy of the original condition with 5 nm of FWHM was more than 94.1 % for OA and 87.3% for KC regardless of any condition of ratio. The accuracy of classifier was the highest with 10 nm of FWHM except for 5:5 ratio and it was also the highest with 7:3 ratio regardless of any condition of
FWHM (Fig. 10). When the accuracy of the classifier was compared among Figures 6, 8, and 10, the highest accuracy was shown in the data of all (leaves and branches) and leaves. This may have been influenced by the number of samples and it for branches was just one-sixth of it for leaves. When the accuracy was considered as an important factor, the multispectral image sensor to classify the infection of FB for leaves and branches in pear orchard was set up with the selected eight bands: 440 nm, 580 nm, 640 nm, 660 nm, 680 nm, 710 nm, 730 nm, and 740 nm, with 10 nm of FWHM. However, 450 nm, 650 nm, 750 nm, and 950 nm with 50 nm of FWHM were more acceptable as the multispectral image sensor when the number of bands and the accuracy of classifier were considered together for
real application for UAV forecasting system. The difference in the accuracy between the eight bands and four bands multispectral image sensors was only 1.8% for OA and 4.1% for KC, respectively. In previous study, when using hyperspectral image sensor with UAV, red and NIR with 5 nm of FWHM were selected for the detection of FB in pear trees similarly to the 5 nm of FWHM in this study. (Schoofs et al., 2020). Therefore, if the hyperspectral data acquired by UAV are merged into 50 nm of FWHM, it may be similar to the four bands selected in this study. In addition, the suggested four bands with 550 nm and 800 nm might be more useful when the multispectral image sensor was composed with the combination of even bands because the added bands were normally selected as the important bands
Dataset spectral regionsNumber of Central wavelength (nm)
5 nm FWHM 10 nm FWHM 25 nm FWHM 50 nm FWHM 80 nm FWHM 7:3 1 659** 440 675** 450 450** 2 670** 580 725 650** 650 3 766* 640 800* 750* 750 4 782 660** 975 950 800* 5 680** 900** 6 710 7 730 8 740* 5:5 1 680** 650** 650** 650** 450** 2 681** 660** 725* 750* 700 3 738 740* 800 800 750 4 744* 770 950 950 800* 5 782 970 900 6 944 3:7 1 666** 670** 650 750* 450** 2 720 720 725 900 700 3 778* 780* 800* 950** 750 4 946 800 950** 800* 5 950 900** 6 970
* First node, ** Second node
Table 6. Peak wavelength selected for infection classification of leaves and branches of pear tree for each FWHM using DT
to estimate the vegetation growth (Kimura et al., 2004; Trilla et al., 2016).
Therefore, the combination of 450 nm (Blue), 550 nm (Green), 650 nm (Red), 750 nm (RE), 800 nm (NIR) and 950 nm (NIR with sensitive water) may
serve as a new type of multispectral image sensor, not only to classify the infection of FB, but also to monitor the growth of pear tree and other vegetation growth of crops (Ray et al., 2011; Ray et al., 2010; Yue et al., 2017). Moreover, it is necessary to
1 2 3 4 5 0 20 40 60 80 100 62.864.8 68.4 83.0 83.285.6 69.8 64.7 78.2 85.7 83.8 90.1 66.7 64.0 78.4 84.5 83.8 90.1 73.6 71.0 81.9 87.6 86.5 91.9 68.7 82.8 84.786.1 91.992.8
7:3(OA) 5:5(OA) Classification accuracy (%) 3:7(OA) 7:3(KC) 5:5(KC) 3:7(KC)
Fu ll w id th a t h al f m axi m um (F W H M ) 80nm 50nm 25nm 10nm 5nm
Fig. 9. Classification accuracy for infection of leaves and branches of pear tree for each FWHM using the selected peak wavelength.
1 2 3 4 5 0 20 40 60 80 100 81.2 76.7 85.3 91.9 89.293.7 79.282.5 91.7 90.392.4 96.4 81.085.6 89.891.5 94.195.5 93.1 83.3 95.8 92.2 92.4 98.2 89.6 87.388.4 95.7 94.194.6
7:3(OA) 5:5(OA) 3:7(OA) 7:3(KC) 5:5(KC) 3:7(KC)
Recalculated classification accuracy (%)
Fu ll w id th a t h al f m ax im um (F W H M ) 80nm 50nm 25nm 10nm 5nm
Fig. 10. Recalculated classification accuracy for infection of leaves and branches of pear tree for each FWHM using the selected peak wavelength.
compare the reflectance characteristics among similar infections, such as stem cankers and black shoot blight; then, a reflectance library must be created for each type of infections to enhance classification among the various infection types (Apan et al., 2004; Kumar et al., 2012). It is also necessary to track the progress of infection from the initial symptoms leading up to the death of a tree (Suarez et al., 2016) using an artificial cultivation facility, with the condition of biosafety level 3, because the infected images can get after the confirmation as FB. To reduce imbalance in light, we applied the Savitzky-Golay technique to this study. Compared with the classification accuracy of the original spectral data, it decreased approximately 1-3%. Due to these findings, we have not exploited the Savitzky-Golay technique. In this study, we analyzed the image acquired through the flank of a tree using a hyperspectral sensor because there is a limitation of the system to take a top view image. In recent, however, there are new approaches with hypersp- ectral image sensors mounted on UAV to take an image with a top view in order to measure and identify the physical, chemical, biological and biochemical characteristics of crops and vegetables (Zarco et al., 2012; Holasek et al., 2017). Therefore, the UAV system with a hyperspectral image sensor might be a powerful tool in the field of remote sensing and is expected to be easily applied not only in agriculture but also in various fields such as forest, calamity, and defense. In addition, PCA, ANOVA and CNN algorithms may be useful to classify whether the pear trees are infected by FB based on characterizing the feature importance.
IV. Conclusions
Fire Blight (FB) is a contagious pear and apple tree, infected trees wither and die and cannot be grown for 20 years. In this study, the possibility of discriminating FB infection investigated by hypers- pectral reflectance. The hyperspectral reflectance of FB infected and uninfected leaves and branches were
acquired with a 5 nm full width at high maximum (FWHM) and then it was standardized to 10 nm, 25 nm, 50 nm, and 80 nm FWHM. The standardized samples were divided into training and test sets at ratios of 7: 3, 5: 5 and 3: 7 to find the optimal bands selected by the decision tree analysis and then the classification accuracy was evaluated using overall accuracy (OA) and kappa coefficient (KC).
The hyperspectral reflectance of infected leaves and branches were significantly lower than it of healthy at the green, RE and NIR regions. The ratio of 7:3 for training and test samples was showed the best performance as the classifier except for a few cases. Regardless of any conditions of FWHM and training and test sample ratios, the bands selected as the first node were 750 nm and 800 nm and then the highest accuracy was in the data of all (leaf and branch) with 5 nm of FWHM and it of leaves with 25 nm of FWHM. Even if a multispectral sensor consists of eight bands (440 nm, 580 nm, 640 nm, 660 nm, 680 nm, 710 nm, 730 nm, and 740 nm) with 10 nm of FWHM is accurate but it consisted of four bands with 50 nm of FWHM (450 nm, 650 nm, 750 nm, and 950 nm). The accuracy was 95% for OA, 90% for KC and the difference in the accuracy between 8 bands and 4 bands multispectral image sensors was 1.8% for OA and 4.1% for KC, respectively. Finally, two additional bands (550 nm and 800 nm with 25 nm of FWHM) have been proposed to improve the usability of multispectral image sensors. It is possible to save time and labor for predicting the infection of FB in a wide range of areas as quickly and accurately using UAV with the developed multispectral sensor with 6 bands such as 450 nm, 550 nm, 650 nm, 750 nm, 800 nm and 950 nm.
적 요
화상병이란 erwinia amylovora라는 강한 전염성을 보유하고 있어 감염 시 1년 내에 과수를 고사시키며 그 중심으로 반경 500m이내에 과수 재배를 불가능하 게 만드는 세균성 바이러스이다. 이 화상병은 과수의잎과 가지를 진한 갈색 또는 검은색으로 변색시키기 때문에 분광학적으로 검출이 가능하다고 판단되며 이 는 다중분광센서를 탑재한 무인기를 이용하는 것이 효 율적이다. 그러나 다중분광센서는 적은 중심 파장과 함께 넓은 반치전폭(FWHM)을 가지고 있어 화상병에 가장 민감하게 반응하는 파장 대역을 파악하기 어렵 다. 그렇기 때문에, 본 논문에서는 화상병에 감염된 잎과 가지와 비감염된 잎과 가지의 초분광 이미지를 5 nm FWHM으로 취득한 후 각각 10 nm, 25 nm, 50 nm와 80 nm FWHM로 평준화한 후 샘플을 7:3, 5:5와 3:7의 비율로 훈련데이터와 검증데이터로 나누 어 의사결정트리 기법으로 최적의 파장을 선정하고 overall accuracy (OA)와 kappa coefficient (KC)를 이 용한 분류 정확도 평가를 통해 배나무 화상병 검출 가능성을 확인하였다. 화상병에 감염 및 비감염된 잎 과 가지의 초분광 반사율을 비교한 결과, green, red edge 및 NIR 영역에서 차이가 두드러지게 나타났으며 첫 번째 분류 노드로 선택된 파장 영역은 대체로 750 nm와 800 nm였다. 잎과 가지 영역의 영상데이터를 의사결정트리 기법을 이용하여 분류정확도를 종합적 으로 비교한 결과, 50nm FWHM 인 4개 대역(450, 650, 750, 950nm)은 10nm FWHM인 8개 대역(440, 580, 660, 680, 680, 710, 730, 740nm)의 분류 정확도 차이가 OA에서 1.8%와 KC에서 4.1%로 나타나 더 낮은 비용의 밴드패스필터인 50nm FWHM을 이용하 는 것이 더 유리하다고 판단된다. 또한 기존의 50nm FWHM 파장대역들에 25nm FWHM파장대역들(550, 800nm)을 추가하는 것을 통해 화상병 검출뿐만 아니 라 농업에서 다양한 역할을 수행할 수 있는 다중분광 센서를 개발할 수 있다고 판단된다.
REFERENCES
Aćimović, S. G., Q. Zeng, G. C. McGhee, G. W. Sundin, and J. C. Wise, 2015: Control of fire blight (Erwinia amylovora) on apple trees with trunk-injected plant resistance inducers and antibi- otics and assessment of induction of pathogenesis- related protein genes. Frontiers in plant science 6, 16.
Apan, A., A. Held, S. Phinn, and J. Markley, 2004: Detecting sugarcane ‘orange rust’disease using EO- 1 Hyperion hyperspectral imagery. International journal of remote sensing 25(2), 489-498.
Bagheri, N., H. Mohamadi-Monavar, A. Azizi, and
A. Ghasemi, 2018: Detection of Fire Blight disease in pear trees by hyperspectral data. European Journal of Remote Sensing 51(1), 1-10. Bahadou, S. A., A. Ouijja, A. Karfach, A. Tahiri,
and R. Lahlali, 2018: New potential bacterial antagonists for the biocontrol of fire blight disease (Erwinia amylovora) in Morocco. Microbial pathogenesis 117, 7-15.
Berni, J. A. J., P. J. Zarco-Tejada, G. Sepulcre- Cantó, E. Fereres, and F. Villalobos, 2009: Mapping canopy conductance and CWSI in olive orchards using high resolution thermal remote sensing imagery. Remote Sensing of Environment 113(11), 2380-2388.
Breiman, L., J. Friedman, R. Olshen, and C. Stone, 1984: Classification and regression trees–crc press. Boca Raton, Florida.
Buchanan, G. E., and M. P. Starr, 1980: Phytotoxic material from associations betweenErwinia amylovora and pear tissue culture: Possible role in necrotic symptomatology of fireblight disease. Current Microbiology 4(2), 63-68.
Broggini, G. A., B. Duffy, E. Holliger, H. J. Schärer, C. Gessler, and A. Patocchi, 2005: Detection of the fire blight biocontrol agent Bacillus subtilis BD170 (Biopro®) in a Swiss apple orchard. European journal of plant pathology 111(2), 93-100.
Calderón, R., J. A. Navas-Cortés, C. Lucena, and P. J. Zarco-Tejada, 2013: High-resolution airborne hyperspectral and thermal imagery for early detection of Verticillium wilt of olive using fluorescence, temperature and narrow-band spectral indices. Remote Sensing of Environment 139, 231-245.
Chan, J. C. W., and D. Paelinckx, 2008: Evaluation of random forest and adaboost tree-based ensemble classification and spectral band selection for ecotope mapping using airborne hyperspectral imagery. Remote Sensing of Environment 112, 2999-3011.
Deng, X., Q. Liu, Y. Deng, and S. Mahadevan, 2016: An improved method to construct basic probability assignment based on the confusion matrix for classification problem. Information Sciences 340, 250-261.
Du, H., H. Qi, X. Wang, R. Ramanath, and W. E. Snyder, 2003: Band selection using independent component analysis for hyperspectral image processing. In: 32nd Applied Imagery Pattern Recognition Workshop, 2003. Proceedings. IEEE,
93-98.
Foody, G. M., 2002: Status of land cover classification accuracy assessment. Remote sensing of environment 80(1), 185-201.
Friedl, M. A., D. Sulla-Menashe, B. Tan, A. Schneider, N. Ramankutty, A. Sibley, and X. Huang, 2010: MODIS Collection 5 global land cover: Algorithm refinements and characterization of new datasets. Remote sensing of Environment 114, 168-182.
Goel, P. K., S. O. Prasher, R. M. Patel, J. A. Landry, R. B. Bonnell, and A. A. Viau, 2003: Classification of hyperspectral data by decision trees and artificial neural networks to identify weed stress and nitrogen status of corn. Computers and Electronics in Agriculture 39(2), 67-93.
Gusberti, M., U. Klemm, M. S. Meier, M. Maurhofer, and I. Hunger-Glaser, 2015: Fire blight control: the struggle goes on. A comparison of different fire blight control methods in Switzerland with respect to biosafety, efficacy and durability. International journal of environmental research and public health 12(9), 11422-11447.
Hasler, T., H. J. Schaerer, E. Holliger, J. Vogels- anger, A. Vignutelli, and B. Schoch, 2001: Fire blight situation in Switzerland. IX International Workshop on Fire Blight 590, 73-79.
Hinze, M., L. Köhl, S. Kunz, S. Weißhaupt, M. Ernst, A. Schmid, and R. T. Voegele, 2016: Real‐ time PCR detection of Erwinia amylovora on blossoms correlates with subsequent fire blight incidence. Plant Pathology 65(3), 462-469.
Holasek, R., K. Nakanishi, L. Ziph-Schatzberg, J. Santman, P. Woodman, R. Zacaroli, and R. Wiggins, 2017: The selectable hyperspectral airborne remote sensing kit (SHARK) as an enabler for precision agriculture. Hyperspectral Imaging Sensors: Innovative Applications and Sensor Standards 10213, 1021304
Jaillais, B., P. Roumet, L. Pinson-Gadais, and D. Bertrand, 2015: Detection of Fusarium head blight contamination in wheat kernels by multivariate imaging. Food Control 54, 250-258.
Jarolmasjed, S., S. Kostick, Y. Si, J. Quiros, A. Marzougui, K. Evans, and S. Sankaran, 2019: High-Throughput Phenotyping of Fire Blight Disease Symptoms Using Sensing Techniques in Apple. Frontiers in plant science 10, 576.
Jock, S., V. Donat, M. M. López, C. Bazzi, and K. Geider, 2002: Following spread of fire blight in
Western, Central and Southern Europe by molecular differentiation of Erwinia amylovora strains with PFGE analysis. Environmental Microbiology 4(2), 106-114.
Kang, Y. S., C. S. Ryu, S. R. Jun, S. H. Jang, J. W. Park, H. Y. Song, T. K. Sarkar, S. H. Kim, and W. S. Lee, 2018: Distinguishing between closely related species of Allium and of Brassicaceae by narrowband hyperspectral imagery. Biosystems Engineering 176, 103-113.
Kim, W. S., M. Hildebrand, S. Jock, and K. Geider, 2001: Molecular comparison of pathogenic bacteria from pear trees in Japan and the fire blight pathogen Erwinia amylovora. Microbiology 147 (11), 2951-2959.
Kimura, R., S. Okada, H. Miura, and M. Kamichika, 2004: Relationships among the leaf area index, moisture availability, and spectral reflectance in an upland rice field. Agricultural Water Management 69(2), 83-100.
Kumar, A., W. S. Lee, R. J. Ehsani, L. G. Albrigo, C. Yang, and R. L. Mangan, 2012: Citrus greening disease detection using aerial hypers- pectral and multispectral imaging techniques. Journal of Applied Remote Sensing 6(1), 063542. Landis, J. R., and G. G. Koch, 1977: The
measurement of observer agreement for categorical data. Biometrics, 159-174.
Leucker, M., A. K. Mahlein, U. Steiner, and E. C. Oerke, 2015: Improvement of lesion phenotyping in Cercospora beticola–sugar beet interaction by hyperspectral imaging. Phytopathology 106(2), 177- 184.
Li, S., Z. Zheng, Y. Wang, C. Chang, and Y. Yu, 2016: A new hyperspectral band selection and classification framework based on combining multiple classifiers. Pattern Recognition Letters 83, 152-159.
Mahlein, A. K., 2016: Plant disease detection by imaging sensors–parallels and specific demands for precision agriculture and plant phenotyping. Plant disease 100(2), 241-251.
Mahlein, A. K., U. Steiner, C. Hillnhütter, H. W. Dehne, and E. C. Oerke, 2012: Hyperspectral imaging for small-scale analysis of symptoms caused by different sugar beet diseases. Plant methods 8(1), 3.
Marlin, B., K. Swersky, B. Chen, and N. Freitas, 2010: Inductive principles for restricted Boltzmann machine learning. In Proceedings of the Thirteenth International Conference on Artificial Intelligence
and Statistics, 509-516.
Medjahed, S. A., T. A. Saadi, A. Benyettou, and M. Ouali, 2016: Gray wolf optimizer for hyperspectral band selection. Applied Soft Computing 40, 178- 186.
Norelli, J. L., A. L. Jones, and H. S. Aldwinckle, 2003: Fire blight management in the twenty-first century: using new technologies that enhance host resistance in apple. Plant Disease 2003 87(7), 756-765.
Pu, Y. Y., and D. W. Sun, 2016: Prediction of moisture content uniformity of microwave-vacuum dried mangoes as affected by different shapes using NIR hyperspectral imaging. Innovative Food Science & Emerging Technologies 33, 348-356. Qiu, R., C. Yang, A. Moghimi, M. Zhang, and B.
Steffenson, 2019: Detection of Fusarium Head Blight in Wheat Using a Deep Neural Network and Color Imaging. Preprints.
Ray, S. S., N. Jain, R. K. Arora, S. Chavan, and S. Panigrahy, 2011: Utility of hyperspectral data for potato late blight disease detection. Journal of the Indian Society of Remote Sensing 39(2), 161-169. Ray, S. S., J. P. Singh, and S. Panigrahy, 2010: Use
of hyperspectral remote sensing data for crop stress detection: ground-based studies. International Archives of Photogrammetry, Remote Sensing and Spatial Information Science 38(Part 8).
Ryu, C., M. Suguri, and M. Umeda, 2011: Multivariate analysis of nitrogen content for rice at the heading stage using reflectance of airborne hyperspectral remote sensing. Field Crops Resea- rch 122(3), 214-224.
Sarhrouni, E., A. Hammouch, and D. Aboutajdine, 2012: Dimensionality reduction and classification feature using mutual information applied to hyperspectral images: a filter strategy based algorithm. arXiv preprint arXiv :1210.0052. Schoofs, H., S. Delalieux, T. Deckers, and D.
Bylemans, 2020: Fire Blight Monitoring in Pear Orchards by Unmanned Airborne Vehicles (UAV) Systems Carrying Spectral Sensors. Agronomy 10(5), 615.
Smail, A. B., O. U. I. J. J. A. Abderrahman, and T. A. H. I. R. I. Abdessalem, 2016: Evaluation of biological control agent Pantoea agglomerans P10c against fire blight in Morocco. African Journal of Agricultural Research 11(18), 1661-1667.
Smits, P. C., S. G. Dellepiane, and R. A. Schowengerdt, 1999: Quality assessment of image classification algorithms for land-cover mapping: A
review and a proposal for a cost-based approach. International journal of remote sensing 20(8), 1461-1486.
Suarez, L. A., A. Apan, and J. Werth, 2016: Hyperspectral sensing to detect the impact of herbicide drift on cotton growth and yield. ISPRS Journal of Photogrammetry and Remote Sensing 120, 65-76.
Sun, W., L. Zhang, B. Du, W. Li, and Y. M. Lai, 2015: Band selection using improved sparse subspace clustering for hyperspectral imagery classification. IEEE Journal of Selected Topics in Applied Earth Observations and Remote Sensing 8, 2784-2797.
Thomson, S. V., S. C. Gouk, and J. P. Paulin, 1998: Efficacy of BION®(Actigard®) to control fire blight in pear and apple orchards in USA, New Zealand and France. In VIII International Workshop on Fire Blight 489, 589-596.
Tomassen, F. H. M., A. De Koeijer, M. C. M. Mourits, A. Dekker, A. Bouma, and R. B. M. Huirne, 2002: A decision-tree to optimise control measures during the early stage of a foot-and- mouth disease epidemic. Preventive Veterinary Medicine 54(4), 301-324.
Tooke, T. R., N. C. Coops, N. R. Goodwin, and J. A. Voogt, 2009: Extracting urban vegetation characteristics using spectral mixture analysis and decision tree classifications. Remote Sensing of Environment 113(2), 398-407.
Trilla, G. G., P. Pratolongo, P. Kandus, M. E. Beget, C. Di Bella, and J. Marcovecchio, 2016: Relationship between biophysical parameters and synthetic indices derived from hyperspectral field data in a salt marsh from Buenos Aires Province, Argentina. Wetlands 36(1), 185-194.
Van Der Zwet, Tom, and Harry Louis Keil, 1979: Fire blight. US Government Printing Office, 21-26.
Yue, J., G. Yang, C. Li, Z. Li, Y. Wang, H. Feng, and B. Xu, 2017: Estimation of winter wheat above-ground biomass using unmanned aerial vehicle-based snapshot hyperspectral sensor and crop height improved models. Remote Sensing 9(7), 708.
Zarco-Tejada, P. J., V. González-Dugo, and J. A. Berni, 2012: Fluorescence, temperature and narrow- band indices acquired from a UAV platform for water stress detection using a micro-hyperspectral imager and a thermal camera. Remote sensing of environment 117, 322-337.
Zhang, M., Z. Qin, X. Liu, and S. L. Ustin, 2003: Detection of stress in tomatoes induced by late blight disease in California, USA, using hypersp- ectral remote sensing. International Journal of Applied Earth Observation and Geoinformation 4(4), 295-310.
Zhou, R., S. I. Kaneko, F. Tanaka, M. Kayamori, and M. Shimizu, 2015: Image-based field monit- oring of Cercospora leaf spot in sugar beet by robust template matching and pattern recognition. Computers and Electronics in Agriculture 116, 65-79.