162
Background : This study was done to obtain comprehensive data on changes in the structural
components of the enteric nervous system in pediatric patients with intestinal pseudo-obstruc-tion (IPO). We evaluated routinely processed, in formalin-fixed tissues by quantitative morpho-metric analysis. In addition, we used formalin-fixed tissue to explore the possibility of using pre-viously proposed diagnostic criteria to evaluate frozen serial sections for intestinal neuronal dysplasia (IND) type B and hypoganglionosis. Methods : We analyzed data for 19 IPO cases. Morphometric analysis for quantification of ganglia and ganglion cells (GCs) was done for the myentric and the submucous plexus. In addition, we determined the presence of immature GCs and the distribution of nerve fibers and interstitial cells of Cajal (ICC). Results : Nine patients showed combined hypoganglionosis, IND, and decreased ICC; others showed various com-binations of these. Several morphometric factors were significantly different between patient groups as well as being different than the control group. Conclusions : Our pediatric IPO cases showed extensive overlapping of pathological findings. And the findings suggest the utility of using previously proposed morphometrically measured factors in multiple frozen sections as diagnostic criteria for IND type B and hypoganglionosis in formalin-fixed tissue.
Key Words : Intestinal pseudo-obstruction; Morphometric analysis; Quantitative Hyung Kyung Kim∙∙Harin Cheong
Hanna Kang∙∙Ji Yoon Bae Dong Eun Song∙∙Min Sun Cho Sun Hee Sung∙∙Woon Sup Han Heasoo Koo
162
Histopathological Evaluation of Pediatric Intestinal Pseudo-Obstruction:
Quantitative Morphometric Analysis of Pathological Changes in the
Enteric Nervous System
Intestinal pseudo-obstruction (IPO) is characterized by loss of contractility or normal slow waves of the intestinal wall, and has been classified into neuropathic, myopathic, and idiopathic types according to the causative pathological changes. The neu-ropathic type is associated with various abnormalities of the en-teric nervous system (ENS) and has been subclassified as agan-glionosis (Hirschsprung’s disease, HD), intestinal neuronal dys-plasia (IND) types A and B, hypoganglionosis, immaturity of ganglion cells (GCs, nerve cells) and internal anal sphincter neu-rogenic achalasia.1-12 In addition to abnormal findings for GCs, previous studies have documented an association between IPOs and defective innervations of the neuromuscular junction (NMJ) or abnormal distribution of c-kit-positive intestinal pacemaker cells (interstitial cells of Cajal, ICC).13-16
The proper interpretation of pathological changes in the ENS
(intestinal dysganglionosis) is very important for diagnosis and treatment. Compared with a diagnosis of HD based on the ab-sence of GCs, the diagnosis of other neuropathic diseases includ-ing IND and hypoganglionosis has often been controversial due to the lack of definitive diagnostic criteria or the lack of exact reference values based on clearly defined evaluation techniques. In addition, although many pathologists still effectively use hema-toxylin and eosin (H&E) staining for the diagnosis of these dis-eases, most of the well established diagnostic criteria used cur-rently are based on multiple serial sections (more than 30 sec-tions) of fresh frozen tissue with enzymatic histochemistry and immunohistochemical studies, which in practice are hard to per-form as routine procedures in most surgical pathology labora-tories.17-27
Ever since the first description of IND by Meier-Ruge,8there 162
Corresponding Author
Heasoo Koo, M.D.
Department of Pathology, Ewha Womans University School of Medicine, 911-1 Mok 5-dong, Yangcheon-gu, Seoul 158-710, Korea Tel : 02-2650-5732
Fax : 02-2650-2879 E-mail : heasoo@ewha.ac.kr
Department of Pathology, Ewha Medical Research Institute, Ewha Womans University School of Medicine, Seoul, Korea
Received : September 21, 2009 Accepted : October 30, 2009
have been continuous controversies on the existence of this enti-ty as a distinct histopathologic entienti-ty. The characteristic histo-logic features of IND type B include hyperganglionosis of the submucous and myenteric plexuses, giant ganglia, hypogenetic GCs, heterotopic GCs, and increased acetylcholinesterase (AChE) activity in the lamina propria and around submucosal blood ves-sels, as well as lactate dehydrogenase and succinate dehydroge-nase positive reactions in the submucous plexus.1-4,7,9In addition
to many slightly different diagnostic criteria, previous morpho-metric studies have defined the diagnostic criterion of more than four giant ganglia (more than seven or eight GCs per ganglion) in whole submucous plexus if the specimen was not large (less than several centimeter length) or more than 20% of submucos-al ganglia showing giant ones per 30 serisubmucos-al sections counted.
1,4-7,10,17Hypoganglionosis is an entity with a diminished number
of ganglia and GCs in the myenteric plexus, but its existence as a separate clinical disease has been questioned.2,5,12-14Since
knowl-edge of GC density in the normal human ENS is scanty, and since previous reports have shown huge variations in normal density of GCs in myenteric plexus, the diagnosis of hypogan-glionosis or hyperganhypogan-glionosis in myenteric plexus is very diffi-cult. The previously reported density variation of more than 200 fold among different studies could be due to the difference in technical procedures, because the whole-mount preparation tech-nique produces a 3-dimensional picture showing the complex neuronal networks much better than conventional thin sections. In addition, the number of GCs is variable depending on the thickness of the sections as well as on the stain used.2,13,17,21-25
Our study was done to identify underlying pathology in the ENS (number and size of myenteric and submucosal ganglia, number and maturation of GCs, nerve fibers in the intestinal wall, and distribution of ICC) as well as to identify a possible association of myopathy in pediatric patients with IPO. In addi-tion, we evaluated the effectiveness of presently known diagnos-tic criteria and non-obligatory, possibly diagnosdiagnos-tic histopatho-logical findings for identifying IND and hypoganglionosis (which
were proposed to be used in serial frozen sections) in routinely processed formalin-fixed surgical specimens by quantitative mor-phometric analysis using an image analyzer.
MATERIALS AND METHODS
Patients
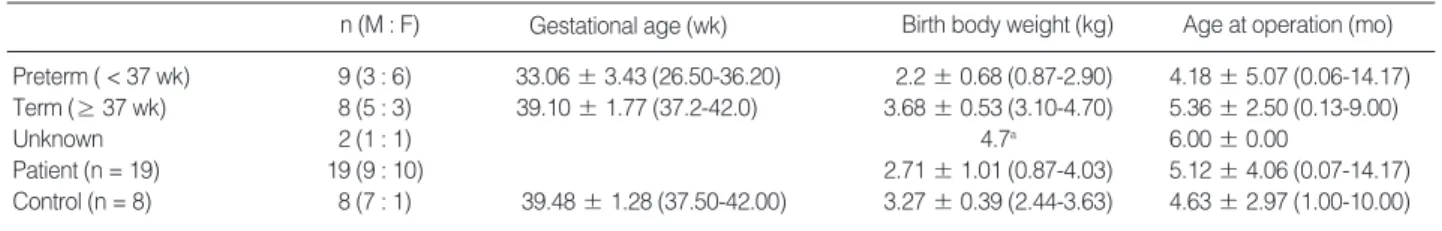
We included in this study 19 pediatric patients with clinical symptoms of IPO who underwent surgical treatment. The pati-ent group consisted of nine male and ten female cases. Sevpati-enteen cases with known gestational age (GA) consisted of nine cases of preterm (less than 37 weeks GA; range, 26.5 to 36.2 weeks; mean, 33.06 ±3.43) and eight cases of term (more than 37 weeks GA; range, 37.2 to 42 weeks; mean, 39.10 ±1.77). As age-matched controls, seven sections of normoganglionic seg-ments of colon and one section of small intestine resected from patients with HD were examined. The diagnosis of HD was con-firmed pathologically by the presence of an aganglionic segment. The eight cases in the control group consisted of seven male cases and one female case. Clinical features of patients and age-mat-ched control cases are summarized in Table 1.
The patients presented with symptoms and signs of IPO such as distended abdomen, decreased bowel sound, and vomiting. In addition to gastrointestinal problems, five preterm patients (GA, 26.5 to 34.3 weeks) were associated with hyaline mem-brane disease and bronchopulmonary dysplasia. Two of the five had persistent ductus arteriosus. Ten of the 19 patients under-went segmental resection such as small bowel segmental resec-tion, colon segmental resecresec-tion, and right hemicolectomy. Four underwent Duhamel’s or a modified Duhamel’s operation accom-panied by colostomy, ileostomy, or segmental resection. Tran-sient stoma formation such as ileostomy, colostomy, and double barrel ileostomy-colostomy were selectively done in the remain-ing six cases. Two preterm babies expired with disseminated
Unknown, two cases with unknown gestational age.
aOne patient with unknown birth weight.
M, male; F, female.
n (M : F) Gestational age (wk) Birth body weight (kg) Age at operation (mo) Preterm ( < 37 wk) 9 (3 : 6) 33.06 ±3.43 (26.50-36.20) 2.2 ±0.68 (0.87-2.90) 4.18 ±5.07 (0.06-14.17) Term (≥ 37 wk) 8 (5 : 3) 39.10 ±1.77 (37.2-42.0) 3.68 ±0.53 (3.10-4.70) 5.36 ±2.50 (0.13-9.00) Unknown 2 (1 : 1) 4.7a 6.00 ±0.00
Patient (n = 19) 19 (9 : 10) 2.71 ±1.01 (0.87-4.03) 5.12 ±4.06 (0.07-14.17) Control (n = 8) 8 (7 : 1) 39.48 ±1.28 (37.50-42.00) 3.27 ±0.39 (2.44-3.63) 4.63 ±2.97 (1.00-10.00)
intravascular coagulation, acute respiratory distress syndrome, and shock-one after three days, the other after two months. Dur-ing follow-up periods of variable duration (one month to seven years), three patients complained of frequent loose stool (4 to 5/ day) or needed an enema. The others have showed good bowel habits after treatment.
Immunohistochemical study
Twenty two sections of surgically resected small and large intes-tine from the 19 patients were evaluated. These included 12 cases of small intestine and 10 cases of large intestine. All specimens were fixed with 10% buffered formalin and processed by routine techniques with 2 to 3 mm thick sectioning and H&E staining. H&E stained slides were used to select one or two representative sections of the lesion. Immunohistochemical staining was done on 3 to 8 mm thick sections of formalin-fixed paraffin-embed-ded tissue by BondTMAutomated Immunohistochemistry (Vision Biosystems, Inc., Mount Waverley, Australia) and bond poly-mer detection system with counterstaining (Vision Biosystems, Inc.). Heat-induced epitope retrieval was carried out to facil-itate staining by immersing the slides in citrate buffer (pH 6.0) and microwaving at 90℃to 100℃for 10 minutes. Sections were incubated with the primary antibodies for 60 minutes at 25℃. Commercial antibodies were obtained and used against neuronal cell adhesion molecule (NCAM, CD56; 1 : 100, mono-clonal, NCL-L-CD56-1B6, Novocastra, Newcastle, UK), neu-ron specific enolase (NSE; 1 : 200, monoclonal, NCL-L-NSE2, Novocastra), synaptophysin (1 : 200, monoclonal, NCL-SYNAP-299, Novocastra), cathepsin D (1 : 400, monoclonal, NCL-CDm, Novocastra), c-kit (CD117; 1 : 400, monoclonal, Dako, Carpin-teria, CA, USA), S-100 protein (S-100; 1 : 400, polyclonal, NCL-L-S100p, Novocastra), alpha smooth muscle actin (SMA; 1 : 400, monoclonal, NCL-SMA, Novocastra) and bcl-2 oncoprotein (bcl-2; 1 : 200, monoclonal, NCL-L-bcl-2, Novocastra). A negative antibody control was obtained by omitting the primary anti-bodies. Two pathologists independently reviewed the H&E and immunohistochemical stained slides and agreed on diagnosis by consensus.
Evaluation of pathological changes
The mature GC was identified by a large cell body with dis-persed chromatin and a prominent nucleolus. If only part of a cell body with the typical cytoplasm was clearly identified, it was also counted. Since the characteristic features of mature GCs
(prominent cytoplasm and nucleoli) were absent in immature GCs, they were confirmed by immunostaining with various neu-ronal markers (cathepsin D and bcl-2) as well as a marker for myenteric glial cells or satellite cells of the submucous plexus (S-100). A ganglion (or nerve plexus) was defined as a group of continuous nerve cell bodies that were not separated by connec-tive tissue and appeared in aggregates of more than three GCs. The ganglia were subclassified as submucosal or myenteric accord-ing to their location. Submucosal giant ganglia were defined as aggregates of more than seven GCs.
Evaluation of myenteric plexus
The myenteric ganglia were evaluated as follows. Two pho-tographs of the myenteric ganglia area were taken at 100× mag-nification by an Olympus BX51 microscope (Tokyo, Japan) and a ProgRes�Capture Pro 2.5 digital camera system (JENOPTIK Laser, Optik, Systeme GmbH, Jena, Germany). The area includ-ed in one photograph was 1.23 mm in length. Total numbers of ganglia and GCs were counted in two photographs and num-bers of ganglia and GCs per mm were calculated (as ganglia/mm and GCs/mm, respectively). In addition, the total plexus area, ganglion length (a virtual line that connects one point of a gan-glion to another point), and gangan-glion distance (the closest inter-val between two ganglia) were measured by image analyzer (JE-NOPTIK Laser, Optik, Systeme GmbH). The plexus area/mm (103×mm2/mm), mean ganglion area (103×mm2), mean gan-glion length (mm), and mean ganglion distance (mm) were cal-culated.
Evaluation of submucous plexus
Submucosal ganglia were evaluated as follows. In formalin-fixed paraffin embedded tissue with H&E staining and in vari-ous immunostains with neuronal markers, ten photographs of the submucosal layer were taken at 200 × magnification by an Olympus BX51 microscope and a digital camera. The area includ-ed in the ten photographs was 2.82 mm2. The number of glia and giant ganglia as well as the total number of GCs in gan-glia were counted in all fields of the ten photographs and a mean GC number (n/ganglion), maximum GC number (n/all ganglia), and the percentage of giant ganglia in the total number of count-ed ganglia (%) were calculatcount-ed. The presence of heterotopic GCs in the proper muscle layer, muscularis mucosa, and lamina pro-pria were evaluated as was the presence of immature GCs, bud-like GCs and anisomorphic GCs.
Evaluation of nerve fiber distribution and ICC
We evaluated nerve fiber distribution in each layer (outer mus-cle layer, inner musmus-cle layer, muscularis mucosa, and lamina propria) for NCAM, NSE, and S-100 immunostained sections. The degree of nerve fiber distribution was recorded as follows: 0, no visible nerve fibers; 1, a few positive fibers; 2, moderate numbers of positive fibers; 3, many positive fibers.
The c-kit positive ICC was evaluated as follows. Compared with normal age-matched controls, c-kit positive reactions were eval-uated in three areas: ICC-MY (myenteric, at the interphase bet-ween myenteric ganglia and adjacent muscle), ICC-IM (intramus-cular, scattered in proper muscle layer), and ICC-SM (submucos-al, superficial plexus on the submucosal surface of the circular mus-cle layer). The grading of positive reactions was recorded as fol-lows: 0, no visible positive reaction; 1, markedly reduced num-bers of positive finum-bers; 2, mildly reduced positive finum-bers; 3, normal.
Evaluation of the muscle layer
The muscle layers (outer longitudinal layer, outer circular and inner circular layer, muscularis mucosa) were evaluated by im-munostaining with SMA antibody. Compared with the positive reaction in the submucosal vascular wall, the grading of positive reactions was recorded as follows: 1, markedly reduced positive reaction; 2, mildly reduced positive reaction; 3, normal.
Statistical analysis
Determination of statistical significance was done using SP-SS ver. 12 (SPSP-SS Inc., Chicago, IL, USA). A nonparametic two-independent samples test (Mann-Whitney U test) was used. A p-value of less than 0.05 was regarded as statistically signifi-cant.
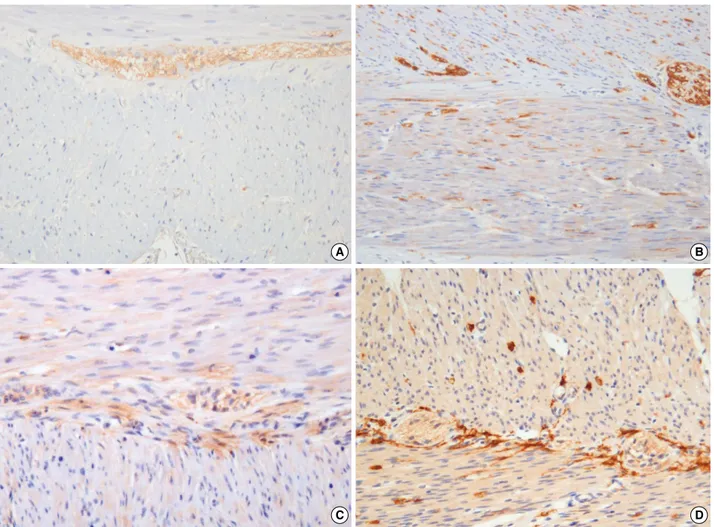
Fig. 1. Hypoganglionosis of myenteric plexus. Lower and high magnification (A, B) of a hypoganglionosis case (3.25 nerve cells/mm) shows a markedly decreased number and size of myenteric ganglia (at nine days after birth, gestational age [GA] 31.4 wk) compared with a con-trol case (at five months after birth, GA 39 wk) (C, D) (immunostaining with neuronal cell adhesion molecule antibody).
A B
RESULTS
Analysis of myenteric plexus and evaluation of diagnostic criteria for hypoganglionosis
The number, size (area), and distribution of myenteric gan-glia as well as the size, maturation, and numbers of GCs in myen-teric ganglia were clearly identified by H&E staining and im-munostaining with various antibodies (Fig. 1). With previous-ly used diagnostic criterion of hypoganglionosis (less than 10 GCs/mm in myenteric plexus), 12 of 22 sections (54.6%) were compatible with hypoganglionosis; findings were compared with the results from other analysis factors (Table 2). The difference in GCs/mm between the two patient groups (hypoganglionosis group and non-hypoganglionosis group) was statistically signifi-cant. The evaluation of various other diagnostic criteria for hypo-ganglionosis showed significant differences in plexus area/mm and mean inter-ganglionic distance of myenteric plexus between the two patient groups as well as between the hypoganglionosis group and the control group (all eight sections of control cases) (Table 2). Mean ganglion area showed a remarkable but not a significant difference between the two patient groups (p = 0.056) while there was a significant difference between the hypogan-glionosis group and the control group (p = 0.039).
When 10 sections of colon from patients were compared with controls (seven sections of colon), plexus area/mm showed a sig-nificant difference between the two patient groups (15.37±2.49 vs 20.35±27.35, p = 0.038) as well as between the hypoganglio-nosis group and the control group (15.37±2.49 vs 25.43±7.53, p = 0.008). Mean inter-ganglionic distance in the hypogangliono-sis group was significantly greater than that in the control group
(153.01±46.96 vs 90.77±3 6.07, p = 0.035), although the two patient groups were not significantly different (153.01 ±
46.96 vs 136.74 ±29.54, p = 0.914). When 12 sections of small intestine from patients were compared with controls (all eight sections of control cases), plexus area/mm and mean inter-ganglion-ic distance of myenterinter-ganglion-ic plexus were signifinter-ganglion-icantly different bet-ween the two patient groups (10.76±3.58 vs 19.26±6.70, p = 0.004 and 207.72 ±65.76 vs 126.06 ±72.56, p = 0.015,
a< 10 vs ≥10 nerve cells/mm group; b< 10 nerve cells/mm group vs control group.
GC, ganglion cell.
No. of myenteric plexus GCs < 10/mm (n = 12) ≥10/mm (n = 10) p-valuea Control (n = 8) p-valueb
Age at operation (mo) 5.03 ±3.82 (0.06-11.00) 5.24 ±4.53 (0.10-14.16) 0.872 5.24 ±4.54 (0.10-14.17) 0.851 Ganglia/mm (n) 3.15 ±0.65 (2.03-4.47) 3.86 ±0.99 (1.62-8.13) 0.722 3.86 ±1.21 (1.63-5.69) 0.070 GCs/mm (n) 6.57 ±1.79 (3.25-8.95) 14.31 ±3.05 (10.98-20.74) 0.000 14.08 ±2.40 (10.17-17.89) 0.000 Plexus area 13.08 ±3.78 (4.74-18.37) 19.69 ±2.71 (13.98-23.80) 0.000 26.81 ±8.00 (18.02-36.21) 0.001
(103 × mm2)/mm
Mean ganglion area 4.16 ±1.09 (2.33-5.66) 6.13 ±2.65 (2.33-11.67) 0.056 8.33 ±5.44 (3.17-19.68) 0.039 (103 × mm2)
Mean ganglion length 148.42 ±37.46 (92.17-205.24) 154.77 ±88.43 (57.38-333.06) 0.742 183.95 ±116.14 (84.19-435.59) 0.851 (mm)
Mean ganglion distance 180.37 ±65.52 (107.18-312.80) 130.33 ±24.44 (103.16-168.03) 0.041 93.72 ±34.42 (51.12-151.81) 0.001 (mm)
Table 2. Quantitative morphometric analysis of myenteric plexus in patients with intestinal pseudo-obstruction according to the num-ber of ganglion cells in myenteric ganglia
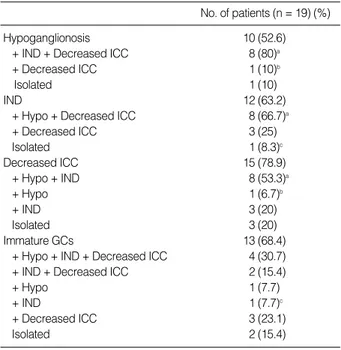
No. of patients (n = 19) (%) Hypoganglionosis 10 (52.6)
+ IND + Decreased ICC 8 (80)a
+ Decreased ICC 1 (10)b
Isolated 1 (10)
IND 12 (63.2)
+ Hypo + Decreased ICC 8 (66.7)a
+ Decreased ICC 3 (25) Isolated 1 (8.3)c Decreased ICC 15 (78.9) + Hypo + IND 8 (53.3)a + Hypo 1 (6.7)b + IND 3 (20) Isolated 3 (20) Immature GCs 13 (68.4) + Hypo + IND + Decreased ICC 4 (30.7) + IND + Decreased ICC 2 (15.4)
+ Hypo 1 (7.7)
+ IND 1 (7.7)c
+ Decreased ICC 3 (23.1)
Isolated 2 (15.4)
aIncluding one case with two sections showing same findings; b
Includ-ing one case with two sections showInclud-ing partly different findInclud-ings; cOne
patient with two consecutive biopsies showing immature GCs and IND on first biopsy and nonspecific findings on second biopsy.
IND, intestinal neuronal dysplasia; ICC, interstitial cells of Cajal; Hypo, hypoganglionosis.
respectively) as well as between the hypoganglionosis group and the control group (10.76 ±3.58 vs 26.81 ±8.00, p = 0.001 and 207.72±65.76 vs 93.72±34.42, p = 0.005, respective-ly). Mean ganglion area in the hypoganglionosis group was sig-nificantly different from the control group (3.36 ± 0.72 vs 8.33
±5.44, p = 0.013), although the two patient groups were not significantly different (3.36 ±0.72 vs 5.13 ±2.13, p = 0.310). Nine of 12 sections with hypoganglionosis (75%) also showed obligatory criteria of IND (more than 20% of submucosal gan-glia were giant ones) as well as a decreased number of ICC com-pared with age-matched control sections (Table 3). An additional two sections (16.7%) also showed decreased ICC and only one section (8.3%) of 12 showed isolated hypoganglionosis.
Analysis of the submucous plexus and evaluation of diagnostic criteria for IND
The number of submucosal ganglia as well as number, size,
and maturation of GCs in submucosal ganglia were clearly iden-tified by H&E staining and immunostaining with various anti-bodies (Fig. 2). When previously known obligatory diagnostic criterion of IND was used (more than 20% of ganglia in the sub-mucous plexus are giant ones because all the sections were larg-er than sevlarg-eral centimetlarg-er in length), 13 of 22 sections (59.1%) were compatible with IND. These findings were compared with results from evaluation of various diagnostic criteria for IND (Table 4). Statistical analysis showed a significant difference bet-ween the two patient groups (IND and non-IND groups). In addition, number of giant ganglia, mean GC number, and max-imum GC number also showed significant differences between the two patient groups as well as between the IND group and the control group (six sections of colon and one section of small intestine). Total GC number showed a remarkable but not a sig-nificant difference between the two patient groups (p = 0.06), compared with a significant difference between the IND group and the control group (p = 0.030).
Fig. 2. Giant ganglia in submucous plexus. An intestinal neuronal dysplasia case with markedly increased numbers of giant ganglia (36.4%) (at six months three weeks after birth, gestational age [GA] 37.5 wk) (A) compared with a control case with 14.3% of giant ganglia (at three months after birth, GA 35.2 wk) (B) (Immunostaining with neuronal cell adhesion molecule antibody).
A B
aGiant ganglia/ganglia < 20% vs ≥20%; bGiant ganglia/ganglia ≥20% vs control group.
GC, ganglion cell. Giant ganglia/total numbers
of counted ganglia (%) ≥ 20% (n = 13) < 20% (n = 9) p-value
a Control (n = 7) p-valueb
Age at operation (mo) 1.69 ±0.49 (1.10-2.35) 2.04 ±0.59 (1.10-3.00) 0.292 3.86 ±2.19 (1.00-7.00) 0.877 Submucosa ganglia 24.23 ±9.19 (4-14) 21.78 ±5.17 (17-29) 0.601 20.00 ±5.03 (15-29) 0.275 Number of giant ganglia 7.77 ±3.00 (4-14) 2.89 ±1.27 (1-5) 0.000 2.57 ±1.13 (1-4) 0.000 Giant ganglia/ganglia (%) 32.51 ±7.05 (24.00-47.37) 13.03 ±4.12 (5.88-17.65) 0.000 12.95 ±5.20 (5.88-20.00) 0.000 Total GC number 141.69 ±48.77 (70-254) 107.78 ±37.44 (70-190) 0.060 96.71 ±23.86 (72-143) 0.030 Mean GC number 5.94 ±0.73 (4.80-7.74) 4.88 ±0.67 (4.12-6.55) 0.002 4.85 ±0.25 (4.33-5.06) 0.002 Maximum GC number 16.15 ±6.09 (9-27) 10.67 ±4.42 (7-22) 0.004 10.71 ±4.15 (7-17) 0.037
Table 4. Quantitative morphometric analysis of submucous plexus in patients with intestinal pseudo-obstruction according to the percentage of giant ganglia in relation to total number of counted ganglia
When ten sections of colon from patients were compared with control (six sections of colon), number and percentage of giant ganglia, and mean GC number showed significant differences between the two patient groups as well as between the IND group and the control group (p < 0.01). When 12 sections of small intes-tine from patients were compared with control (six sections of colon and one section of small intestine), the two patient groups showed a significant difference in the number and percentage of giant ganglia and maximum GC number (p = 0.003, p = 0.048, respectively). The IND group showed a significant dif-ference from control group in number and percentage of giant ganglia, total GC number, and mean GC number (p = 0.001, p = 0.002, and p = 0.011, respectively).
Nine of 13 sections (69.2%) from IND cases were combined with hypoganglionosis and decreased ICC (Table 3). An addi-tional three sections (23.1%) were associated with decreased ICC and only one section (7.7%) showed isolated IND findings.
Analysis of other histopathological findings
Statistical analysis of the nerve fiber distribution in the outer muscle layer, inner muscle layer, muscularis mucosa, and lami-na propria by NCAM immunostaining according to the num-bers of myenteric GCs (hypoganglionosis vs non-hypogangliono-sis groups) showed significantly decreased positive nerve fibers in the hypoganglionosis group compared with the control group only in the outer longitudinal muscle layer (1.2±0.42 vs 1.9±
0.74, p = 0.022) (Fig. 3A, B). The outer longitudinal muscle layer also showed a significantly lower positive NCAM reaction in the IND group compared with the control group (1.23 ±0.44 vs 1.9±0.74, p = 0.026). In addition, NSE immunostaining sho-wed a significantly lower positive reaction in the hypogangli-onosis group compared with the non-hypoganglihypogangli-onosis group only in the lamina propria (1.5±0.85 vs 2.23±0.79, p = 0.022). Compared with NCAM and NSE, S-100
immunos-Fig. 3. Expression of neuronal cell adhesion molecule (NCAM) positive nerve fibers and c-kit positive interstitial cells of Cajal-myenteric (ICC-MY). A few NCAM positive fibers (1+) of the outer muscle layer (A) compared with many positive fibers (3+) (B); Markedly decreased c-kit positive ICC-MY in the same case as Fig. 1A (C) compared with a case with a normal positive reaction (at eight months after birth, gestation-al age 34.3 wk) (D).
A B
taining did not show a significant difference in positive fibers between hypoganglionosis vs non-hypoganglionosis groups as well as between IND vs non-IND groups.
The c-kit positive ICC distribution in ICC-MY, ICC-IM, and ICC-SM showed decreased ICC in 17 of 22 sections (77.3%) (Fig. 3C, D). In addition to nine of 17 (52.9%) with hypogan-glionosis and IND, three of 17 (17.6%) and two of 17 (11.8%) showed findings of IND and hypoganglionosis, respectively (Table 3). The c-kit positive ICC distributions were compared between hypoganglionosis and non-hypoganglionosis groups as well as between IND and non-IND groups (Table 5). There were no significant differences between patient groups (hypogan-glionosis vs non-hypoganglinosis groups or IND vs non-IND groups).
In comparison with colon sections showing a similar positive reaction to SMA antibody in outer and inner circular muscle layers, the small intestine sections showed a weak positive reac-tion in the outer circular muscle layer compared with the inner circular muscle layer. The positive reactions of the muscle lay-ers after SMA immunostaining are summarized according to hypoganglionosis vs non-hypoganglionosis groups as well as IND vs non-IND groups (Table 5). The distribution of SMA positive reactions was not different between patient groups.
The previously designated, non-obligatory criteria for IND type B such as the presence of heterotopic GCs in the proper muscle layer, muscularis mucosa, and lamina propria, bud-like GCs and anisomorphic GCs did not show a significant differ-ence between hypoganglionosis vs non-hypoganglionosis groups or between IND vs non-IND groups. Immature GCs were noted in 13 of 22 sections (59.1%) and most of them (11 cases, 84.6%) were combined with other abnormalities (Table 3).
DISCUSSION
Since the identification of immature GCs is very important for diagnosis of intestinal dysganglionosis in pediatric patients with IPO, the characteristic features of immature GCs should be recognized in H&E stained sections, especially to achieve an adequate intraoperative pathological evaluation of the extent of disease and avoid postoperative complications. Many previous studies identified useful antibodies for immature GCs such as antibodies against PGP 9.5, peripherin, NADPH, bcl-2, cathep-sin D, glial cell line-derived neurotrophic factor, or type 1 bone morphogenetic protein receptor in coordination with antibod-ies specific for satellite cells of the submucosal ganglia and enter-ic glia of the myenterenter-ic ganglia.2,7,10,11,17,19The present study also
showed well-documented immature GCs by cathepsin D and bcl-2 antibodies. For GC counting, NSE and PGP9.5 are less suitable because they stain not only the cell bodies but also the axonal processes. Recently, cuprolinic blue stain has been pro-posed as the method that stains the largest number of GCs com-pared with other antibodies.24Furthermore, it is easy to
distin-guish the individual cells because it stains only neuronal cell bodies and not axons.
For the correct diagnosis of intestinal dysganglionosis (IND type B, hypoganglionosis, or immaturity of GCs), many studies have been done to find the best method for evaluation of ganglia and GCs in myenteric and submucous plexus as well as for changes in GCs and for reference control data according to patient age and lesion location.20,25,26Since there are considerable differences
in the number of ganglia and GCs in the ENS according to loca-tion and other factors, the localoca-tion of the biopsy site as well as cutting direction and thickness of the section are important for quantitative analysis of nerve plexuses.
Two obligatory criteria (hyperplasia of the submucous plexus
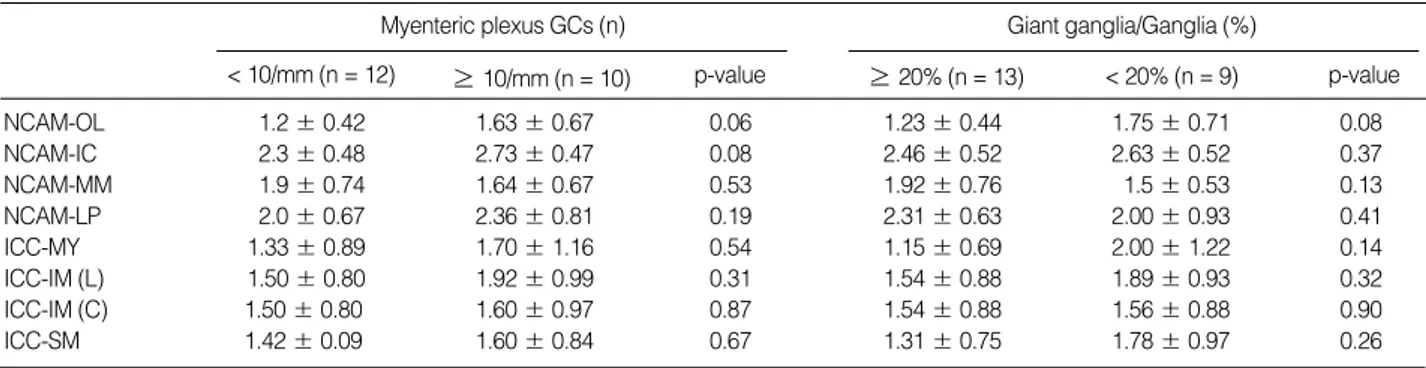
NCAM, neuron cell adhesion molecule (CD56); ICC, interstitial cells of Cajal; GC, ganglion cell; OL, outer longitudinal; IC, inner circular; MM, muscularis mucosa; LP, lamina propria; MY, myenteric; IM (L), intramuscular (longitudinal); IM (C), intramuscular (circular); SM, superficial plexus on submucosal surface of circular muscle layer.
Myenteric plexus GCs (n) Giant ganglia/Ganglia (%)
< 10/mm (n = 12) ≥10/mm (n = 10) p-value ≥20% (n = 13) < 20% (n = 9) p-value
Table 5. Expression of NCAM and c-kit positive ICC in patient groups
NCAM-OL 1.2 ±0.42 1.63 ±0.67 0.06 1.23 ±0.44 1.75 ±0.71 0.08 NCAM-IC 2.3 ±0.48 2.73 ±0.47 0.08 2.46 ±0.52 2.63 ±0.52 0.37 NCAM-MM 1.9 ±0.74 1.64 ±0.67 0.53 1.92 ±0.76 1.5 ±0.53 0.13 NCAM-LP 2.0 ±0.67 2.36 ±0.81 0.19 2.31 ±0.63 2.00 ±0.93 0.41 ICC-MY 1.33 ±0.89 1.70 ±1.16 0.54 1.15 ±0.69 2.00 ±1.22 0.14 ICC-IM (L) 1.50 ±0.80 1.92 ±0.99 0.31 1.54 ±0.88 1.89 ±0.93 0.32 ICC-IM (C) 1.50 ±0.80 1.60 ±0.97 0.87 1.54 ±0.88 1.56 ±0.88 0.90 ICC-SM 1.42 ±0.09 1.60 ±0.84 0.67 1.31 ±0.75 1.78 ±0.97 0.26
and an increase in AChE-positive nerve fibers around submucosal blood vessels) and two additional criteria (neuronal heterotopias and increased AChE activity in the lamina propria) were propos-ed for the diagnosis of IND type B. Even though the giant gan-glia and other findings have been known to be characteristic histopathological features and important diagnostic criteria for IND type B for a long period, there have been continuous sug-gestions and reports suggesting that those pathologic changes might be parts of normal developmental changes or secondary phenomena associated with congenital obstruction, inflamma-tory disease or other causes.2,3,6Recently, hyperganglionosis and
giant ganglia have been accepted as the most important features for the diagnosis of IND in suction rectal biopsies, except in ne-wborns, where hyperganglionosis is a normal finding.24,25
There have been controversies on the definition of hyperplasia of submucosal ganglia or the number of giant ganglia required for the diagnosis of IND. A recently proposed requirement was that more than 15% to 20% of all ganglia should be giant ones on 30 serial sections to fulfill the criteria for diagnosis of IND.
1,4,5,7,10,17In our study, the diagnosis of IND was made using the
same diagnostic criteria (more than 20% of submucosal gan-glia are giant ones), which was modified in formalin-fixed thin sections. Thirteen of 22 sections (59.1%) were compatible with IND. In addition to the percentage of giant ganglia, the mean number and variability range of giant ganglia showed a distinc-tion with no or minimal overlapping between the IND group and the control group (7.77 ±3.00 vs 2.57 ±1.13 and 4 to 14 vs 1 to 4, respectively, p = 0.000). In contrast, the mean and maximum GC numbers also showed a significant difference bet-ween the two patient groups as well as betbet-ween IND and control groups, but there was a large range and overlapping between groups, which reduced their diagnostic significance (Table 4). These findings were similar to findings of previous studies, although the analytic procedures as well as the sites of the biopsies were different.17The difference in results of statistical
analysis depending on location (colon or small intestine) of the lesion and control sections noted in this study suggests the importance of proper age- and location-matched reference values. Although the characteristic histopathological features of IND include hyperganglionosis and giant ganglia in the myenteric plexus, our study showed combined hypoganglionosis of the myenteric plexus in nine sections (69.2%). Similar findings were reported in previous studies.5,9
Hypoganglionosis has been considered to be characterized by a diminished number of ganglia and GCs in myenteric plexus. It has been reported as an isolated colon disease or as a
HD-asso-ciated malformation.7,12,15The examination of large amounts of
full thickness biopsies or segmentally resected surgical specimens are mandatory for the diagnosis of hypoganglionosis, because the density and size of ganglia in myenteric plexus are variable according to intestinal luminal distension and patient age.3,5,12
In addition, the proper control data for diagnosis are not avail-able in most cases. Meier-Rugeet al.13proposed less than two ganglia/mm of myenteric plexus and/or less than ten GCs/mm of myenteric plexus as diagnostic criteria for hypoganglionosis.14 A previous study on caudocranial coiled and cryocut specimens with HD and on proximal areas of hypoganglionosis and dysga-nglionic hypoganglionosis by Meier-Ruge and Brunner14showed that the most characteristic parameters of a hypoganglionosis were a decrease in mean ganglion cross-sectional area and the number of GCs per mm colon in myenteric plexus. The mean number and variability range of GCs per mm colon in dysgan-glionic hypoganglionosis part were significantly lower than in the normally innervated colon segment (7.4 ±2.1 vs 14.5 ±
3.3 and 5 to 9 vs 11 to 18 GCs, respectively). In addition, HD-associated hypoganglionosis of myenteric plexus was character-ized by a significant decrease in mean ganglion cross-sectional area (-56.2%) and plexus area per mm colon (-53.5%) with an increase in inter-ganglionic distance (+20%).
Hypoganglionosis was diagnosed depending on reduced num-bers of myenteric GCs (less than 10 GCs/mm) in this study and 12 of 22 sections (54.5%) were compatible with hypogangliono-sis. The mean number and range of GCs per mm in the hypogan-glionosis group did not overlap with the control group (6.57
±1.79 vs 14.08 ±2.40 and 3.25 to 8.95 vs 10.17 to 17.89 GCs, respectively). Although plexus area/mm and mean gan-glionic distance also showed significant differences between the groups, the large range and the overlapping between groups reduced their diagnostic significance (Table 2). The hypogan-glionosis of myenteric plexus could not be properly diagnosed by the numbers of ganglia in this study, which was similar to previous studies.13,14And the difference in results of statistical analysis of findings in myenteric plexus depending on location of lesion and control sections noted in this study also suggests the importance of proper age- and location-matched reference values.
Although c-kit positive ICC fibers were decreased in 17 of 22 sections (77.3%) in this study, the findings did not show a sig-nificant relationship associated with the presence or absence of hypoganglionosis or IND. Previous studies showed a loss of c-kit positive ICC in association with motility disorders of the bowel such as secondary IPO (IND, scleroderma, meconium
ileus, eosinophilic enteritis) as well as mechanical obstruction (carcinoma, Crohn’s disease with stricture).3,10,16,23A case with
congenital ICC hyperplasia with IND was also reported.24
Immaturity of GCs was noted in 13 of 22 sections (59.1%) and most of them (11 sections) also had other histopathological findings. Six of them were premature (GA, 27.4 to 35.6 weeks) and biopsies were done during between 3 days and 4 months after birth. Seven of them were born at 37.2 to 42 weeks GA and biop-sies were done during between day 4 and month 9. Immature GCs belong to a variant of HD and are usually seen in biopsy results from premature infants presenting with IPO.3,5,6The
exten-sive overlapping of histopathological findings of various diseases in cases with pediatric IPO suggests the possibility of a common pathogenesis of these diseases.5-7,10,22,27
The decreased NCAM positive nerve fibers of the outer mus-cle layer in association with hypoganglionosis as well as the IND noted in this study suggest an abnormality in the NMJ in those diseases, which was also reported in previous studies.3,22,27The
significance of the localization of a decreased reaction in the outer muscle layer is uncertain in this study and further studies with more cases should be helpful. Although the significance of a dec-reased SMA positive reaction is uncertain, the decdec-reased SMA positive reaction in patients with IPO has been associated with various muscle diseases.3,10,27A myopathic type of IPO showed
a fatal clinical course.
In conclusion, pediatric IPO cases show extensive overlapping of pathological findings. The present study suggests the possibility of using the same analytic method for the diagnosis of IND type B and hypoganglionosis in formalin-fixed specimens. For the prac-tical use of these methods for the diagnosis of IPO cases in forma-lin-fixed tissue, proper age, sex, and location-matched reference values based on clearly defined analytic techniques are mandatory.
REFERENCES
1. Meier-Ruge WA, Ammann K, Bruder E, et al. Updated results on intestinal neuronal dysplasia (IND B). Eur J Pediatr Surg 2004; 14: 384-91.
2. Puri P. Intestinal neuronal dysplasia. Semin Pediatr Surg 2003; 12: 259-64.
3. Puri P, Rolle U. Variant Hirschsprung’s disease. Semin Pediatr Surg 2004; 13: 293-9.
4. Skába R, Frantlová M, Horák J. Intestinal neuronal dysplasia. Eur J Gastroenterol Hepatol 2006; 18: 699-701.
5. Seo JK. Intestinal neuronal dysplasia. Korean J Gastroenterol 2007;
50: 145-56.
6. Kapur RP. Neuronal dysplasia: a controversial pathological corre-late of intestinal pseudo-obstruction. Am J Med Genet A 2003; 122: 287-93.
7. Martucciello G, Pini Prato A, Puri P, et al. Controversies concerning diagnostic guidelines for anomalies of the enteric nervous system: a report from the fourth International Symposium on Hirschsprung’s disease and related neurocristopathies. J Pediatr Surg 2005; 40: 1527-31.
8. Meier-Ruge W. Casuistic of colon disorder with symptoms of Hir-schsprung’s disease (author’s transl). Verh Dtsch Ges Pathol 1971; 55: 506-10.
9. Kobayashi H, Hirakawa H, Surana R, O’Briain DS, Puri P. Intesti-nal neuroIntesti-nal dysplasia is a possible cause of persistent bowel sym-ptoms after pull-through operation for Hirschsprung’s disease. J Pediatr Surg 1995; 30: 253-7.
10. Park SH, Min H, Chi JG, Park KW, Yang HR, Seo JK. Immunohis-tochemical studies of pediatric intestinal pseudo-obstruction: bcl2, a valuable biomarker to detect immature enteric ganglion cells. Am J Surg Pathol 2005; 29: 1017-24.
11. Koo H, Choi KJ. Analysis of histopathological findings of Hirsch-sprung’s disease: immunohistochemical studies including GDNF and cathepsin D. Ewha Med J 2003; 26: 7-14.
12. Taguchi T, Masumoto K, Ieiri S, Nakatsuji T, Akiyoshi J. New clas-sification of hypoganglionosis: congenital and acquired hypogan-glionosis. J Pediatr Surg 2006; 41: 2046-51.
13. Meier-Ruge WA, Brunner LA, Engert J, et al. A correlative morpho-metric and clinical investigation of hypoganglionosis of the colon in children. Eur J Pediatr Surg 1999; 9: 67-74.
14. Meier-Ruge WA, Brunner LA. Morphometric assessment of Hirsch-sprung’s disease: associated hypoganglionosis of the colonic myen-teric plexus. Pediatr Dev Pathol 2001; 4: 53-61.
15. Wedel T, Roblick UJ, Ott V, et al. Oligoneuronal hypoganglionosis in patients with idiopathic slow-transit constipation. Dis Colon Rectum 2002; 45: 54-62.
16. Yamataka A, Ohshiro K, Kobayashi H, et al. Abnormal distribution of intestinal pacemaker (C-KIT-positive) cells in an infant with chronic idiopathic intestinal pseudoobstruction. J Pediatr Surg 1998; 33: 859-62.
17. Yom CK, Koo H, Choi KJ. Idiopathic intestinal pseudo-obstruction in infants surgically treated: findings to help diagnose intestinal neuronal dysplasia and the significance of surgical treatment. J Korean Surg Soc 2008; 74: 299-306.
18. Smith VV. Intestinal neuronal density in childhood: a baseline for the objective assessment of hypo- and hyperganglionosis. Pediatr Pathol 1993; 13: 225-37.
19. Brewer KC, Mwizerva O, Goldstein AM. BMPRIA is a promising marker for evaluating ganglion cells in the enteric nervous system: a pilot study. Hum Pathol 2005; 36: 1120-6.
20. Coerdt W, Michel JS, Rippin G, et al. Quantitative morphometric analysis of the submucous plexus in age-related control groups. Virchows Arch 2004; 444: 239-46.
21. Montedonico S, Piotrowska AP, Rolle U, Puri P. Histochemical stain-ing of rectal suction biopsies as the first investigation in patients with chronic constipation. Pediatr Surg Int 2008; 24: 785-92. 22. Nogueira A, Campos M, Soares-Oliveira M, et al. Histochemical
and immunohistochemical study of the intrinsic innervation in colonic dysganglionosis. Pediatr Surg Int 2001; 17: 144-51. 23. Jain D, Moussa K, Tandon M, Culpepper-Morgan J, Proctor DD.
Role of interstitial cells of Cajal in motility disorders of the bowel.
Am J Gastroenterol 2003; 98: 618-24.
24. Jeng YM, Mao TL, Hsu WM, Huang SF, Hsu HC. Congenital inter-stitial cell of cajal hyperplasia with neuronal intestinal dysplasia. Am J Surg Pathol 2000; 24: 1568-72.
25. Wester T, O’Briain S, Puri P. Morphometric aspects of the submu-cous plexus in whole-mount preparations of normal human distal colon. J Pediatr Surg 1998; 33: 619-22.
26. Wilder-Smith CH, Talbot IC, Merki HS, Meier-Ruge WA. Morpho-metric quantification of normal submucous plexus in the distal rec-tum of adult healthy volunteers. Eur J Gastroenterol Hepatol 2002; 14: 1339-42.
27. Park HJ, Kamm MA, Abbasi AM, Talbot IC. Immunohistochemical study of the colonic muscle and innervation in idiopathic chronic constipation. Dis Colon Rectum 1995; 38: 509-13.
![Fig. 1. Hypoganglionosis of myenteric plexus. Lower and high magnification (A, B) of a hypoganglionosis case (3.25 nerve cells/mm) shows a markedly decreased number and size of myenteric ganglia (at nine days after birth, gestational age [GA] 31.4 wk) comp](https://thumb-ap.123doks.com/thumbv2/123dokinfo/5109528.82386/4.892.91.807.511.1035/hypoganglionosis-myenteric-magnification-hypoganglionosis-markedly-decreased-myenteric-gestational.webp)
![Fig. 2. Giant ganglia in submucous plexus. An intestinal neuronal dysplasia case with markedly increased numbers of giant ganglia (36.4%) (at six months three weeks after birth, gestational age [GA] 37.5 wk) (A) compared with a control case with 14.3% of g](https://thumb-ap.123doks.com/thumbv2/123dokinfo/5109528.82386/6.892.93.806.532.775/submucous-intestinal-neuronal-dysplasia-markedly-increased-gestational-compared.webp)