Background and Purpose There is an increasing rate of presentations by transient and adult patients (TAPs) to pediatric emergency departments (PED-EDs). TAPs with neurologic diseases (N-TAPs) comprise most of these patients. We investigated this trend and compared the char-acteristics of N-TAPs with those of pediatric patients with neurologic diseases (N-PEDs) who pre-sented to the PED-ED of a tertiary-care hospital in Korea.
Methods We reviewed the medical records of neurologic patients who presented to the PED-ED of a single tertiary-care hospital from 2013 to 2017. We included patients with neurologic symptoms or diseases and those who were treated in the pediatric neurology department and underwent neurologic evaluations and treatment in the PED-ED.
Results Presentations by N-TAPs to the PED-ED increased over time, whereas the number of N-PEDs gradually decreased, with a significant difference between the groups (p<0.001). The number of TAPs who presented to the PED-ED almost tripled from 2013 to 2017. N-TAPs had significantly more acute symptoms than N-PEDs, and a significantly higher propor-tion of N-TAPs were insured by Medical Aid compared to N-PEDs (p<0.001). The admission rate was significantly higher (p<0.001) and the mean hospital stay was longer (p=0.046) for N-TAPs. Epilepsy and neurometabolic diseases were mainly responsible for the increased pre-sentations by N-TAPs.
Conclusions We have clarified the status of N-TAPs in the PED-ER and the role of pediatric neurologists who manage them. Multidisciplinary treatments focusing on the role of pediatric neu-rologists should be developed to that systematic long-term care plans are applied to N-TAPs. Key Words transient, pediatrics, adult, emergency department, neurologic patient,
pediatric neurology.
Transient and Adult Patients with Neurologic Diseases
in the Pediatric Emergency Department:
Trends and Characteristics
INTRODUCTION
Pediatric emergency departments (PED-EDs) are mainly visited by pediatric patients young-er than 18 years who have a variety of ailments. Howevyoung-er, at tyoung-ertiary medical institutions where subspecialties are well established, transient patients (age, 18–21 years) and adult patients (older than 21 years) often also present to the PED-ED.1,2 Most of these patients
are diagnosed with chronic refractory pediatric diseases during childhood and so have of-ten received treatment in pediatric departments.1-3 Transient and adult patients (TAPs)
pres-ent to the PED-ED because they are accustomed to receiving treatmpres-ent for their long-term diseases that developed during childhood in such a department.4 Because these patients are
older than 18 years, it would seem that they should be treated in the adult emergency depart-ment instead. However, because they wish to continue receiving care in a familiar setting, Ji-Hoon Naa
Young-Mock Leea,b a Department of Pediatrics,
Yonsei University College of Medicine, Seoul, Korea
b Epilepsy Research Institute, Yonsei University College of Medicine, Seoul, Korea
pISSN 1738-6586 / eISSN 2005-5013 / J Clin Neurol 2019;15(2):191-204 / https://doi.org/10.3988/jcn.2019.15.2.191
Received November 5, 2018 Revised November 25, 2018 Accepted November 26, 2018 Correspondence Young-Mock Lee, MD, PhD Department of Pediatrics,
Yonsei University College of Medicine, 211 Eonju-ro, Gangnam-gu, Seoul 06273, Korea Tel +82-2-2019-3354 Fax +82-2-2019-4881 E-mail [email protected]
cc This is an Open Access article distributed under the terms of the Creative Commons Attribution Non-Com-mercial License (https://creativecommons.org/licenses/by-nc/4.0) which permits unrestricted non-comNon-Com-mercial use, distribution, and reproduction in any medium, provided the original work is properly cited.
Transient Neurologic Patients in the ED
JCN
TAPs with refractory pediatric diseases often present to the PED-ED in emergency situations.5-8
The proportion of TAPs examined in pediatric departments is particularly high in the neurology, hematology-oncology, cardiology, and genetics areas.9 This is due to many diseases
being first treated in these departments during childhood, and the clinical progression of these diseases tends to be chron-ic and complex.9-11 Additionally, because these diseases
be-gin during childhood, continuing developmental and emo-tional interventions by medical staff in these departments are important for TAPs and should be maintained even after they become older.1,2,12 Disease etiologies are often genetic in
the pediatric neurologic area, and the course of these diseases can significantly impact their outcomes. TAPs with neurolog-ic diseases (N-TAPs) often present to the PED-ED, and so pe-diatric neurologists need to be prepared to treat them.10
Some studies have investigated TAPs presenting to the PED-ED, but they have produced few data.2,3 Furthermore,
epidemiologic studies of N-TAPs presenting to PED-EDs are even less common.1,5,6 Pediatric neurologists need to
un-derstand the characteristics of N-TAPs in order to be able to provide them with the best medical management. We in-vestigated the characteristics of N-TAPs and pediatric patients with neurologic diseases (N-PEDs) who presented to the PED-ED of a tertiary-care hospital in Korea.
METHODS
Inclusion of patients and data collection
This was a retrospective study conducted using data from the PED-ED of a single tertiary-care center (Gangnam Severance Hospital). We reviewed the medical records of 34,439 patients who presented to the PED-ED from 2013 to 2017. We then selected patients with neurologic symptoms and those who had been treated in the pediatric neurology department and subsequently underwent neurologic evaluations and treat-ment in the PED-ED. This study enrolled 2,315 patients, with patients younger than 18 years categorized as N-PEDs and those 18 years or older categorized as N-TAPs. This study was approved by the Institutional Review Board of Gangnam Sev-eranceHospital, and all study participants provided informed consent (approval no. 3-2017-0263).
Study design: subgroup analyses
The primary goal of this study was to compare N-TAPs and PEDs. We analyzed certain subgroups of TAPs and N-PEDs and made comparisons between admitted and dis-charged N-TAPs and N-PEDs in order to identify the patient characteristics associated with hospitalizations and discharges.
Demographics and variables used in the analysis
The medical records of N-TAPs and N-PEDs were exam-ined carefully. Patient demographics and variables such as age, sex, time of presentation (year), route of entry to the PED-ED, main symptom, severity level, main diagnosis at the time of the presentation, hospitalization status, and insurance status were identified. We used the Korean Triage and Acuity Scale (KTAS) to quantify the severity levels of the patients.13Tri-age severity was defined by the following KTAS scores: 1) need for resuscitation, 2) emergency, 3) urgent, 4) less urgent, and 5) nonurgent. We classified the patients into two groups (neu-rologic and systemic) based on the diagnosis that was most relevant to their health status at the time of presenting to the PED-ED. There are several types of health-care insurance in South Korea, including the National Health Insurance Service, which covers almost the entire population, and Med-ical Aid, which is a public assistance program for poor or physically disabled individuals.14,15 We therefore also
inves-tigated the distribution of medical insurance types among the neurologic patients who presented to the PED-ED.
Statistical analysis
All analyses were performed using SPSS (version 20.0, IBM Corp., Armonk, NY, USA). The descriptive statistics includ-ed means, standard deviations, minclud-edians, and ranges. The chi-square test, Fisher’s exact test, and parametric t tests were used to evaluate differences between groups, with p<0.05 consid-ered statistically significant.
RESULTS
Clinical characteristics of neurologic patients who
presented to the PED-ED
Table 1 presents the clinical characteristics of the 2,315 neu-rologic patients who presented to the PED-ED from 2013 to 2017. Patients aged 2 to 5 years accounted for the largest pro-portion (32.9%), and N-TAPs accounted for 2.4% of all pa-tients. The median age of the patients was 5 years (range, birth to 41 years). The sex ratio was 58.1:41.9 (males:females). The total number of patients who presented to the PED-ED during the 5-year observation period decreased over time. Direct presentations were the most frequent method of entry to the PED-ED (90.0%). Febrile seizures, headaches, and afe-brile seizures were the main symptoms (80.8%) for all pa-tients. The most-frequent severity level was grade 3 (n=1,713, 74.0%), and the severity levels of the patients conformed to a normal distribution.
The neurologic diagnosis group (n=1,801, 77.8%) com-prised patients with febrile seizures (n=605, 26.1%), men-ingitis (n=550, 23.8%), epilepsy (n=393, 17.0%), and other
Na JH et al.
JCN
symptoms. Upper respiratory infections (n=193, 8.3%), low-er respiratory infections (n=99, 4.3%), acute gastroentlow-eritis/ ileus/intussusception (n=88, 3.8%), and sepsis (n=50, 2.2%) were the main diagnoses for those in the systemic diagnosis group (n=514, 22.2%). The hospitalization rate for patients who presented to the PED-ED was 49.5%, and most of them were insured by the National Health Insurance Service (n= 2,199, 95.0%).
Characteristics of neurologic patients in the PED-ED:
admission and discharge
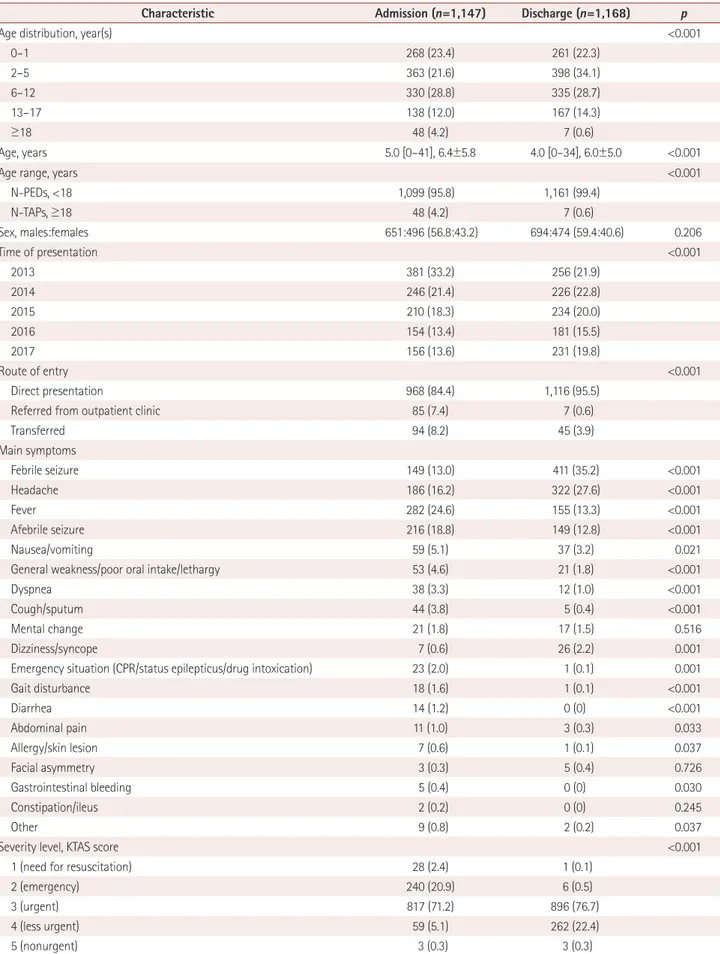
Of all the patients, 1,147 were hospitalized and 1,168 were dis-charged (Table 2). The annual age distribution differed sig-nificantly between the admission and discharge groups (p< 0.001). N-TAPs were represented more in the admission group. The annual decrease in the number of patients was
sig-Table 1. Clinical characteristics of neurologic patients who presented to the PED-ED from 2013 to 2017
Characteristic Total (n=2,315)
Age distribution, year(s)
0–1 529 (22.9) 2–5 761 (32.9) 6–12 665 (28.7) 13–17 305 (13.1) ≥18 55 (2.4) Age, years 5.0 [0–41], 10.8±9.9
Age range, years
N-PEDs, <18 2,260 (97.6) N-TAPs, ≥18 55 (2.4) Sex, males:females 1,345:970 (58.1:41.9) Time of presentation 2013 637 (27.5) 2014 512 (22.1) 2015 444 (19.2) 2016 335 (14.5) 2017 387 (16.7) Route of entry Direct presentation 2,084 (90.0)
Referred from outpatient clinic 92 (4.0)
Transferred 139 (6.3) Main symptom(s) Febrile seizure 560 (24.2) Headache 508 (21.9) Fever 437 (18.9) Afebrile seizure 365 (15.8) Nausea/vomiting 96 (4.1)
General weakness/poor oral intake/lethargy 74 (3.2)
Dyspnea 50 (2.2)
Cough/sputum 49 (2.1)
Mental change 38 (1.6)
Dizziness/syncope 33 (1.4)
Emergency situation
(CPR/status epilepticus/drug intoxication) 24 (1.0)
Gait disturbance 19 (0.8) Diarrhea 14 (0.6) Abdominal pain 14 (0.6) Allergy/skin lesion 8 (0.3) Facial asymmetry 8 (0.3) Gastrointestinal bleeding 5 (0.2) Constipation/ileus 2 (0.1) Other 11 (0.5)
Severity level, KTAS score
1 (need for resuscitation) 29 (1.3)
2 (emergency) 246 (10.6)
3 (urgent) 1,713 (74.0)
4 (less urgent) 321 (13.9)
Table 1. Clinical characteristics of neurologic patients who presented to the PED-ED from 2013 to 2017 (continued)
Characteristic Total (n=2,315)
5 (nonurgent) 6 (0.3)
Main diagnosis
Neurologic diagnosis group 1,801 (77.8)
Epilepsy 393 (17.0) Febrile seizure 605 (26.1) Meningitis 550 (23.8) Encephalitis 34 (1.5) Migraine 66 (2.9) Metabolic encephalopathy 127 (5.5) Myopathy 15 (0.6) Peripheral neuropathy 11 (0.5)
Systemic diagnosis group 514 (22.2)
Sepsis 50 (2.2)
Lower respiratory infection 99 (4.3) Upper respiratory infection 193 (8.3)
Viral infection 25 (1.1) Acute bronchitis/bronchiolitis/asthma/ croup 20 (0.9) Acute gastroenteritis/ileus/intussusception 88 (3.8) Urticaria 9 (0.4) Other 30 (1.3) Admission 1,147 (49.5) Insurance
National Health Insurance Service 2,199 (95.0)
Medical Aid program 99 (4.3)
International health insurance 9 (0.4)
Other 8 (0.3)
Data are n (%), mean±standard-deviation, or median [range] values. CPR: cardiopulmonary resuscitation, KTAS: Korean Triage and Acuity Scale, N-PEDs: pediatric patients with neurologic diseases, N-TAPs: tran-sient and adult patients with neurologic diseases, PED-ED: pediatric emer-gency department.
Transient Neurologic Patients in the ED
JCN
Table 2. Comparison of clinical characteristics between admitted and discharged neurologic patients presenting to the PED-ED
Characteristic Admission (n=1,147) Discharge (n=1,168) p
Age distribution, year(s) <0.001
0–1 268 (23.4) 261 (22.3) 2–5 363 (21.6) 398 (34.1) 6–12 330 (28.8) 335 (28.7) 13–17 138 (12.0) 167 (14.3) ≥18 48 (4.2) 7 (0.6) Age, years 5.0 [0–41], 6.4±5.8 4.0 [0–34], 6.0±5.0 <0.001
Age range, years <0.001
N-PEDs, <18 1,099 (95.8) 1,161 (99.4) N-TAPs, ≥18 48 (4.2) 7 (0.6) Sex, males:females 651:496 (56.8:43.2) 694:474 (59.4:40.6) 0.206 Time of presentation <0.001 2013 381 (33.2) 256 (21.9) 2014 246 (21.4) 226 (22.8) 2015 210 (18.3) 234 (20.0) 2016 154 (13.4) 181 (15.5) 2017 156 (13.6) 231 (19.8) Route of entry <0.001 Direct presentation 968 (84.4) 1,116 (95.5)
Referred from outpatient clinic 85 (7.4) 7 (0.6)
Transferred 94 (8.2) 45 (3.9) Main symptoms Febrile seizure 149 (13.0) 411 (35.2) <0.001 Headache 186 (16.2) 322 (27.6) <0.001 Fever 282 (24.6) 155 (13.3) <0.001 Afebrile seizure 216 (18.8) 149 (12.8) <0.001 Nausea/vomiting 59 (5.1) 37 (3.2) 0.021
General weakness/poor oral intake/lethargy 53 (4.6) 21 (1.8) <0.001
Dyspnea 38 (3.3) 12 (1.0) <0.001
Cough/sputum 44 (3.8) 5 (0.4) <0.001
Mental change 21 (1.8) 17 (1.5) 0.516
Dizziness/syncope 7 (0.6) 26 (2.2) 0.001
Emergency situation (CPR/status epilepticus/drug intoxication) 23 (2.0) 1 (0.1) 0.001
Gait disturbance 18 (1.6) 1 (0.1) <0.001 Diarrhea 14 (1.2) 0 (0) <0.001 Abdominal pain 11 (1.0) 3 (0.3) 0.033 Allergy/skin lesion 7 (0.6) 1 (0.1) 0.037 Facial asymmetry 3 (0.3) 5 (0.4) 0.726 Gastrointestinal bleeding 5 (0.4) 0 (0) 0.030 Constipation/ileus 2 (0.2) 0 (0) 0.245 Other 9 (0.8) 2 (0.2) 0.037
Severity level, KTAS score <0.001
1 (need for resuscitation) 28 (2.4) 1 (0.1)
2 (emergency) 240 (20.9) 6 (0.5)
3 (urgent) 817 (71.2) 896 (76.7)
4 (less urgent) 59 (5.1) 262 (22.4)
Na JH et al.
JCN
nificantly larger in the admission group than in the discharge group (p<0.001). The distribution of the route of entry to the PED-ED differed significantly between the admission and discharge groups, with more patients referred from outpatient clinics or transferred from other locations in the admission group. The main symptoms also differed significantly be-tween the two groups, with severity levels of 1 (need for re-suscitation) and 2 (emergency) being significantly more com-mon in the admission group than in the discharge group. A systemic diagnosis as the primary diagnosis was also signifi-cantly more common in the admission group than in the dis-charge group (31.6% vs. 12.9%, p<0.001). The proportion of patients who received insurance through the Medical Aid program was significantly higher in the admission group than in the discharge group (p<0.001).
Characteristics of neurologic patients in the PED-ED:
N-TAPs and N-PEDs
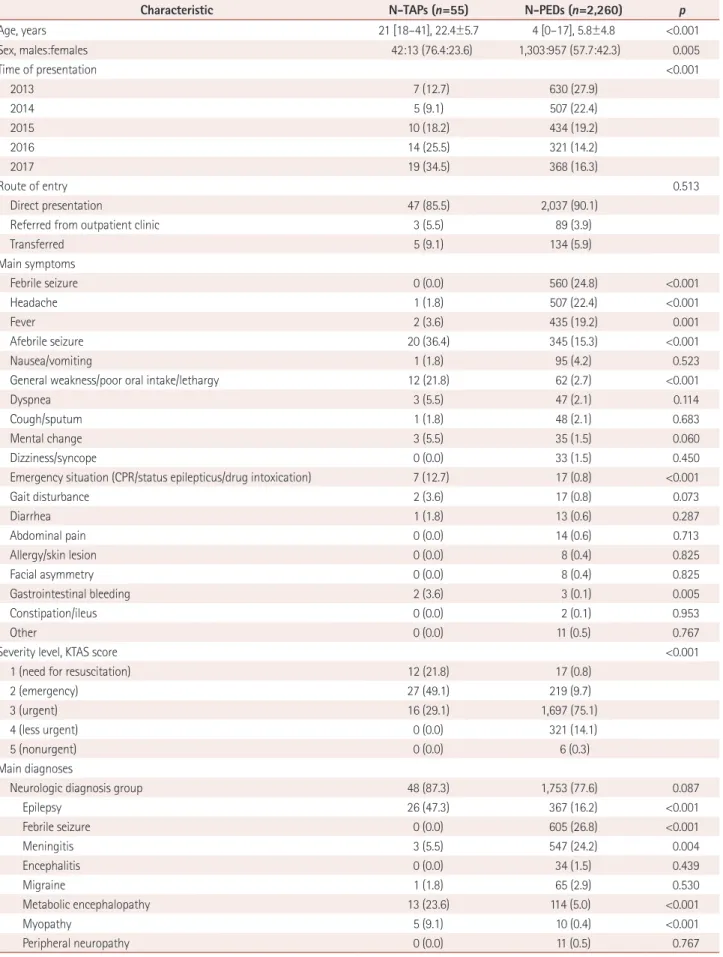
The proportion of boys was significantly higher in the N-TAP group than in the N-PED group (76.4% vs. 57.7%, p= 0.005) (Table 3). Presentations to the PED-ED by N-TAPs
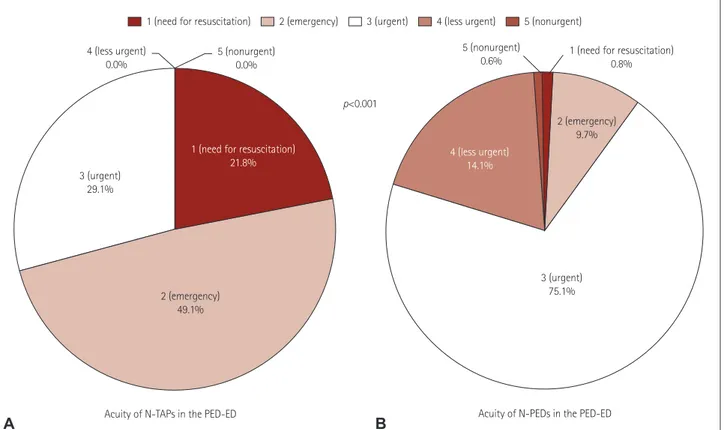
in-creased over time, whereas those by N-PEDs gradually de-creased, with a significant difference between the groups (p< 0.001) (Fig. 1). In particular, presentations by N-TAPs al-most tripled from 2013 to 2017. The severity level was higher and the main symptoms were more severe in N-TAPs than in N-PEDs. The severe main symptoms comprised afebrile seizures, general weakness, poor oral intake, lethargy, and other emergency situations. The proportion of patients with febrile seizures, headaches, and seizures was significantly higher for N-PEDs. No N-TAPs had a KTAS severity score of 4 or 5 (Fig. 2). TAPs seemed to be more likely than N-PEDs to have underlying primary neurologic diagnoses, but the difference was not statistically significant (p=0.087). Epilepsy and metabolic disease were significantly more com-mon acom-mong N-TAPS than acom-mong N-PEDs (p<0.001 for both), while febrile seizures and meningitis were signifi-cantly more common among N-PEDs (p<0.001 for both). The proportion of patients insured by the Medical Aid pro-gram was significantly higher among N-TAPs than among N-PEDs (p<0.001). The admission rate was higher (p<0.001) and the mean length of hospital stay was longer (p=0.046)
Table 2. Comparison of clinical characteristics between admitted and discharged neurologic patients presenting to the PED-ED (continued)
Characteristic Admission (n=1,147) Discharge (n=1,168) p
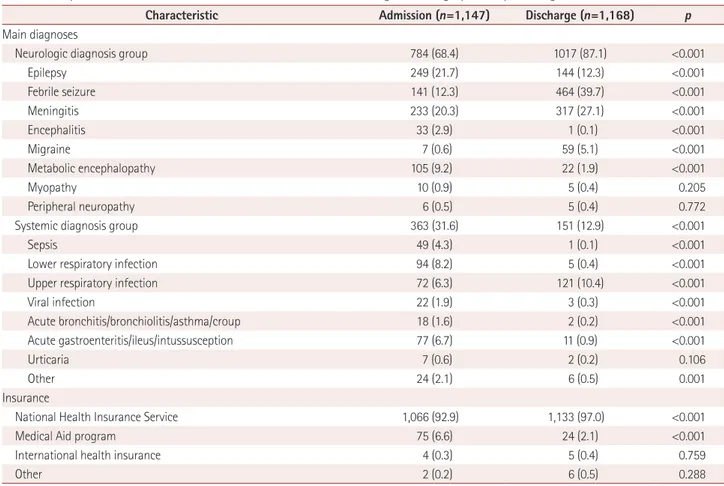
Main diagnoses
Neurologic diagnosis group 784 (68.4) 1017 (87.1) <0.001
Epilepsy 249 (21.7) 144 (12.3) <0.001 Febrile seizure 141 (12.3) 464 (39.7) <0.001 Meningitis 233 (20.3) 317 (27.1) <0.001 Encephalitis 33 (2.9) 1 (0.1) <0.001 Migraine 7 (0.6) 59 (5.1) <0.001 Metabolic encephalopathy 105 (9.2) 22 (1.9) <0.001 Myopathy 10 (0.9) 5 (0.4) 0.205 Peripheral neuropathy 6 (0.5) 5 (0.4) 0.772
Systemic diagnosis group 363 (31.6) 151 (12.9) <0.001
Sepsis 49 (4.3) 1 (0.1) <0.001
Lower respiratory infection 94 (8.2) 5 (0.4) <0.001
Upper respiratory infection 72 (6.3) 121 (10.4) <0.001
Viral infection 22 (1.9) 3 (0.3) <0.001 Acute bronchitis/bronchiolitis/asthma/croup 18 (1.6) 2 (0.2) <0.001 Acute gastroenteritis/ileus/intussusception 77 (6.7) 11 (0.9) <0.001 Urticaria 7 (0.6) 2 (0.2) 0.106 Other 24 (2.1) 6 (0.5) 0.001 Insurance
National Health Insurance Service 1,066 (92.9) 1,133 (97.0) <0.001
Medical Aid program 75 (6.6) 24 (2.1) <0.001
International health insurance 4 (0.3) 5 (0.4) 0.759
Other 2 (0.2) 6 (0.5) 0.288
Data are n (%), mean±standard-deviation, or median [range] values.
CPR: cardiopulmonary resuscitation, KTAS: Korean Triage and Acuity Scale, N-PEDs: pediatric patients with neurologic diseases, N-TAPs: transient and adult patients with neurologic diseases, PED-ED: pediatric emergency department.
Transient Neurologic Patients in the ED
JCN
Table 3. Comparison of the clinical characteristics of N-TAPs and N-PEDs presenting to the PED-ED
Characteristic N-TAPs (n=55) N-PEDs (n=2,260) p
Age, years 21 [18–41], 22.4±5.7 4 [0–17], 5.8±4.8 <0.001 Sex, males:females 42:13 (76.4:23.6) 1,303:957 (57.7:42.3) 0.005 Time of presentation <0.001 2013 7 (12.7) 630 (27.9) 2014 5 (9.1) 507 (22.4) 2015 10 (18.2) 434 (19.2) 2016 14 (25.5) 321 (14.2) 2017 19 (34.5) 368 (16.3) Route of entry 0.513 Direct presentation 47 (85.5) 2,037 (90.1)
Referred from outpatient clinic 3 (5.5) 89 (3.9)
Transferred 5 (9.1) 134 (5.9) Main symptoms Febrile seizure 0 (0.0) 560 (24.8) <0.001 Headache 1 (1.8) 507 (22.4) <0.001 Fever 2 (3.6) 435 (19.2) 0.001 Afebrile seizure 20 (36.4) 345 (15.3) <0.001 Nausea/vomiting 1 (1.8) 95 (4.2) 0.523
General weakness/poor oral intake/lethargy 12 (21.8) 62 (2.7) <0.001
Dyspnea 3 (5.5) 47 (2.1) 0.114
Cough/sputum 1 (1.8) 48 (2.1) 0.683
Mental change 3 (5.5) 35 (1.5) 0.060
Dizziness/syncope 0 (0.0) 33 (1.5) 0.450
Emergency situation (CPR/status epilepticus/drug intoxication) 7 (12.7) 17 (0.8) <0.001
Gait disturbance 2 (3.6) 17 (0.8) 0.073 Diarrhea 1 (1.8) 13 (0.6) 0.287 Abdominal pain 0 (0.0) 14 (0.6) 0.713 Allergy/skin lesion 0 (0.0) 8 (0.4) 0.825 Facial asymmetry 0 (0.0) 8 (0.4) 0.825 Gastrointestinal bleeding 2 (3.6) 3 (0.1) 0.005 Constipation/ileus 0 (0.0) 2 (0.1) 0.953 Other 0 (0.0) 11 (0.5) 0.767
Severity level, KTAS score <0.001
1 (need for resuscitation) 12 (21.8) 17 (0.8)
2 (emergency) 27 (49.1) 219 (9.7)
3 (urgent) 16 (29.1) 1,697 (75.1)
4 (less urgent) 0 (0.0) 321 (14.1)
5 (nonurgent) 0 (0.0) 6 (0.3)
Main diagnoses
Neurologic diagnosis group 48 (87.3) 1,753 (77.6) 0.087
Epilepsy 26 (47.3) 367 (16.2) <0.001 Febrile seizure 0 (0.0) 605 (26.8) <0.001 Meningitis 3 (5.5) 547 (24.2) 0.004 Encephalitis 0 (0.0) 34 (1.5) 0.439 Migraine 1 (1.8) 65 (2.9) 0.530 Metabolic encephalopathy 13 (23.6) 114 (5.0) <0.001 Myopathy 5 (9.1) 10 (0.4) <0.001 Peripheral neuropathy 0 (0.0) 11 (0.5) 0.767
Na JH et al.
JCN
Table 3. Comparison of the clinical characteristics of N-TAPs and N-PEDs presenting to the PED-DE
Characteristic N-TAPs (n=55) N-PEDs (n=2,260) p
Systemic diagnosis group 7 (12.7) 507 (22.4) 0.087
Sepsis 3 (5.5) 47 (2.1) 0.110
Lower respiratory infection 0 (0.0) 99 (4.4) 0.171
Upper respiratory infection 1 (1.8) 192 (8.5) 0.125
Viral infection 0 (0.0) 25 (1.1) 0.546 Acute bronchitis/bronchiolitis/asthma/croup 0 (0.0) 20 (0.9) 0.617 Acute gastroenteritis/ileus/intussusception 2 (3.6) 86 (3.8) 0.652 Urticaria 1 (1.8) 8 (0.4) 0.195 Other 0 (0.0) 30 (1.3) 0.484 Insurance
National Health Insurance Service 45 (81.8) 2,154 (95.3) <0.001
Medical Aid program 9 (16.4) 90 (4.0) <0.001
International health insurance 0 (0.0) 9 (0.4) 0.805
Other 1 (1.8) 7 (0.3) 0.175
Admission 48 (87.3) 1,099 (48.6) <0.001
Days of admission 15.8±33.6 5.9±12.2 0.046
95% confidence interval 0.2 to 19.5
Data are n (%), mean±standard-deviation, or median [range] values.
CPR: cardiopulmonary resuscitation, KTAS: Korean Triage and Acuity Scale, N-PEDs: pediatric patients with neurologic diseases, N-TAPs: transient and adult patients with neurologic diseases, PED-ED: pediatric emergency department.
Fig. 1. Changing rates of N-TAPs and N-PEDs presenting to the PED-ED. Yearly changes in the numbers of N-TAPs, N-PEDs, neurologic patients, and total patients in the PED-ED. A: The number of N-TAPs steadily increased, and the proportion of N-TAPs presenting to the PED-ED more than qua-drupled from 2013 to 2017. B: Unlike N-TAPs, the proportion of N-PEDs presenting to the PED-ED is steadily declining. C: Yearly changes in neuro-logic patients presenting to the PED-ED (both N-TAPs and N-PEDs). Neuroneuro-logic patients presenting to the PED-ED show a gradually declining trend. D: Annual change in total patients presenting to the PED-ED. The total number of PED-ED patients is declining. N-PEDs: pediatric patients with neu-rologic diseases, N-TAPs: transient and adult patients with neuneu-rologic diseases, PED-ED: pediatric emergency department.
100.0 99.0 98.0 97.0 96.0 95.0 94.0 93.0 8,000 7,000 6,000 5,000 4,000 3,000 5.0 4.5 4.0 3.5 3.0 2.5 2.0 1.5 1.0 0.5 0.0 800 700 600 500 400 300 200 100 0 % Patients ( n) % Patients ( n) 2013 2014 2015 2016 2017 2013 2014 2015 2016 2017 2013 2014 2015 2016 2017 2013 2014 2015 2016 2017 Year
Rate of N-TAPs in the PED-ED Rate of N-PEDs in the PED-ED
Year Year Year 7,245 7,535 7,200 6,114 6,345 637 512 444 335 387 1.1 1.0 2.3 4.2 4.9 98.9 99.0 97.7 95.8 95.1
Change in the number of total patients in the PED-ED
Change in the number of neurologic patients in the PED-ED
A
C
B
Transient Neurologic Patients in the ED
JCN
for N-TAPs than for N-PEDs.
Characteristics of N-TAPs presenting to the PED-ED:
admission and discharge
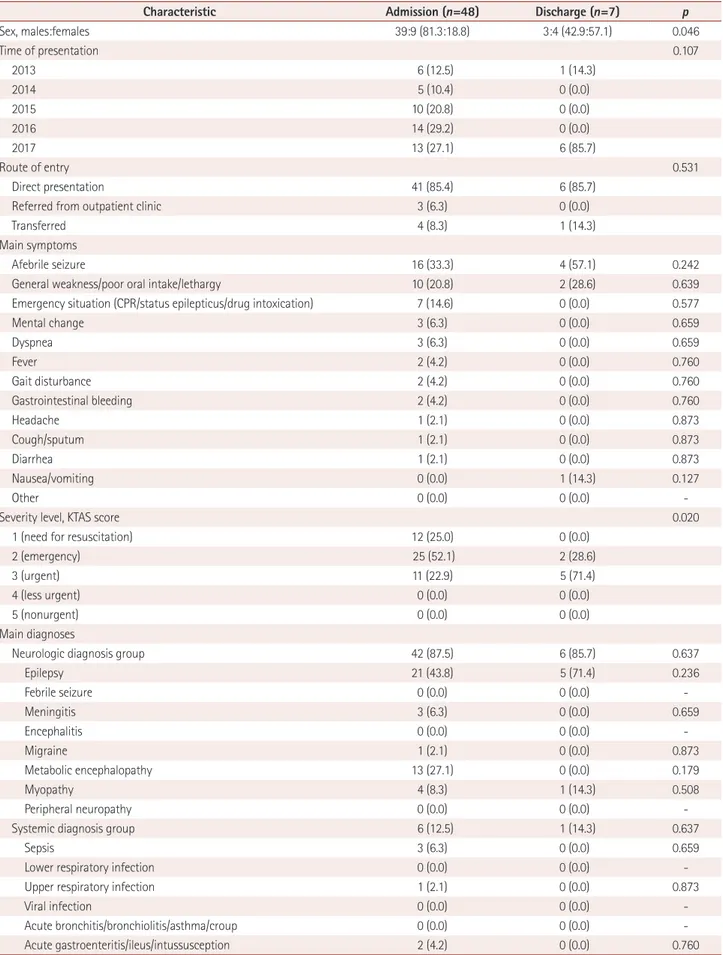
There were 55 N-TAPs, of which 48 were in the admission group and 7 were in the discharge group (Table 4). The pro-portion of boys was much higher in the admission group than in the discharge group (81.3% vs. 42.9%, p=0.046). The route of entry or main symptom did not differ significantly between the two N-TAPs groups. However, there was a significant in-tergroup difference (p=0.02) in the distribution of severity levels, with 25% of those in the admission group requiring re-suscitation. However, no patient in either group had a sever-ity level of 4 or 5. There was no statistically significant differ-ence in the main diagnosis or insurance status between the two groups.
Characteristics of N-PEDs presenting to the PED-ED:
admission and discharge
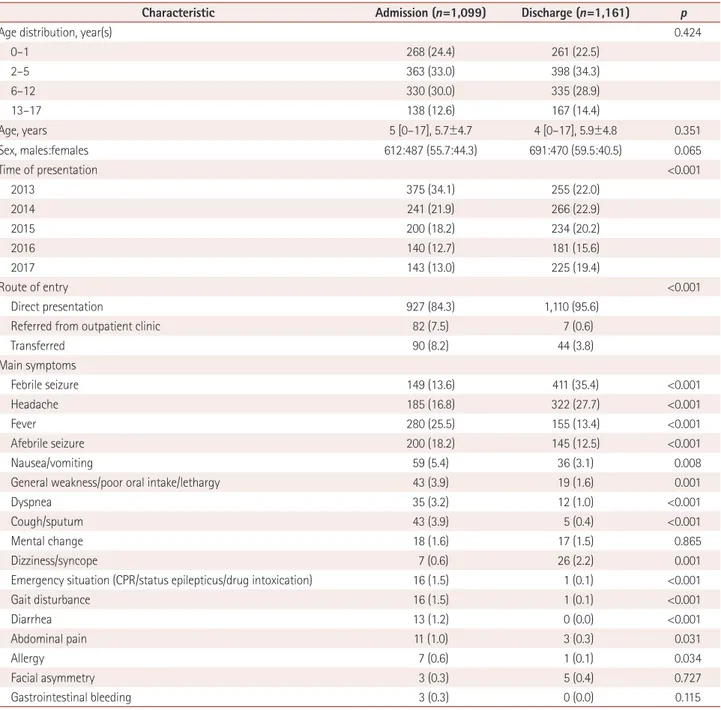
The age distribution of N-PEDs was statistically identical in the admission and discharge groups during the 5-year study period (Table 5). The numbers of patients in both groups
decreased over time, with the decrease being significantly greater in the admission group than in the discharge group (p<0.001). Regarding the route of entry to the PED-ED, be-ing referred from outpatient clinics or transferred from other locations was significantly more common in the admission group (p<0.001).
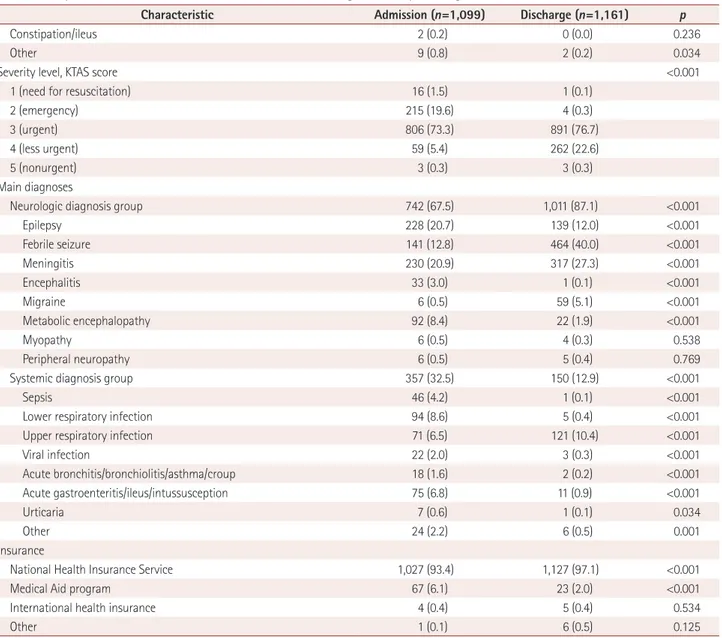
In terms of the main symptoms, there were significantly more patients with fevers, afebrile seizures, and nausea/vom-iting in the admission group than in the discharge group, whereas febrile seizures, headaches, and dizziness/syncope were significantly more common in the discharge group. The proportion of patients with severity levels of 1 and 2 was sig-nificantly higher in the admission group (p<0.001). There was a strong tendency for the underlying systemic diagnosis to be the main symptom in the admission group, and these patients generally had a larger number of separate diagnoses compared to those in the discharge group. Significantly more patients in the admission group were insured by Medical Aid (p<0.001).
Underlying diagnoses of N-TAPs in the PED-ED
There were 6 diagnoses among the 55 N-TAPs who present-2 (emergency)49.1% 3 (urgent)
29.1%
1 (need for resuscitation) 21.8%
4 (less urgent)
0.0% 5 (nonurgent) 0.0%
1 (need for resuscitation) 0.8% 5 (nonurgent) 0.6% 2 (emergency) 9.7% 3 (urgent) 75.1% 4 (less urgent) 14.1% p<0.001
Acuity of N-TAPs in the PED-ED Acuity of N-PEDs in the PED-ED
1 (need for resuscitation) 2 (emergency) 3 (urgent) 4 (less urgent) 5 (nonurgent)
A B
Fig. 2. Difference in severity levels (KTAS scores) between N-TAPs and N-PEDs. Comparison of the severity of disease in N-TAPs and N-PEDs based on KTAS scores. A: Severity distribution for N-TAPs presenting to the PED-ED. B: Severity distribution for N-TAPs presenting to the PED-ED. Overall, the N-TAPs presenting to the PED-ED had a higher severity level. The distributions in (A) and (B) were statistically significant. KTAS: Korean Triage and Acuity Scale, N-PEDs: pediatric patients with neurologic diseases, N-TAPs: transient and adult patients with neurologic diseases, PED-ED: pedi-atric emergency department.
Na JH et al.
JCN
Table 4. Comparison of clinical characteristics of admitted and discharged N-TAPs presenting to the PED-ED
Characteristic Admission (n=48) Discharge (n=7) p
Sex, males:females 39:9 (81.3:18.8) 3:4 (42.9:57.1) 0.046 Time of presentation 0.107 2013 6 (12.5) 1 (14.3) 2014 5 (10.4) 0 (0.0) 2015 10 (20.8) 0 (0.0) 2016 14 (29.2) 0 (0.0) 2017 13 (27.1) 6 (85.7) Route of entry 0.531 Direct presentation 41 (85.4) 6 (85.7)
Referred from outpatient clinic 3 (6.3) 0 (0.0)
Transferred 4 (8.3) 1 (14.3)
Main symptoms
Afebrile seizure 16 (33.3) 4 (57.1) 0.242
General weakness/poor oral intake/lethargy 10 (20.8) 2 (28.6) 0.639
Emergency situation (CPR/status epilepticus/drug intoxication) 7 (14.6) 0 (0.0) 0.577
Mental change 3 (6.3) 0 (0.0) 0.659 Dyspnea 3 (6.3) 0 (0.0) 0.659 Fever 2 (4.2) 0 (0.0) 0.760 Gait disturbance 2 (4.2) 0 (0.0) 0.760 Gastrointestinal bleeding 2 (4.2) 0 (0.0) 0.760 Headache 1 (2.1) 0 (0.0) 0.873 Cough/sputum 1 (2.1) 0 (0.0) 0.873 Diarrhea 1 (2.1) 0 (0.0) 0.873 Nausea/vomiting 0 (0.0) 1 (14.3) 0.127 Other 0 (0.0) 0 (0.0)
-Severity level, KTAS score 0.020
1 (need for resuscitation) 12 (25.0) 0 (0.0)
2 (emergency) 25 (52.1) 2 (28.6)
3 (urgent) 11 (22.9) 5 (71.4)
4 (less urgent) 0 (0.0) 0 (0.0)
5 (nonurgent) 0 (0.0) 0 (0.0)
Main diagnoses
Neurologic diagnosis group 42 (87.5) 6 (85.7) 0.637
Epilepsy 21 (43.8) 5 (71.4) 0.236 Febrile seizure 0 (0.0) 0 (0.0) -Meningitis 3 (6.3) 0 (0.0) 0.659 Encephalitis 0 (0.0) 0 (0.0) -Migraine 1 (2.1) 0 (0.0) 0.873 Metabolic encephalopathy 13 (27.1) 0 (0.0) 0.179 Myopathy 4 (8.3) 1 (14.3) 0.508 Peripheral neuropathy 0 (0.0) 0 (0.0)
-Systemic diagnosis group 6 (12.5) 1 (14.3) 0.637
Sepsis 3 (6.3) 0 (0.0) 0.659
Lower respiratory infection 0 (0.0) 0 (0.0)
-Upper respiratory infection 1 (2.1) 0 (0.0) 0.873
Viral infection 0 (0.0) 0 (0.0)
-Acute bronchitis/bronchiolitis/asthma/croup 0 (0.0) 0 (0.0)
Transient Neurologic Patients in the ED
JCN
Table 4. Comparison of clinical characteristics of admitted and discharged N-TAPs presenting to the PED-ED (continued)
Characteristic Admission (n=48) Discharge (n=7) p
Urticaria 0 (0.0) 1 (14.3) 0.127
Other 0 (0.0) 0 (0.0)
-Insurance
National Health Insurance Service 39 (81.3) 6 (85.7) 0.625
Medical Aid program 8 (16.6) 1 (14.3) 0.679
International health insurance 0 (0.0) 0 (0.0)
-Other 1 (2.1) 0 (0.0) 0.873
Data are n (%) values.
CPR: cardiopulmonary resuscitation, KTAS: Korean Triage and Acuity Scale, N-TAPs: transient and adult patients with neurologic diseases, PED-ED: pedi-atric emergency department.
Table 5. Comparison of clinical characteristics of admitted and discharged N-PEDs presenting to the PED-ED
Characteristic Admission (n=1,099) Discharge (n=1,161) p
Age distribution, year(s) 0.424
0–1 268 (24.4) 261 (22.5) 2–5 363 (33.0) 398 (34.3) 6–12 330 (30.0) 335 (28.9) 13–17 138 (12.6) 167 (14.4) Age, years 5 [0–17], 5.7±4.7 4 [0–17], 5.9±4.8 0.351 Sex, males:females 612:487 (55.7:44.3) 691:470 (59.5:40.5) 0.065 Time of presentation <0.001 2013 375 (34.1) 255 (22.0) 2014 241 (21.9) 266 (22.9) 2015 200 (18.2) 234 (20.2) 2016 140 (12.7) 181 (15.6) 2017 143 (13.0) 225 (19.4) Route of entry <0.001 Direct presentation 927 (84.3) 1,110 (95.6)
Referred from outpatient clinic 82 (7.5) 7 (0.6)
Transferred 90 (8.2) 44 (3.8) Main symptoms Febrile seizure 149 (13.6) 411 (35.4) <0.001 Headache 185 (16.8) 322 (27.7) <0.001 Fever 280 (25.5) 155 (13.4) <0.001 Afebrile seizure 200 (18.2) 145 (12.5) <0.001 Nausea/vomiting 59 (5.4) 36 (3.1) 0.008
General weakness/poor oral intake/lethargy 43 (3.9) 19 (1.6) 0.001
Dyspnea 35 (3.2) 12 (1.0) <0.001
Cough/sputum 43 (3.9) 5 (0.4) <0.001
Mental change 18 (1.6) 17 (1.5) 0.865
Dizziness/syncope 7 (0.6) 26 (2.2) 0.001
Emergency situation (CPR/status epilepticus/drug intoxication) 16 (1.5) 1 (0.1) <0.001
Gait disturbance 16 (1.5) 1 (0.1) <0.001 Diarrhea 13 (1.2) 0 (0.0) <0.001 Abdominal pain 11 (1.0) 3 (0.3) 0.031 Allergy 7 (0.6) 1 (0.1) 0.034 Facial asymmetry 3 (0.3) 5 (0.4) 0.727 Gastrointestinal bleeding 3 (0.3) 0 (0.0) 0.115
Na JH et al.
JCN
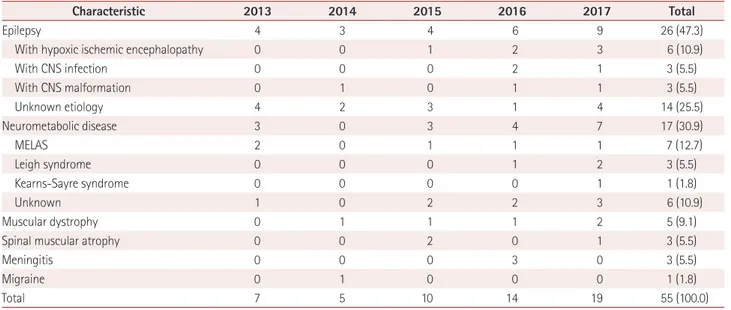
ed to the PED-ED during the 5-year study period (Table 6): epilepsy, neurometabolic diseases, muscular dystrophy, spinal atrophy, meningitis, and migraine. Epilepsy was the most-common condition (n=26, 47.3%), followed by neuromet-abolic disease (n=17, 30.9%). The cause of symptoms was known for 12 patients in the epilepsy group: complications of hypoxic ischemic encephalopathy (n=6, 10.9%), central ner-vous system infection (n=3, 5.5%), and central nerner-vous sys-tem malformation (n=3, 5.5%); the causes of symptoms were unknown for the other 14 patients. In the neurometabolic disease group, mitochondrial encephalomyopathy, lactic aci-dosis, and stroke-like episodes (n=7, 12.7%), Leigh syndrome (n=3, 5.5%), and Kearns-Sayre syndrome (n=1, 1.8%)
ac-counted for most of the diagnoses, with the cause being un-known for 14 patients in the neurometabolic category.
DISCUSSION
Several previous studies have found that TAPs comprise 0.9–4.0% of all patients presenting to the PED-ED, and that their numbers and proportions are increasing.2,3,9,11,16-19 Some
studies have shown that the underlying diseases of TAPs are becoming increasingly diverse.3,9 However, few studies have
investigated the trends and characteristics of N-TAPs, who represent a major proportion of the patients presenting to the PED-ED. The present study was prompted by pediatric
neu-Table 5. Comparison of clinical characteristics of admitted and discharged N-PEDs presenting to the PED-ED (continued)
Characteristic Admission (n=1,099) Discharge (n=1,161) p
Constipation/ileus 2 (0.2) 0 (0.0) 0.236
Other 9 (0.8) 2 (0.2) 0.034
Severity level, KTAS score <0.001
1 (need for resuscitation) 16 (1.5) 1 (0.1)
2 (emergency) 215 (19.6) 4 (0.3)
3 (urgent) 806 (73.3) 891 (76.7)
4 (less urgent) 59 (5.4) 262 (22.6)
5 (nonurgent) 3 (0.3) 3 (0.3)
Main diagnoses
Neurologic diagnosis group 742 (67.5) 1,011 (87.1) <0.001
Epilepsy 228 (20.7) 139 (12.0) <0.001 Febrile seizure 141 (12.8) 464 (40.0) <0.001 Meningitis 230 (20.9) 317 (27.3) <0.001 Encephalitis 33 (3.0) 1 (0.1) <0.001 Migraine 6 (0.5) 59 (5.1) <0.001 Metabolic encephalopathy 92 (8.4) 22 (1.9) <0.001 Myopathy 6 (0.5) 4 (0.3) 0.538 Peripheral neuropathy 6 (0.5) 5 (0.4) 0.769
Systemic diagnosis group 357 (32.5) 150 (12.9) <0.001
Sepsis 46 (4.2) 1 (0.1) <0.001
Lower respiratory infection 94 (8.6) 5 (0.4) <0.001
Upper respiratory infection 71 (6.5) 121 (10.4) <0.001
Viral infection 22 (2.0) 3 (0.3) <0.001 Acute bronchitis/bronchiolitis/asthma/croup 18 (1.6) 2 (0.2) <0.001 Acute gastroenteritis/ileus/intussusception 75 (6.8) 11 (0.9) <0.001 Urticaria 7 (0.6) 1 (0.1) 0.034 Other 24 (2.2) 6 (0.5) 0.001 Insurance
National Health Insurance Service 1,027 (93.4) 1,127 (97.1) <0.001
Medical Aid program 67 (6.1) 23 (2.0) <0.001
International health insurance 4 (0.4) 5 (0.4) 0.534
Other 1 (0.1) 6 (0.5) 0.125
Data are n (%), mean±standard-deviation, or median [range] values.
CPR: cardiopulmonary resuscitation, KTAS: Korean Triage and Acuity Scale, N-PEDs: pediatric patients with neurologic diseases, PED-ED: pediatric emer-gency department.
Transient Neurologic Patients in the ED
JCN
rologists noticing some changes in the number of N-TAPs who presented to the PED-ED while they were undergoing medical care, and so we investigated some of these changes and the characteristics of these patients.
The number of PED-ED presentations by N-TAPs steadily increased during the 5-year study period. There was a three-fold increase in the number and a nearly fourthree-fold increase in the proportion of N-TAPs presenting to the PED-ED from 2013 to 2017 (Fig. 1A and B). This could have been due to differences in medical situations, including differences in the most-abundant subgroup of TAPs presenting to the PED-ED. However, there is a growing body of evidence that N-TAPs have a major effect on the overall number of TAPs present-ing to the PED-ED.9,12,16 This should be important to
pediat-ric neurologists due to increasing numbers and proportions of N-TAPs presenting to the PED-ED. However, the decreased number of children being born in Korea due to decreased fer-tility rates is resulting in a downward trend in the overall num-ber of PED-ED patients (Fig. 1C and D).20 It is therefore
pos-sible that these findings are also applicable to other countries with low fertility rates.21
We performed a comparative analysis of N-PEDs to elu-cidate the characteristics of N-TAPs presenting to the PED-ED. N-TAPs have greater disease/symptom severity, higher hospitalization rates, longer hospital stays, and greater use of the Medical Aid insurance program compared to N-PEDs (Table 3, Fig. 2). The characteristics of N-TAPs found in this study are supported by several other studies. Camfield and Camfield.1 concluded that in cases of epilepsy, which accounts
for many of the neurologic conditions observed in the
PED-ED, if the disease is severe and persists beyond the age of 15– 20 years, the risk of sudden unexpected death may increase. Similarly, Wakamoto et al.6 suggested that the mortality rate
is higher for adult than pediatric patients with childhood-on-set epilepsy. The finding of high severity levels of N-TAPs in these studies is consistent with the results of the present study, suggesting that caution is required when treating N-TAPs in the PED-ED. Moreover, N-TAPs tended to have a lower socio-economic status in some cohort studies performed in Canada, Finland, Japan, and Germany.1,6,19 Those findings and the
re-sults of the present study highlight the need for PED-ED practitioners to understand the different socioeconomic situ-ations of their patients so that they can ensure that they have the social skills required to care for N-TAPs.
The proportion of N-TAPs who presented to the PED-ED with an underlying primary neurologic disorder was higher than that of N-PEDs. Therefore, presenting to the PED-ED with underlying neurologic disorders was more likely among N-TAPs rather among N-PEDs. However, this difference was not statistically significant (p=0.087), and hence further ob-servations are needed to confirm the real situation. We sug-gest that support focusing on neurologic disease is necessary in the PED-ED due to the high hospitalization rates of N-TAPs who present for treatment. A recent study by Michiha-ta et al.22 of the primary diagnoses of adult patients in a
pe-diatric department may support the concept that clinicians should focus more on disease-oriented care—rather than age-oriented care—when treating N-TAPs.
To gain a better understanding of N-TAPs, we performed a comparative analysis of N-TAPs and N-PEDs among the
Table 6. Underlying diagnoses of N-TAPs who presented to the PED-ED from 2013 to 2017
Characteristic 2013 2014 2015 2016 2017 Total
Epilepsy 4 3 4 6 9 26 (47.3)
With hypoxic ischemic encephalopathy 0 0 1 2 3 6 (10.9)
With CNS infection 0 0 0 2 1 3 (5.5) With CNS malformation 0 1 0 1 1 3 (5.5) Unknown etiology 4 2 3 1 4 14 (25.5) Neurometabolic disease 3 0 3 4 7 17 (30.9) MELAS 2 0 1 1 1 7 (12.7) Leigh syndrome 0 0 0 1 2 3 (5.5) Kearns-Sayre syndrome 0 0 0 0 1 1 (1.8) Unknown 1 0 2 2 3 6 (10.9) Muscular dystrophy 0 1 1 1 2 5 (9.1)
Spinal muscular atrophy 0 0 2 0 1 3 (5.5)
Meningitis 0 0 0 3 0 3 (5.5)
Migraine 0 1 0 0 0 1 (1.8)
Total 7 5 10 14 19 55 (100.0)
Data are n (%) values.
CNS: central nervous system, MELAS: mitochondrial encephalomyopathy, lactic acidosis, and stroke-like episodes, N-TAPs: transient and adult patients with neurologic diseases, PED-ED: pediatric emergency department.
Na JH et al.
JCN
admitted and discharged patients (Table 4 and 5). It washy-pothesized that N-TAPs tend to be homogeneous because no significant difference was found in the other variables; how-ever, the severity level of admitted patients was higher than that of discharged patients. Furthermore, admitted N-PEDs accounted for a higher percentage of almost all of the afore-mentioned main symptoms. In addition, because the rate of a systemic diagnosis was significantly higher in the admitted patients than in the discharged patients, N-PEDs appeared to be heterogeneous regardless of whether they were admit-ted. Our comparison of the characteristics of admitted N-TAPs and N-PEDs revealed that N-N-TAPs might have dis-ease-specific associations rather than main symptoms at the time of presentation to the PED-ED. Therefore, the under-lying neurologic characteristics should be considered when N-TAPs present to the PED-ED.
We investigated the underlying neurologic diseases of 55 N-TAPs (Table 6). Epilepsy and neurometabolic disease were the most-common diagnoses, which is probably due to recent medical advancements including new neurologic drugs significantly improving the survival rates of these pa-tients; in other words, these patients are able to live past child-hood and then present to the PED-ED during adultchild-hood for treatment. In addition, the increased survival rates and the development of diagnostic technology—along with the in-creasing focus on treating pediatric neurologic and rare dis-eases—mean that these diseases can be diagnosed and have become treatable. Therefore, the increase in neurometabolic disease rates among N-TAPs is the result of precision medi-cine, and this trend for N-TAPs is expected to continue.1,7,8,17
Epilepsy is characterized by a wide variety of clinical mani-festations, and neurometabolic disease is accompanied by a wide range of neurologic symptoms that often result in new symptoms developing during adulthood. Some researchers have suggested that pediatric neurologists should focus on other chronic neurologic diseases that were not considered in this study, such as tuberous sclerosis complex, Rett syndrome, Dravet syndrome, and autism/autistic spectrum disorder.17
However, there has been a general lack of interest in transition patients such as N-TAPs, resulting in insufficient resources for transitional health care such as pathophysiology, appro-priate drug dosage, and emotional care for N-TAPs. Neurologic diseases can have long-term effects on the physical health, mental health, and social activities of N-TAPs. Therefore, in addition to treating the disease itself, pediatric neurologists should develop long-term care plans for N-TAPs that include multidisciplinary care by pediatric psychiatrists and pediatric psychologists.
Despite our research being limited by the small number of patients, we have been able to draw clear conclusions about
the status of N-TAPs in the PED-ER and the role of pediatric neurologists in treating and managing this patient population. N-TAPs show a trend of rapidly increasing presentations to the PED-ED for treatment. Therefore, appropriate medical care is required for adult patients with pediatric-oriented dis-eases who not only present to the PED-ED but also present to medical departments and intensive-care units.22,23
Improv-ing the quality of life and long-term survival of TAPs re-quires an accurate understanding of the natural course of their underlying diseases and the ability to apply this knowl-edge systematically in PED-EDs, medical departments, in-tensive-care units, and outpatient departments. In addition, pediatric neurologists need to be familiar with medication dosages for adults and the pathophysiology of TAPs, which may differ from that of children, in order to be able to effec-tively treat N-TAPs.24 Pediatric neurologists should consider
the emotional upset that can occur in situations when N-TAPs receive adult care, and be able to help with natural bridging to adult care.
The mental development of TAPs must be considered by pediatric neurologists, which requires multidisciplinary care by pediatric psychiatrists and pediatric psychologists. A for-mal and gradual transition process from pediatric to adult health-care services should be established via long prepara-tion periods, cooperaprepara-tion between health-care professionals, and education of patients regarding self-management and self-monitoring.25,26 Because N-TAPs comprise a major
pro-portion of TAPs, a plan of care needs to be established for them through further epidemiologic studies.
Conflicts of Interest
The authors have no potential conflicts of interest to disclose. Acknowledgements
The authors are grateful to all staff members, doctors, and statistical con-sultants who were involved in this study.
REFERENCES
1. Camfield PR, Camfield CS. What happens to children with epilepsy when they become adults? Some facts and opinions. Pediatr Neurol 2014;51:17-23.
2. Davis AM, Brown RF, Taylor JL, Epstein RA, McPheeters ML. Transi-tion care for children with special health care needs. Pediatrics 2014; 134:900-908.
3. Goodman DM, Hall M, Levin A, Watson RS, Williams RG, Shah SS, et al. Adults with chronic health conditions originating in childhood: inpatient experience in children’s hospitals. Pediatrics 2011;128:5-13. 4. Borlot F, Tellez-Zenteno JF, Allen A, Ali A, Snead OC 3rd, Andrade
DM. Epilepsy transition: challenges of caring for adults with child-hood-onset seizures. Epilepsia 2014;55:1659-1666.
5. Andrade DM, Bassett AS, Bercovici E, Borlot F, Bui E, Camfield P, et al. Epilepsy: transition from pediatric to adult care. Recommenda-tions of the Ontario epilepsy implementation task force. Epilepsia 2017;58:1502-1517.
Transient Neurologic Patients in the ED
JCN
educational, and social prognoses of childhood-onset epilepsy: a pop-ulation-based study in a rural district of Japan. Brain Dev 2000;22:246-255.
7. Camfield P, Camfield C, Busiah K, Cohen D, Pack A, Nabbout R. The transition from pediatric to adult care for youth with epilepsy: basic biological, sociological, and psychological issues. Epilepsy Behav 2017; 69:170-176.
8. Okumura MJ, Heisler M, Davis MM, Cabana MD, Demonner S, Kerr EA. Comfort of general internists and general pediatricians in providing care for young adults with chronic illnesses of childhood. J Gen Intern Med 2008;23:1621-1627.
9. McDonnell WM, Kocolas I, Roosevelt GE, Yetman AT. Pediatric emergency department use by adults with chronic pediatric disor-ders. Arch Pediatr Adolesc Med 2010;164:572-576.
10. Geerlings RP, Aldenkamp AP, De With PH, Zinger S, Gottmer-Wel-schen LM, De Louw AJ. Transition to adult medical care for adoles-cents with epilepsy. Epilepsy Behav 2015;44:127-135.
11. Bourgeois FT, Shannon MW. Adult patient visits to children’s hospi-tal emergency departments. Pediatrics 2003;111:1268-1272. 12. Little WK, Hirsh DA. Adult patients in the pediatric emergency
de-partment: presentation and disposition. Pediatr Emerg Care 2014;30: 808-811.
13. Lee B, Kim DK, Park JD, Kwak YH. Clinical considerations when ap-plying vital signs in pediatric Korean Triage and Acuity Scale. J Korean Med Sci 2017;32:1702-1707.
14. Kim JH, Lee KS, Yoo KB, Park EC. The differences in health care uti-lization between Medical Aid and health insurance: a longitudinal study using propensity score matching. PLoS One 2015;10:e0119939. 15. Kim JH, Kim NR, Park EC, Han KT, Choi Y, Lee SG. Impact of
con-tinuous Medical Aid utilisation on healthcare utilisation: unique in-sight using the 2008-2012 Korean Welfare Panel Study (KOWEPS). BMJ Open 2016;6:e008583.
16. Rhine T, Gittelman M, Timm N. Prevalence and trends of the adult patient population in a pediatric emergency department. Pediatr Emerg
Care 2012;28:141-144.
17. Nabbout R, Andrade DM, Bahi-Buisson N, Cross H, Desquerre I, Du-lac O, et al. Outcome of childhood-onset epilepsy from adolescence to adulthood: transition issues. Epilepsy Behav 2017;69:161-169. 18. Nabbout R, Camfield CS, Andrade DM, Arzimanoglou A, Chiron C,
Cramer JA, et al. Treatment issues for children with epilepsy transi-tioning to adult care. Epilepsy Behav 2017;69:153-160.
19. Camfield C, Camfield P. Preventable and unpreventable causes of childhood-onset epilepsy plus mental retardation. Pediatrics 2007;120: e52-e55.
20. Statistics Korea. Final results of birth statistics in 2016 [Internet]. Dae-jeon: Statistics Korea; 2017 [cited 2018 Mar 13]. Available from: http:// kostat.go.kr/portal/eng/pressReleases/1/index.board?bmode=read& aSeq=363582.
21. Korean Statistical Information Service. International statistical year-book: total fertility rate OECD [Internet]. Daejeon: Statistics Korea; 2018 [cited 2018 Mar 13]. Available from: http://kosis.kr/statHtml/ statHtml.do?orgId=101&tblId=DT_2KAA207_OECD#.
22. Michihata N, Matsui H, Fushimi K, Yasunaga H. Clinical features of adult patients admitted to pediatric wards in Japan. J Adolesc Health 2015;57:421-424.
23. Edwards JD, Vasilevskis EE, Yoo EJ, Houtrow AJ, Boscardin WJ, Dudley RA, et al. Adults with childhood-onset chronic conditions admitted to US pediatric and adult intensive care units. J Crit Care 2015;30:201-206.
24. Chiron C, An I. Pharmacology aspects during transition and at trans-fer in patients with epilepsy. Epilepsia 2014;55:8-11.
25. Affdal AO, Moutard ML, Billette de Villemeur T, Duchange N, Hervé C, Moutel G. A difficult transition from childhood to adult health-care: the case of epilepsy. Arch Pediatr 2015;22:337-342.
26. Young S, Murphy CM, Coghill D. Avoiding the ‘twilight zone’: recom-mendations for the transition of services from adolescence to adult-hood for young people with ADHD. BMC Psychiatry 2011;11:174.