Contents lists available atScienceDirect
Energy Reports
journal homepage:www.elsevier.com/locate/egyr
Research paper
Impacts of deploying co-electrolysis of CO
2
and H
2
O in the power
generation sector: A case study for South Korea
Kosan Roh
a, Wonsuk Chung
b, Hyejin Lee
c, Seungman Park
d, Jay H. Lee
b,∗ aProcess Systems Engineering (AVT.SVT), RWTH Aachen University, Forckenbeckstraße 51, 52074 Aachen, GermanybDepartment of Chemical and Biomolecular Engineering, Korea Advanced Institute of Science and Technology (KAIST), 291 Daehak-ro,
Yuseong-gu, Daejeon 34141, Republic of Korea
cDepartment of Agricultural & Resource Economics, Seoul National University, 1 Gwanak-ro, Gwanak-Gu, Seoul 08826, Republic of Korea dEnertopia Korea, 511 Yeongdong-Daero, Gangnam-Gu, Seoul 06164, Republic of Korea
a r t i c l e i n f o
Article history:
Received 31 December 2019
Received in revised form 18 March 2020 Accepted 23 March 2020
Available online xxxx
Keywords:
Power-to-Gas Co-electrolysis
CO2capture and utilization TIMES
Excess electricity Syngas
a b s t r a c t
This work analyzes the impacts of deploying a Power-to-Gas technology in the power generation sector in South Korea by 2050. The Power-to-Gas technology of interest is the low-temperature co-electrolysis of CO2and H2O, which is an emerging technology for electrochemically converting them
to syngas. Particularly, excess electricity available from intermittent renewable energy resources is intended to be the main energy source for the co-electrolysis. A conceptual design of the co-electrolysis process is carried out to calculate its performance data including mass balances, energy demand, and capital investment. Based on them, a temporal energy system model is developed using the TIMES (The Integrated MARKAL-EFOM System) model generator. The conclusion is that deploying the co-electrolysis process in the Korean power generation sector can reduce greenhouse gas emissions and also save the overall system cost when the syngas production cost is lower than the purchasing cost of liquid natural gas. The beneficial impacts are limited by the amount of available excess electricity and the co-firing ratio limit in the gas-fired power plants. Finally, the overpotential and current density, as uncertain parameters of the co-electrolysis process, are found to affect the syngas production cost most strongly.
© 2020 The Authors. Published by Elsevier Ltd. This is an open access article under the CC BY-NC-ND license (http://creativecommons.org/licenses/by-nc-nd/4.0/).
1. Introduction
Use of renewable energy resources in power generation has recently been accelerated due to the rising concern about cli-mate change. In 2017, renewables-based electricity generation increased by 6.3% (380 TWh) to account for 25% of global electric-ity generation. In particular, wind power and solar photovoltaic (PV) grew at the pace of 36% and 27%, respectively (OECD/IEA,
2018). However, the availability of such resources is inherently intermittent so that their power generation rates highly fluctuate. As a result, their continued penetration into the power sector will lead to a grid instability problem caused by supply–demand im-balance. To solve this problem, excess electricity occurring during high generation periods should be stored for later use. Batteries are the best known solutions to this and lithium-ion batteries in particular are best positioned to meet the requirement for electric energy storage in the near future given its high round-trip efficiency (70%–80%) (Schimpe et al.,2018). However, the energy density of batteries is not high and its cost is not cheap enough
∗
Corresponding author.
E-mail address: [email protected](J.H. Lee).
for long-term energy storage on a large scale (Blanco and Faaij,
2018).
Power-to-X (P2X) is an alternative to batteries for electric energy storage. Herein, various applications come into X such as heat to-Heat), gas fuel to-Gas), liquid fuel (Power-to-Liquid), and chemical compounds (Power-to-Chemical) (Burre et al.,2020). P2X technology can store excess electricity arising from renewable power as chemical bonds in gases or liquids, which have the advantage of high energy density. Thus, it suits the purpose of long-term electricity storage (Blanco and Faaij,
2018). For example, we can utilize carbon dioxide (CO2) as back-bones in synthesis of various organic compounds such as carbon monoxide (CO), acids, alcohols, and hydrocarbons (Jouny et al.,
2018), which are mostly produced with fossil based feedstocks today. Thus, it has the potential to mitigate greenhouse gas (GHG) emissions. Moreover, countries lacking fossil fuel or small islands can improve their energy security by producing fuels domesti-cally (Ölz et al.,2007). Finally, energy stored in such forms can be transported by pre-existing infrastructure and vehicles without extensive modifications and substantial capital investment.
As a promising P2X technology low-temperature (LT) co-electrolysis of CO2and water (H2O) recently has attracted much
https://doi.org/10.1016/j.egyr.2020.03.034
2352-4847/©2020 The Authors. Published by Elsevier Ltd. This is an open access article under the CC BY-NC-ND license ( http://creativecommons.org/licenses/by-nc-nd/4.0/).
762 K. Roh, W. Chung, H. Lee et al. / Energy Reports 6 (2020) 761–770
attention from both academia and even industry (Sánchez et al.,
2019). LT co-electrolysis can produce syngas, a mixture of H2 and CO, at a ratio controlled by suitable choices of catalyst, reactor design, and operation (Sheng et al., 2017). For exam-ple, the H2/CO ratio of
∼
2 fits the synthesis of methanol (Olahet al., 2009) and liquid hydrocarbon (Dry, 2002), whereas the ratio of 1 is suitable for the synthesis of dimethyl ether (DME) (Schakel et al.,2016) and acetic acid (Roh et al.,2018). Also, the produced syngas can be combusted at gas-fired power plants as a supplementary fuel. Compared to other two-step Power-to-Gas pathways such as water electrolysis & reverse water gas shift (RWGS) and water electrolysis & CO2 methanation, the LT co-electrolysis has a simpler system configuration as it requires a one-step processing (i.e., electrolysis) for syngas production (Vennekötter et al., 2019b). Also, we can start-up alkaline or proton exchange membrane (PEM) electrolyzers more quickly than another alternative high-temperature co-electrolysis (also known as solid oxide electrolyzer cell) (Buttler and Spliethoff,
2018). Therefore, the LT co-electrolysis process would be suitable for adjusting the operation to the fluctuation in electricity spot prices and/or availability or offering the capacity to a power grid upon request from a transmission system operator (TSO) for the grid balancing. However, there is a need for the devel-opment of low-cost (i.e., earth-abundant based), efficient, and selective catalysts which can replace the current noble metal-based catalysts such as silver, gold, and platinum (Hernández et al., 2017). Achieving high current density with low overpo-tential (Möller et al.,2019) and mitigating the product crossover (Lin et al.,2019) are other challenges that should be overcome. Also, we should investigate the electrolysis cell design process and electrode configuration, which influence the operation sta-bility, energetic efficient transformation, and product spectrum (Vennekötter et al.,2019b).
No one has yet assessed the LT co-electrolysis technology for the purpose of producing syngas as a fuel for power generation.
Li et al. (2016) and Spurgeon and Kumar (2018) analyzed the economic potential and GHG emissions of the co-electrolysis technology for syngas production, which is subsequently con-verted into liquid fuel through the Fischer–Tropsch Process. Most of other previous studies for LT co-electrolysis technology as-sessment are limited to chemical production (Agarwal et al.,
2011; Jouny et al., 2018; Na et al., 2019; Verma et al., 2016). Furthermore, beyond the standalone analysis, we should ana-lyze how the technology affects existing systems such as energy systems, industries, residential area, and transportation when it is implemented. By definition, P2X is intended to use excess electricity arising from renewable power. Also, if the technology is to produce another form of energy resource, it has to compete with conventional energy resources in terms of costs. Therefore, it is essential to analyze the LT co-electrolysis technology in association with the power generation sector such as the work ofBlanco et al.(2018) andLee(2019).
We analyze the impacts of deploying the LT co-electrolysis technology in the power generation sector in terms of economics and GHG reduction. As a case study, we assume that the LT co-electrolysis technology is commercially introduced to the power generation sector in South Korea from year 2030 and gradually deployed until 2050. CO2captured from gas-fired power plants are to be used as the feedstock. The produced syngas is sub-sequently mixed with natural gas and supplied to the gas-fired power plant to close the carbon cycle. A conceptual design of the syngas production process employing the co-electrolysis is carried out to calculate mass balance, energy demand, and capital investment. Then, a temporal energy system model of Korea from 2020 to 2050 is developed using the TIMES (The Integrated MARKAL-EFOM System (Loulou et al., 2005)) model generator
given the national statistics and outlook data. The model can be used to estimate when and how much excess electricity will be available. Based on the information, the calculation is carried out for how much syngas can be produced via the co-electrolysis and how the GHG emissions and system costs of the power generation sector are influenced. Moreover, key performance parameters of the co-electrolysis process are perturbed to see how significant their influences are on the analysis results.
2. Description of the co-electrolysis process
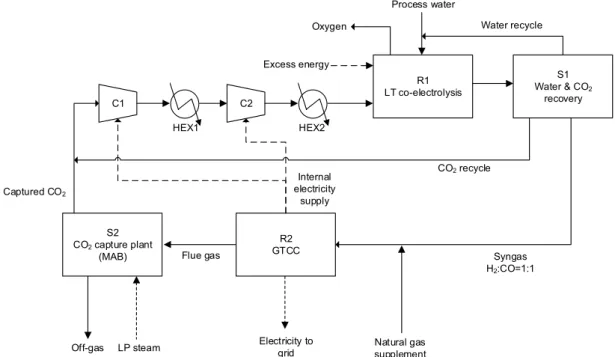
The analyzed systems for the co-electrolysis comprises three sections: the power generation, the CO2 capture, and the co-electrolysis of CO2 and H2O (Fig. 1). In the power generation section (R2), we assume a gas turbine combined cycle (GTCC) power plant that utilizes fuel gas such as methane and syngas. The fuel combustion yields flue gas containing CO2in 3
∼
5 mol.%. In the CO2 capture section (S2), an absorption process using a novel polyamine solvent called MAB (Modulated Amine Blend) is used to capture the CO2present in the flue gas. MAB has been re-ported to outperform the conventional monoethanolamine (MEA) solvent in terms of solvent regeneration energy as well as cost of CO2 avoided (Yun et al., 2018). The low-pressure (LP) steam needed for regenerating the MAB solvent is assumed to be pur-chased from outside. The captured CO2is compressed up to 20 bar via 2-stage compressors and sent to PEM electrolyzer cells (R1). Only the excess electricity is assumed to be used in this process. Deionized process water is supplied to the cells along with CO2. Syngas and oxygen (O2) are produced at the cathode and anode sides, respectively. Most of the unreacted CO2and H2O in R1 are recovered (S1) and recycled. The produced syngas is assumed to be sent back to R2 as the main fuel. Since not all of the CO2 in the flue gas is captured, natural gas is supplemented to close the carbon balance.3. Process simulation and analysis
The overall analysis follows the evaluation procedure for emerging CO2 utilization technologies, proposed by Roh et al. (2019). Process simulation and analysis require a set of input data such as process design specifications, prices, and carbon emission factors. The co-electrolysis technology is currently at TRL3 and is assumed to be available for commercial deployment starting year 2030. Thus, we assume improved performance and economic parameters, e.g., cell overpotential, current density, and purchasing cost of the electrolyzer cells, compared to the current state-of-the-art technologies at a lab-scale (Vennekötter et al.,
2019a,b). The achievable values of such performance parameters in the future are highly uncertain, so three different values are assumed each for the parameters. Other design specifications and assumptions are as follows:
•
GTCC power plants internally supply electricity to the com-pressors for stable operation.•
The energy efficiency of GTCC power plants is constant at 49%, regardless of the co-firing ratio.•
O2byproduct post-treatments such as dehumidification and pressurization are not considered.•
Low pressure (LP) steam for the solvent regeneration is produced at liquid natural gas (LNG) boilers.•
Electric energy demand for the CO2 capture is excluded because it is negligible (Yun et al.,2018).•
The open-circuit potential is 1.281 V, estimated from the standard Gibbs energy. The actual potential is the sum of the open-circuit potential and the cell overpotential.Fig. 1. Block flow diagram of the co-electrolysis process integrated with the GTCC power plant and the MAB-based CO2capture plant.
•
Unreacted CO2 is recovered by pressure swing adsorption (PSA).•
Water and CO2are recovered with 100% purity.•
Capital investments for the water and CO2 recovery units and intercoolers are excluded since they are far lower than those for the electrolyzer cells and compressors.All the primary data assumed in this study are given inTable 1. Given the primary data, secondary data including mass bal-ances and energy demands are calculated using the commercial simulator of Aspen Plus⃝R
. The calculation results are shown in
Table 2. It should be noted that the electric power consump-tion for the co-electrolysis largely dominates the other energy consumptions in all the scenarios.
Based on the calculated secondary data, capital costs of the process are estimated. Total capital investment is calculated by multiplying appropriate factors with total installed cost (TIC).
Fig. 2represents that the PEM electrolyzer cell accounts for the largest portion of TIC in all the scenarios followed by the com-pressors. Because of the large flow rate of the recycled CO2, the TIC of the compressors exceeds that of the CO2capture unit. The multiplication factors and the calculated capital and fixed costs (i.e. operation & maintenance costs) are given in Table S1 and Table S2 in the Supplementary Material (SM), respectively. 4. Analyzing the impacts of deploying the co-electrolysis pro-cesses on the power generation sector in South Korea 4.1. TIMES model description
We develop a temporal energy systems model that mimics the power generation sector in South Korea by using the TIMES model generator (IEA-ETSAP,2019). As the model is data-driven, we need a large amount of input data such as the performance data of 21 different types of power plants, plans for construction and deconstruction of the power plants, forecasts for electricity demand and resource prices, and so on. Solving a linear program in GAMS (General Algebraic Modeling System), we obtain long-term policies such as energy systems configuration, energy flows, energy commodity prices, GHG emissions, capacities of technolo-gies, energy costs, and marginal emissions abatement costs, while
meeting the given constraints (e.g. electricity demand and target GHG reduction) at minimum system cost (IEA-ETSAP,2019).
The basic model structure is referred from Lee (2019). We assume that the electricity supply is allowed to be greater than the electricity demand. The inequality in the place of the usual equality allows for excess electricity generation given the inter-mittency of the solar PV and wind power. 16 time slices (see Table S10 in the SM) are used to represent one year time horizon.
The annual excess electricity (Lee,2019) is calculated by Excess Electricity(t)
=
Pow
er Generation(t)−
Pumped Storage Usage(t)−
Transmission and Distribution Loss(t)−
Electricity Demand(t) Annual Excess Electricity(y)=
ΣtExcess Electricity(t)where t and y indicate time slices and years. The annual system costs are calculated by
System Cost(y)
=
Pow
er Plant Variable Cost(y)+
Pow
er Plant Fixed Cost(y)+
Pow
er Plant Inv
estment Cost(y)+
Fuel Cost(y) Pow
er Plant Variable Cost(y)=
Σe{
Pow
er Generation(y,
e)×
Variable Cost(y,
e)}
Po
w
er Plant Fixed Cost(y)=
Σe{
Pow
er Plant Capacity(y,
e)×
Fixed Cost(y,
e)}
Po
w
er Plant Inv
estment Cost(y)=
Σe{
Pow
er Plant New
Capacity(y,
e)×
Inv
estment Cost(y,
e)}
Fuel Cost(y)
=
Σf{
Fuel Use(y,
f )×
Fuel Price(y,
f )}
where e and f indicate power generation facilities and fuels, respectively. Annual GHG emissions are calculated by
GHG Emissions(y)
=
Σf{
Fuel Use(y,
f )×
Emissions Factor(f )}
Other assumptions used in developing the TIMES model and input data such as Annual Electricity Demand, Emissions Factor and Fuel Price are described in Section2in the SM.
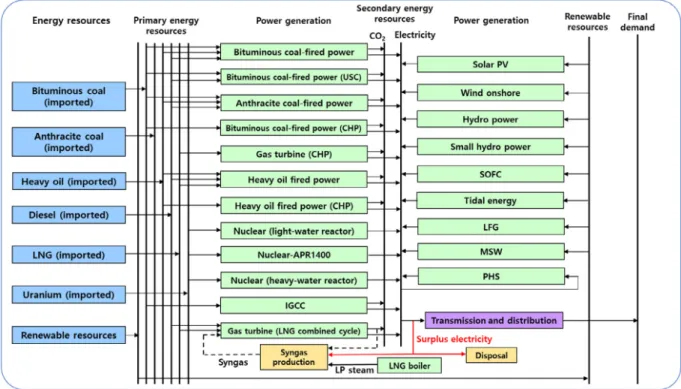
Fig. 3illustrates the reference energy systems represented by the TIMES model. Syngas production is associated with the GTCC
764 K. Roh, W. Chung, H. Lee et al. / Energy Reports 6 (2020) 761–770
Table 1
Primary data of the co-electrolysis process.
Specification Unit Value Note
Co-electrolysis section
Pressure Bar 20 Typical operating range of a PEM
electrolyzer (Carmo et al.,2013)
Temperature ◦
C 40
Cell overpotential V 0.5, 1, 1.5 Own assumption. Around 2V of cell
overpotential was measured at recent lab-scale experiments (Vennekötter et al.,2019a) Current density mA/cm2 200, 350, 500 Own assumption. 150mA/cm2was achieved by
recent lab-scale experiments (Vennekötter et al.,2019a)
Faradaic efficiency %
H2 50 Experimental results
(Vennekötter et al.,2019a)
CO 50
Per-pass CO2conversion rate % 30 Experimental results (Dufek et al.,2011) CO2recovery rate from the syngas % 90 Own assumption
PEM electrolyzer cell purchasing cost USD/m2 1,840, 2,760, 3,680 Own assumption. 1,840 USD/m2was assumed byJouny et al.(2018) for alkaline electrolyzers. IEA(2015) reported that PEM electrolyzers are twice as expensive as alkaline electrolyzers.
Power generation section
Net power generation GW 1
GTCC efficiency % 49
CO2capture section
CO2capture rate % 90 Own assumption
MAB solvent regeneration energy GJ/tonCO2 2.81 Simulation results (Yun et al.,2018)
Compressor efficiency % 80
Table 2
Secondary data of the co-electrolysis process — Mass balance and energy demand.
Specification Unit Value
Mass balance
Product
Syngas production rate ton/GJEl 0.149 (Heat flow rate – LHV basis) (GJ/GJEl) (1.939) Oxygen production rate ton/GJEl 0.118 CO2
Captured CO2flow rate ton/GJEl 0.201 Recycled CO2flow rate ton/GJEl 0.341 Emitted CO2flow rate ton/GJEl 0.022 Process water feed rate ton/GJEl 0.067 Thermal energy demand
Steam demand for CO2capture GJ/GJEl 0.563 Natural gas supplement (LHV basis) GJ/GJEl 0.396 Electric energy demand
Power demand for co-electrolysis GJ/GJEl (0.5V) 2.540 (1.0V) 2.896 (1.5V) 3.253
CO2compression GJ/GJEl 0.144
Other energy demand
Cooling water GJ/GJEl 0.154
Fig. 2. Breakdown of the TIC for three different PEM electrolyzer cell prices. Current density of the base case (350 mA/cm2) is assumed.
power plants. Capturing CO2 in the flue gas emitted from the GTCC power plants, we produce the syngas via the co-electrolysis
and supply it to the GTCC power plant as the feed. In South Korea there is no electricity balancing market for grid stabilization
Fig. 3. Illustration of the Korean energy systems adopted by the TIMES model developed. and the excess electricity is disposed, so we assume that excess
electricity is either consumed by the co-electrolysis process with-out any cost or simply disposed when the syngas production is economically not competitive to importing LNG. The LNG boiler is used to supply the LP steam for regenerating the MAB solvent in the CO2capture.
4.2. Scenario description
Table 3represents five key parameters of the co-electrolysis process in three different cases. The values of the cell over-potential, current density and the capital investment for the electrolyzer cells are the same as in Section 2. The maximum allowable co-firing ratio of the syngas to the typical imported nat-ural gas (Kyungdong City Gas,2019) is 2.1%, which complies with the minimum CH4content limit (85 mol.%,Choi(2004)) of natural gas transported via pipeline in South Korea. Twice and one half of the value for the co-firing ratio in the base case are assumed for the high and low performance cases, respectively. The annual availability of the co-electrolysis process for the high performance case (95%) is taken fromLee(2019), and we reduced it by 5% and 10% for the base and low performance cases, respectively.
We generate 14 scenarios as listed inTable 4. Scenario 1 is the baseline scenario that allows for deploying the co-electrolysis process. Scenario 2 to 11 are intended to investigate sensitivity of the five key parameters of the co-electrolysis process. Scenario 12 and 13 are two extreme cases. Finally, Scenario 14 is the reference scenario that does not allow for deploying the co-electrolysis process.
4.3. Analysis results 4.3.1. Reference scenario
For the reference scenario where the syngas production via the co-electrolysis is not considered, the power capacity and electricity generation of each power source from 2020 to 2050 are calculated using the TIMES model we developed. Here, we by the TIMES model developed power capacity and generation
of electricity where the co-electrolysis-based syngas production plant is not considered. In order to meet the electricity demand forecasted (see Figure S1 in the SM), the total power capacity and total electricity generation increase by 58.6% and 11.9%, respec-tively, from year 2020 to 2050, as shown inFig. 4. The portions of solar PV and wind power in the capacity as well as in the actual power generation greatly increase while those of nuclear, coal-fired, and gas-fired power plants gradually decrease. In particular, the solar PV accounts for the biggest portion of the total power capacity from year 2032. Nevertheless, it does not supply the largest amount of electricity due to its low annual availability (15%). GTCC power plants are often operated at part loads as their major role is to meet the peak demand. Thus, their contribution to the power generation is not as big as to the power capacity. In contrast, the coal-fired and nuclear power plants are responsible for the base load, so they keep high utilization rates. Because of the large amount of renewable power introduced to the energy systems, the overall GHG emissions are gradually decreasing over the years (Fig. 5).
4.3.2. Excess electricity
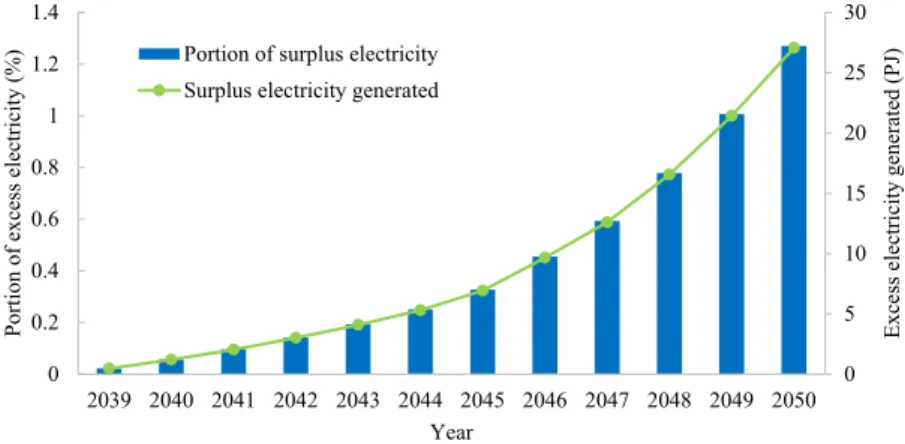
Excess electricity originates from the discrepancy between electricity generation and demand. Such a gap especially arises due to intermittent solar and wind energy. In the TIMES model, we impose an inequality constraint instead of the usual equality constraint, which allowed the total electricity generation to sur-pass the total electricity demand. As shown inFig. 6, the year of 2039 is the first moment when the excess electricity is generated. Until then, no excess electricity is found as the total electricity demand is met by flexible operation of the conventional power sources such as coal-fired and gas-fired power plants and hy-dropower. As time goes by, more excess electricity is generated due to the increased capacities of solar PV and wind power in the power generation sector. The excess electricity accounts for as high as 1.27% of the total electricity production in 2050.
766 K. Roh, W. Chung, H. Lee et al. / Energy Reports 6 (2020) 761–770
Table 3
Five key parameters of the co-electrolysis process and their values in three different cases.
Unit High performance Base case Low performance
Cell overpotential V 0.5 1.0 1.5
Current density mA/cm2 500 350 200
Capital investment for electrolyzer cells USD/m2 1,840 2,760 3,680 Co-firing ratio (heating value basis) % 4 2.1 1
Annual availability % 95 90 85
Table 4
The list of scenarios. B indicates the base case, H the high performance case, and L the low performance case inTable 3. Scenario # Cell overpotential Current density Capital investment for electrolyzer cells
Co-firing ratio Annual availability Note 1 B B B B B Baseline scenario 2 H B B B B Cell overpotential sensitivity 3 L B B B B 4 B H B B B Current density sensitivity 5 B L B B B
6 B B H B B Cell purchasing cost
sensitivity 7 B B L B B 8 B B B H B Co-firing ratio sensitivity 9 B B B L B 10 B B B B H Annual availability sensitivity 11 B B B B L
12 H H H H H Most optimistic scenario
13 L L L L L Most pessimistic scenario
14 N/A N/A N/A N/A N/A Reference scenario
(No syngas production)
Fig. 4. Distributions of the power generation capacity (top) and electricity production (bottom) from 2020 to 2050 calculated by the TIMES model. Excess electricity
Fig. 5. GHG emissions from the power generation sector in South Korea from 2020 to 2050 in the reference scenario. Excess electricity generation is allowed while
no syngas production is considered. A drop in GHG emissions in 2023 is due to the decrease in the power generation from coal-fired power plants. In 2024, the emissions are increased due to the decrease in the nuclear power capacity, which is compensated by the coal-fired power plants.
Fig. 6. The amount of excess electricity generated and its portion out of the total electricity production calculated by the TIMES model. No excess electricity is
generated before 2039.
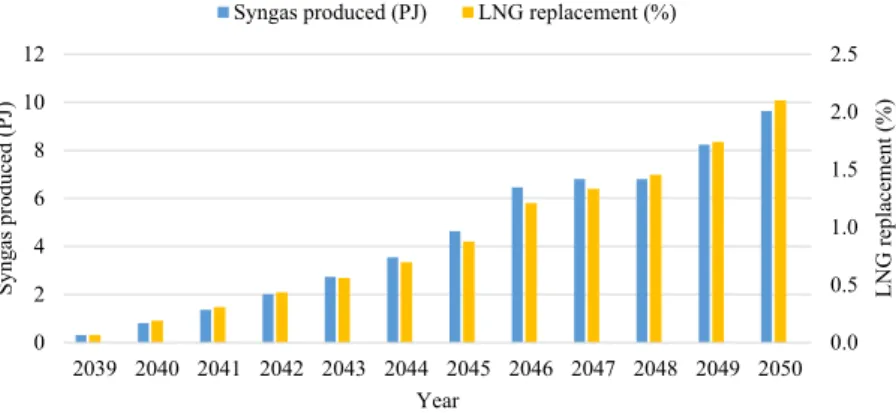
4.3.3. Introducing syngas production via the co-electrolysis When the excess electricity is available and the syngas produc-tion is cheaper than purchasing the LNG, the syngas is produced by the co-electrolysis. In the baseline scenario, the amount of the syngas produced and the LNG replaced are increased over the year, as shown inFig. 7. Also, the increase in the available excess electricity results in the increase in the syngas production. As a result, 2.1% of the total LNG is replaced by the syngas in 2050. As shown inFig. 8, the co-electrolysis process fully utilizes the available excess electricity until 2046. After that, the utilization rate is decreased as the co-firing ratio (2.1%) constraint comes into effect. Thus, the syngas production remains the same from 2047 to 2048. Only 53.2% of the available excess electricity is con-sumed by the co-electrolysis in 2050. Note that the deployment of the co-electrolysis process does not significantly change the composition of the entire power system as the amount of excess electricity available is small compared to the total electricity generated.
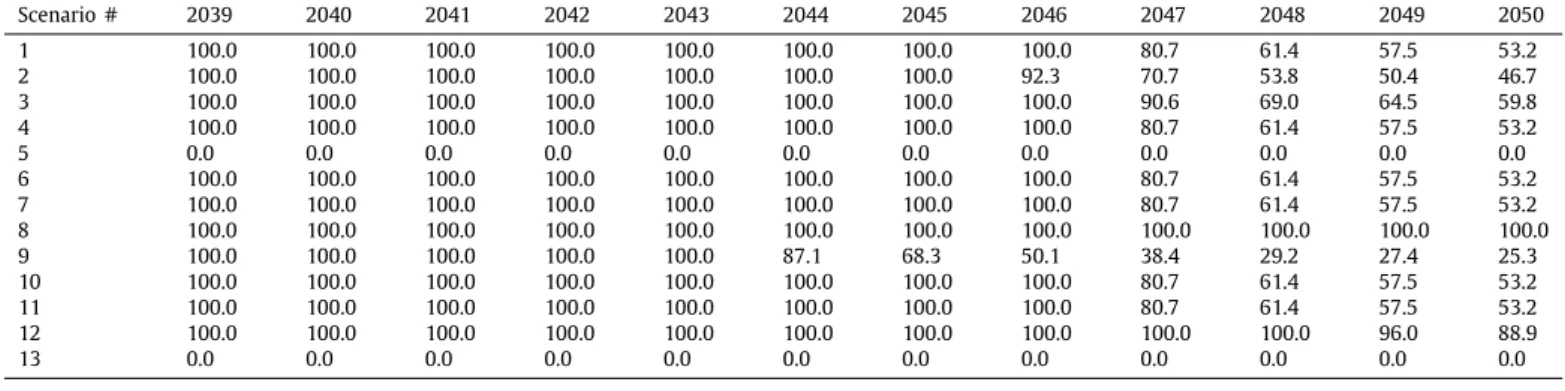
Table 5 represents how the key parameters of the co-electrolysis process affect the utilization rate of the excess elec-tricity. More excess electricity is consumed by the co-electrolysis process in Scenario 2 than in Scenario 1. In Scenario 2, due to the lower cell overpotential, less electricity is needed for the syngas production than in Scenario 1. The opposite trend appears in Scenario 3. In Scenario 5, due to the low current density, the total cost for purchasing the electrolyzer cells makes the syngas production cost higher than the LNG purchase price. Therefore,
the syngas is never produced in spite of the free excess electricity. In Scenario 8 and 9, the changes in the co-firing ratio, a key lim-iting factor, significantly affect the utilization rate of the excess electricity. In Scenario 8, the excess electricity is always fully utilized whereas in Scenario 9 only 25.3% of the excess electricity is consumed in 2050. In Scenario 4, 6, 7, 10 and 11, the amount of the syngas produced is not affected by the perturbed parameters as they are not the limiting factors, so the utilization rates are the same as in Scenario 1. Less excess electricity is consumed in Scenario 12, the most optimistic scenario, than in Scenario 8. However, more syngas is produced (18.4 PJ in 2050) in that scenario than in Scenario 6 (18.1 PJ in 2050) due to the lower cell overpotential in the former. In Scenario 13, the most pessimistic scenario, no syngas is produced so that the utilization rates are zero during the whole period.
4.3.4. GHG reduction and system cost saving
GHG emissions in the power generation sector are mitigated by deploying the co-electrolysis processes, as depicted inFig. 9. 0.91 and 0.48 MtonCO2eq could potentially be reduced in year 2050 in the baseline (Scenario 1) and optimistic (Scenario 12) scenarios, respectively. Such reductions are equivalent to 0.40% and 0.21% reduction in the GHG emissions with respect to the reference scenario.
The overall power system cost is reduced as the syngas pro-duction replaces the purchase of LNG for GTCC power plants. As shown inFig. 10, the savings in the system cost per ton of CO"-2 -equivalent avoided in both the optimistic and baseline scenarios
768 K. Roh, W. Chung, H. Lee et al. / Energy Reports 6 (2020) 761–770
Fig. 7. The amount of syngas produced and the percentage of LNG replacement for gas-fired power generation from 2039 to 2050 in Scenario 1.
Fig. 8. Utilization rate of the excess electricity from 2039 to 2050 in Scenario 1. 100% indicates all the excess electricity is used for the syngas production while 0%
means it is completely disposed.
Fig. 9. Reduction in GHG emissions by deploying the co-electrolysis processes from 2039 to 2050 in Scenario 1 (baseline) and 12 (optimistic). are slightly increasing over the years. Such increases arise from
the trend of the LNG price, which is assumed to increase over the time horizon (see Table S5 in the SM). Compared to Scenario 1, 190% higher saving is expected for Scenario 12 due to the lower syngas production cost. Note that the performance (e.g., power demand) and economic parameters (e.g., capital investment) of the syngas production are assumed to be constant in this study, so it results in the constant syngas production cost.
GHG reduction and system cost savings for all the scenarios are given in Table S11 and S12 in Section 3 of the SM, respectively.
5. Conclusion
The impacts of deploying the co-electrolysis of CO2 and H2O utilizing excess electricity in the power generation sector in South Korea are investigated. In the studied scenario, syngas is produced via the low-temperature co-electrolysis for power generation at gas-fired combined cycle power plants. To this end, a conceptual design of the co-electrolysis process is carried out to obtain the key input data required for the temporal national energy systems model (i.e., the TIMES model). Then the model is used to simulate the power generation sector for next 30 years (2020
∼
2050). We found that deploying the co-electrolysis process could reduce the national greenhouse gas emissions while saving the system costs by replacing liquid natural gas purchase for gas-fired combinedTable 5
Utilization rates of excess electricity for the syngas production via the co-electrolysis. 100% indicates all the excess electricity is used for the syngas production while 0% does it is completely disposed.
Scenario # 2039 2040 2041 2042 2043 2044 2045 2046 2047 2048 2049 2050 1 100.0 100.0 100.0 100.0 100.0 100.0 100.0 100.0 80.7 61.4 57.5 53.2 2 100.0 100.0 100.0 100.0 100.0 100.0 100.0 92.3 70.7 53.8 50.4 46.7 3 100.0 100.0 100.0 100.0 100.0 100.0 100.0 100.0 90.6 69.0 64.5 59.8 4 100.0 100.0 100.0 100.0 100.0 100.0 100.0 100.0 80.7 61.4 57.5 53.2 5 0.0 0.0 0.0 0.0 0.0 0.0 0.0 0.0 0.0 0.0 0.0 0.0 6 100.0 100.0 100.0 100.0 100.0 100.0 100.0 100.0 80.7 61.4 57.5 53.2 7 100.0 100.0 100.0 100.0 100.0 100.0 100.0 100.0 80.7 61.4 57.5 53.2 8 100.0 100.0 100.0 100.0 100.0 100.0 100.0 100.0 100.0 100.0 100.0 100.0 9 100.0 100.0 100.0 100.0 100.0 87.1 68.3 50.1 38.4 29.2 27.4 25.3 10 100.0 100.0 100.0 100.0 100.0 100.0 100.0 100.0 80.7 61.4 57.5 53.2 11 100.0 100.0 100.0 100.0 100.0 100.0 100.0 100.0 80.7 61.4 57.5 53.2 12 100.0 100.0 100.0 100.0 100.0 100.0 100.0 100.0 100.0 100.0 96.0 88.9 13 0.0 0.0 0.0 0.0 0.0 0.0 0.0 0.0 0.0 0.0 0.0 0.0
Fig. 10. Savings in the entire power system cost due to deploying the co-electrolysis process from 2039 to 2050 in Scenario 1 (baseline) and 12 (optimistic). cycle power plants. Among the uncertain parameters of the
co-electrolysis, the cell overpotential and current density affect the syngas production cost and the produced amount most signifi-cantly. In addition, the co-firing ratio constraint and the amount of excess electricity available acted as the limiting factors.
Several issues remain to be tackled. Uncertainty arising from the renewable power generation needs to be addressed in the analysis.KPX(2018) reported that the estimation of the electricity generated by solar photovoltaic and wind power differs from the measurement by 5
∼
15% and 8.4∼
19%, respectively. Therefore, the potential impacts of the co-electrolysis process on the en-ergy system could be bigger as more excess electricity would be available than we calculated. Moreover, it should be investigated whether the co-firing with syngas at gas-fired combined cycle power plants results in different power generation efficiencies and reflect the difference in the analysis. Also, O2 by-product resulting from the co-electrolysis should be considered in the TIMES model for more accurate analysis. A main challenge is the lack of reliable data on manufacturing, supply, and demand of O2 in South Korea. Finally, other Power-to-X technologies such as Power-to-Methane or Power-to-H2 should be introduced to the TIMES model so that they compete with one another for excess electricity available.Declaration of competing interest
The authors declare that they have no known competing finan-cial interests or personal relationships that could have appeared to influence the work reported in this paper.
CRediT authorship contribution statement
Kosan Roh: Conceptualization, Methodology, Writing - orig-inal draft, Visualization. Wonsuk Chung: Methodology, Writing - review & editing. Hyejin Lee: Conceptualization, Methodology, Resources, Writing - review & editing. Seungman Park: Concep-tualization, Methodology, Resources, Writing review & editing. Jay H. Lee: Writing - review & editing, Supervision, Funding acquisition.
Acknowledgments
The authors gratefully acknowledge funding by Korea Carbon Capture & Sequestration R&D Center (KCRC) under the project # NRF 2015M1A8A1076118. We are also grateful to Prof. Young Gu Park and Matthias Heßelmann for fruitful discussions.
Appendix A. Supplementary data
Supplementary material related to this article can be found online athttps://doi.org/10.1016/j.egyr.2020.03.034.
References
Agarwal, A.S., Zhai, Y., Hill, D., Sridhar, N., 2011. The electrochemical reduction of carbon dioxide to formate/formic acid: Engineering and economic feasibility. ChemSusChem 4, 1301–1310.http://dx.doi.org/10.1002/cssc.201100220. Blanco, H., Faaij, A., 2018. A review at the role of storage in energy systems with
a focus on power to gas and long-term storage. Renew. Sustain. Energy Rev 81, 1049–1086.http://dx.doi.org/10.1016/j.rser.2017.07.062.
770 K. Roh, W. Chung, H. Lee et al. / Energy Reports 6 (2020) 761–770
Blanco, H., Nijs, W., Ruf, J., Faaij, A., 2018. Potential of power-to-methane in the EU energy transition to a low carbon system using cost optimization. Appl. Energy 232, 323–340.http://dx.doi.org/10.1016/j.apenergy.2018.08.027. Burre, J., Bongartz, D., Brée, L., Roh, K., Mitsos, A., 2020. Power-to-X: Between
electricity storage, e-production, and demand side management. Chem. Ing. Tech. 92, 74–84.http://dx.doi.org/10.1002/cite.201900102.
Buttler, A., Spliethoff, H., 2018. Current status of water electrolysis for energy storage, grid balancing and sector coupling via to-gas and power-to-liquids: A review. Renew. Sustain. Energy Rev. 82, 2440–2454. http: //dx.doi.org/10.1016/j.rser.2017.09.003.
Carmo, M., Fritz, D.L., Mergel, J., Stolten, D., 2013. A comprehensive review on PEM water electrolysis. Int. J. Hydrogen Energy 38, 4901–4934. http: //dx.doi.org/10.1016/j.ijhydene.2013.01.151.
Choi, I., 2004. Establishment of natural gas composition standards. [WWW Document]. Today Energy. URLhttp://www.todayenergy.kr/news/articleView. html?idxno=12343. (Accessed 3 February 2019).
Dry, M.E., 2002. High quality diesel via the Fischer–Tropsch process - A review. J. Chem. Technol. Biotechnol 77, 43–50.http://dx.doi.org/10.1002/jctb.527. Dufek, E.J., Lister, T.E., McIlwain, M.E., 2011. Bench-scale electrochemical system
for generation of CO and syn-gas. J. Appl. Electrochem. 41, 623–631.http: //dx.doi.org/10.1007/s10800-011-0271-6.
Hernández, S., Farkhondehfal, M.Amin., Sastre, F., Makkee, M., Saracco, G., Russo, N., 2017. Syngas production from electrochemical reduction of CO2 : current status and prospective implementation. Green Chem. 19, 2326–2346. http://dx.doi.org/10.1039/C7GC00398F.
IEA, Technology Roadmap: Hydrogen and Fuel Cells. Paris, France.
IEA-ETSAP, 2019. Overview of TIMES modelling tool. [WWW Document]. URL https://iea-etsap.org/index.php/etsap-tools/model-generators/times. (Accessed 10 July 2019).
Jouny, M., Luc, W., Jiao, F., 2018. General techno-economic analysis of CO2 electrolysis systems. Ind. Eng. Chem. Res. 57, 2165–2177.http://dx.doi.org/ 10.1021/acs.iecr.7b03514.
KPX, 2018. Advancing the Forecast System of Renewable Power Generation in Jeju. Naju-si, Jeollanam-do, South Korea.
Kyungdong City Gas, 2019. LNG. [WWW Document]. URL http://mafra-win. korcham.net/nFile/Consult/Business/consult_20140616122122.PDF. (Accessed 4 May 2019).
Lee, H., 2019. Energy Technologies for Variable Renewable Energy in Power Generation Sector: Focusing on BECCU, Power to Gas Technologies. Ph.D. dissertation. Seoul National University.
Li, X., Anderson, P., Jhong, H.-R.M., Paster, M., Stubbins, J.F., Kenis, P.J.A., 2016. Greenhouse gas emissions, energy efficiency, and cost of synthetic fuel production using electrochemical CO2 conversion and the Fischer– Tropsch process. Energy & Fuels 30, 5980–5989.http://dx.doi.org/10.1021/ acs.energyfuels.6b00665.
Lin, M., Han, L., Singh, M.R., Xiang, C., 2019. An experimental- and simulation-based evaluation of the CO2 utilization efficiency of aqueous-simulation-based electro-chemical CO2 reduction reactors with ion-selective membranes. ACS Appl. Energy Mater. 2, 5843–5850.http://dx.doi.org/10.1021/acsaem.9b00986. Loulou, R., Remne, U., Kanudia, A., Lehtila, A., Goldsein, G., 2005. Documentation
for the TIMES Model. Part I - TIMES Concepts and Theory.
Möller, T., Ju, W., Bagger, A., Wang, X., Luo, F., Ngo Thanh, T., Varela, A.S., Rossmeisl, J., Strasser, P., 2019. Efficient CO2 to CO electrolysis on solid Ni–N–C catalysts at industrial current densities. Energy Environ. Sci. 12, 640–647.http://dx.doi.org/10.1039/C8EE02662A.
Na, J., Seo, B., Kim, J., Lee, C.W., Lee, H., Hwang, Y.J., Min, B.K., Lee, D.K., Oh, H., Lee, U., 2019. General technoeconomic analysis for electrochemical coproduction coupling carbon dioxide reduction with organic oxidation. Nat. Commun. 10, 5193.http://dx.doi.org/10.1038/s41467-019-12744-y. OECD/IEA, 2018. Global Energy & CO2 Status Report 2017.
Olah, G.A., Goeppert, A., Prakash, G.K.S., 2009. Beyond Oil and Gas: The Methanol Economy, second ed.http://dx.doi.org/10.1002/9783527627806.
Ölz, S., Sims, R., Kirchner, N., 2007. Contribution of Renewables to Energy Security. IEA Information Paper.
Roh, K., Burre, J., Bongartz, D., Lee, S.J.H., Chung, W., Han, D., König, A., Deutz, S., Bardow, A., Lee, J.H., Mitsos, A., 2019. TRL-based guidelines for early-stage evaluation of CO2 Utilization technologies. In: The 17th International Conference on Carbon Dioxide Utilization (ICCDU 2019), 23 - 27 June 2019, Aachen, Germany.
Roh, K., Lim, H., Chung, W., Oh, J., Yoo, H., Al-Hunaidy, A.S., Imran, H., Lee, J.H., 2018. Sustainability analysis of CO2 capture and utilization processes using a computer-aided tool. J. CO2 Util. 26, 60–69.http://dx.doi.org/10.1016/j.jcou. 2018.04.022.
Sánchez, O.G., Birdja, Y.Y., Bulut, M., Vaes, J., Breugelmans, T., Pant, D., 2019. Re-cent advances in industrial CO2 electroreduction. Curr. Opin. Green Sustain. Chem. 16, 47–56.http://dx.doi.org/10.1016/j.cogsc.2019.01.005.
Schakel, W., Oreggioni, G., Singh, B., Strømman, A., Ramírez, A., 2016. Assessing the techno-environmental performance of CO2 utilization via dry reforming of methane for the production of dimethyl ether. J. CO2 Util. 16, 138–149. http://dx.doi.org/10.1016/j.jcou.2016.06.005.
Schimpe, M., Naumann, M., Truong, N., Hesse, H.C., Santhanagopalan, S., Saxon, A., Jossen, A., 2018. Energy efficiency evaluation of a stationary lithium-ion battery container storage system via electro-thermal modeling and detailed component analysis. Appl. Energy 210, 211–229.http://dx.doi. org/10.1016/j.apenergy.2017.10.129.
Sheng, W., Kattel, S., Yao, S., Yan, B., Liang, Z., Hawxhurst, C.J., Wu, Q., Chen, J.G., 2017. Electrochemical reduction of CO2 to synthesis gas with controlled CO/H 2 ratios. Energy Environ. Sci. 10, 1180–1185.http://dx.doi.org/10.1039/ C7EE00071E.
Spurgeon, J.M., Kumar, B., 2018. A comparative technoeconomic analysis of pathways for commercial electrochemical CO2 reduction to liquid products. Energy Environ. Sci. 11, 1536–1551.http://dx.doi.org/10.1039/C8EE00097B. Vennekötter, J.-B., Scheuermann, T., Sengpiel, R., Wessling, M., 2019a. The elec-trolyte matters: Stable systems for high rate electrochemical CO2 reduction. J. CO2 Util. 32, 202–213.http://dx.doi.org/10.1016/j.jcou.2019.04.007. Vennekötter, J.-B., Sengpiel, R., Wessling, M., 2019b. Beyond the catalyst: How
electrode and reactor design determine the product spectrum during elec-trochemical CO2 reduction. Chem. Eng. J. 364, 89–101.http://dx.doi.org/10. 1016/j.cej.2019.01.045.
Verma, S., Kim, B., Jhong, H.-R., Molly, Ma, S., Kenis, P.J.A., 2016. A gross-margin model for defining technoeconomic benchmarks in the electroreduction of CO2. ChemSusChem 9, 1972–1979.http://dx.doi.org/10.1002/cssc.201600394. Yun, S., Lee, S., Oh, S., Kim, J.-K., 2018. Techno-economic analysis for post-combustion CO2 capture. In: 8th Korea CCUS International Conference, 24-26 January 2018, Jeju, South Korea.