• 검색 결과가 없습니다.

Associations between gene expression profiles of invasive breast cancer and Breast Imaging Reporting and Data System MRI lexicon

N/A
N/A
Protected

Academic year: 2021

Share "Associations between gene expression profiles of invasive breast cancer and Breast Imaging Reporting and Data System MRI lexicon"

Copied!
100
0
0

로드 중.... (전체 텍스트 보기)

전체 글

(1)

Annals of Surgical Treatment and Research

Associations between gene expression profiles of

invasive breast cancer and Breast Imaging Reporting

and Data System MRI lexicon

Ga Ram Kim, You Jin Ku, Soon Gu Cho, Sei Joong Kim

1

, Byung Soh Min

2

Departments of Radiology and

1

Surgery, Inha University Hospital, Inha University School of Medicine, Incheon,

2

Department of

Surgery, Severance Hospital, Yonsei University College of Medicine, Seoul, Korea

INTRODUCTION

Better understanding of the biological behavior and prog nosis

of each subtype of breast cancer has become a critical issue in

patient management because breast cancer is a hetero geneous

disease in which each distinct subtype shows as distin gui shable

clinical course and prognosis [1­3]. In clinical practice, im mu­

no histochemical criteria has been established to define breast

cancer subtypes with the use of different prognostic informa­

tion and treatment approaches have been tailored according to

immunohistochemical subtype [1].

Since a small piece of cancer mass, a size generally used for

immunohistochemical staining, cannot sufficiently reflect the

whole breast cancer burden, there have been many reports

that describe the imaging characteristics of each subtype [4­

7]. To note, breast MRI has offered not only structural but also

functional properties of cancers analyzed mainly with com­

pu terized calculation [6,8]. Furthermore, as more studies have

been published on the gene expression profiles of breast cancer

[9], several studies have focused on the relationship between

gene expression and computer­derived MRI phenotypes of

breast cancer to propose noninvasive prognostic biomarkers

Purpose:

To evaluate whether the Breast Imaging Reporting and Data System (BI-RADS) MRI lexicon could reflect the

geno mic information of breast cancers and to suggest intuitive imaging features as biomarkers.

Methods:

Matched breast MRI data from The Cancer Imaging Archive and gene expression profile from The Cancer

Genome Atlas of 70 invasive breast cancers were analyzed. Magnetic resonance images were reviewed according to the

BI-RADS MRI lexicon of mass morphology. The cancers were divided into 2 groups of gene clustering by gene set enrichment

an alysis. Clinicopathologic and imaging characteristics were compared between the 2 groups.

Results:

The luminal subtype was predominant in the group 1 gene set and the triple-negative subtype was predominant

in the group 2 gene set (55 of 56, 98.2% vs. 9 of 14, 64.3%). Internal enhancement descriptors were different between the 2

groups; heterogeneity was most frequent in group 1 (27 of 56, 48.2%) and rim enhancement was dominant in group 2 (10 of

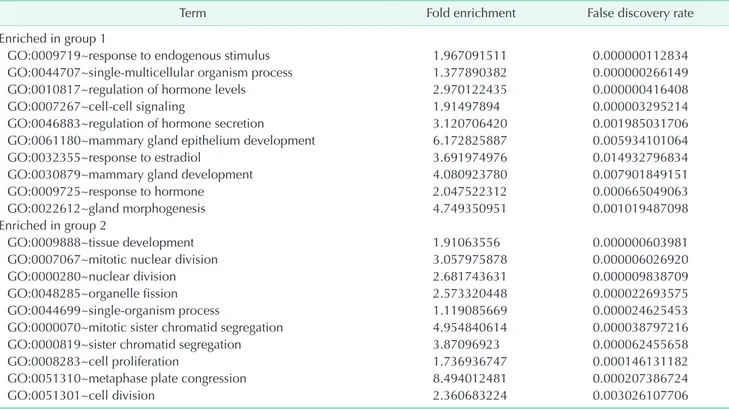
14, 71.4%). In group 1, the gene sets related to mammary gland development were overexpressed whereas the gene sets

related to mitotic cell division were overexpressed in group 2.

Conclusion:

We identified intuitive imaging features of breast MRI associated with distinct gene expression profiles using

the standard imaging variables of BI-RADS. The internal enhancement pattern on MRI might reflect specific gene ex

pres-sion profiles of breast cancers, which can be recognized by visual distinction.

[Ann Surg Treat Res 2017;93(1):18-26]

Key Words:

Breast neoplasms, Magnetic resonance imaging, Gene expression profiling

Reviewed

January

February

March

April

May

June

July

August

September

October

November

December

Received December 28, 2016, Revised February 10, 2017,

Accepted February 13, 2017

Corresponding Author: Byung Soh Min

Department of Surgery, Severance Hospital, Yonsei University College of

Medicine, 50-1 Yonsei-ro, Seodaemun-gu, Seoul 03722, Korea

Tel: +82-2-2228-2100, Fax: +82-2-313-8289

E-mail: bsmin@yuhs.ac

Copyright ⓒ 2017, the Korean Surgical Society

cc Annals of Surgical Treatment and Research is an Open Access Journal. All

articles are distributed under the terms of the Creative Commons Attribution

Non-Commercial License (http://creativecommons.org/licenses/by-nc/4.0/) which

permits unrestricted non-commercial use, distribution, and reproduction in any

medium, provided the original work is properly cited.

(2)

through MRI [10­13]. However, computer­derived calculated

parameters might be difficult to apply in actual routine practice,

because the interpretation of breast MRI is generally based on

the Breast Imaging Reporting and Data System (BI­RADS) by the

American College of Radiology; to our knowledge, a study on

the gene expression of breast cancers according to the BI­RADS

MRI lexicon has not been reported.

Therefore, we intended to evaluate whether the BI­RADS MRI

lexicon could reflect the genomic information of breast cancers

by matching data sets of breast MRI from The Cancer Imaging

Archive (TCIA) and gene expression profiles from The Cancer

Genome Atlas (TCGA) and to suggest intuitive imaging features

as biomarkers rather than complicated computer­derived

parameters [14,15].

METHODS

Study sample

Open data accessible to the public which included clinical,

pathologic, and immunohistochemical stain information were

downloaded from TCGA and TCIA (http://www.cancerim­

agingarchive.net/); the data were de­identified. Eighty­six

patients had breast MRI results available that corresponded

to TCGA data. Sixteen out of the 86 patients were excluded

for the following reasons: uncertain visualization of a proven

malignancy on magnetic resonance (MR) images (n = 4) and

nonmass enhancement on MR images as a proven malignancy

(n = 12). Finally, a total of 70 patients (median age, 54.5 years;

interquartile rage, 45.7–63.3 years) were included in this study.

We downloaded breast cancer level 3 mRNA microarray data

from the Genomic Data Analysis Center Firehorse website

(http://gdac.broadinstitute.org/) [16]. The data set was a median­

based integrated expression data set assembled using column­

centered level 3 data. The immunohistochemical subtypes of

breast cancers determined by estrogen receptor (ER), pro ges­

terone receptor (PR) and human epidermal growth factor re­

cep tor type 2 (HER2) statuses were categorized according to the

clinical guideline issued by the American Society of Clinical

Oncology and the College of American Pathology [15,17,18]. The

subtypes were classified as follows according to ER, PR, and

HER2: luminal (ER positive or PR positive, regardless of HER2

positivity [luminal A, luminal B and luminal­HER2 types were

all included); HER2­enriched (ER negative, PR negative, and

HER2 positive); and triple­negative (ER negative, PR negative,

and HER2 negative) subtypes [1,2].

Image analysis

Two radiologists (GRK and YJK) with 6 and 8 years of breast

im aging experience reviewed the 70 MRI examinations ac­

cord ing to BI­RADS and were blinded to TCGA data [19]. They

assessed the lesion on DICOM files by using a picture archiving

and communication system (Maroview 5.4; Innfinitt, Seoul,

Korea) with high­resolution monitors. The MR images for the

70 cancers were analyzed based on the BI­RADS MRI lexicon for

shape, margin and internal enhancement characteristics whereas

the kinetic curve assessment was not performed since not all

MRI examinations included 1 precontrast and 5 postcontrast

examinations. BI­RADS lexicon was assigned by the 2 readers in

consensus for all 70 cases. Tumor size was determined on the

postcontrast axillar or sagittal images, from whichever image was

available, and the largest diameter of the 3­dimensional planes

was considered the tumor size. Multiplicity was determined

when multifocal or multicentric lesions were detected.

Frequency analysis was done with the Mann­Whitney U­test

for continuous variables and the chi­square test or Fisher exact

test for categorical or ordinal variables. Statistical analysis was

performed using IBM SPSS Statistics ver. 19.0 (IBM Co., Armonk,

NY, USA), and statistical significance was defined when P­values

< 0.05.

Microarray data analysis

The lowess normalized mRNA expression microarray data

set of 70 cases with matching MRI imaging data was used for

analysis. After removing outliers, the data set was filtered to

include the most varying 5,000 genes. Unsupervised hierarchical

clustering was performed to group samples with similar gene

expression signatures. The Limma package was then used to

identify differentially expressed genes in each cluster [20].

After calculating the differential expression between clusters,

gene signatures were generated by choosing genes that met

the selection criteria of a fold change greater than 2 and a false

discovery rate (FDR) of less than 0.05. Subsequent functional

annotation analysis was performed using DAVID [21]. Gene

Set Enrichment Analysis (GSEA) was done using GSEA software

distributed from the MIT Broad institute website (http://software.

broadinstitute.org/gsea) [22,23]. For GSEA, we used all sets from

Molecular Signatures Database (MSigDB) version 5.2 [22]. After

calculating the enrichment score (ES) for each signature (gene

set), significant signatures with a FDR < 25% were chosen.

When no signature met the criteria of a FDR < 25%, signatures

with a nominal P­value < 0.01 were selected instead.

RESULTS

Patient characteristics

Of the 70 patients with matched TCIA MR images and TCGA

microarray gene expression profile data, 67 (95.7%) were white

females. All 70 had invasive breast cancers; the pathologic

stage was stage I or II in 62 out of 70 patients (88.6%). Invasive

carcinoma of no special type was the most frequent breast

cancer (n = 63, 90.0%). Immunohistochemical subtypes of the

70 cancers were as follows: luminal (n = 58, 82.9%); HER2­

(3)

enriched (n = 2, 2.9%); and triple­negative (n = 10, 14.3%) (Table

1). The location of the cancers were relatively evenly distributed

in both breasts (Table 1).

Clinicopathologic and MRI characteristics according

to subtype found by unsupervised hierarchical

clustering of the gene expression profile

To investigate potential subgroups of breast cancer, we

applied unsupervised hierarchical cluster analysis to TCGA

micro array gene expression data set and found 2 major sub­

Table 1. Baseline characteristics of 70 women with invasive

breast cancers as masses on breast MRI

Characteristic

Value

Age at diagnosis (yr)

54.5 (45.7–63.3)

Race

White

67 (95.7)

Black

3 (4.3)

Median size of invasive cancers (mm)

21.0 (16–27)

AJCC stage

Carcinoma in situ

0 (0)

Invasive, stage I

14 (20.0)

Invasive, stage II

48 (68.6)

Invasive, stage III

8 (11.4)

Histology

Invasive carcinoma of no special type

63 (90.0)

Invasive lobular carcinoma

6 (8.6)

Others

1 (1.4)

Immunohistochemical subtype

Luminal

58 (82.9)

HER2-enriched

2 (2.9)

Triple-negative

10 (14.3)

Location

Right

37 (52.9)

Left

33 (47.1)

Values are presented as median (interquartile range) or number (%).

HER2, human epidermal growth factor receptor type 2.

AJCC stage III AJCC stage II Caucasian Older than 40 years Invasive lobular carcinoma/others Invasive carcinoma of no special type Multiplicity Rim enhancement Heterogenous enhancement Homogenous enhancement Not circumscribed margin Circumscribed margin Irregular shape Round shape Oval shape Triple negative type HER2 enriched type Luminal type

Fig. 1. Unsupervised hierarchical clustering and a heatmap

of gene expression profile of all samples. The top row shows

den dro gram cluster 2 major groups. The next row indicates

cluster classification of groups 1 (black) and 2 (red). The rows

below the heatmap indicates clinicopathologic and breast

MRI characteristics.

A

B

Fig. 2. Axial T1-weighted contrast-enhanced subtraction MR images of women classified into groups 1 (A) and 2 (B). (A) A 73-

year-old woman with luminal cancer in her left lower outer quadrant breast shows irregular mass with irregular margin and

hetero geneous internal enhancement pattern. (B) A 51-year-old woman with triple-negative cancer in her right upper outer

quadrant breast shows irregular mass with specular margin and rim enhancement.

(4)

groups (groups 1 and 2) (Fig. 1). The luminal subtype, which

was determined by immunohistochemical stain, was ex­

clusively predominant in group 1 (98.2%) while the triple­

nega tive subtype was predominant in group 2 (64.3%) (P <

0.001). According to the BI­RADS MRI lexicons of mass, internal

enhancement was significantly different between 2 groups (P

= 0.003). Heterogeneous enhancement was most frequently

seen in group 1 (48.2%), which was followed by homogenous

enhancement (28.6%) and rim enhancement (23.2%), whereas

rim enhancement was dominantly observed in group 2 (71.4%)

(Fig. 2). The breast cancers of group 2 were single lesions (92.9%)

while 37.5% of the breast cancers of group 2 were multi ple

lesions (P = 0.050). Other MRI characteristics were not signi fi­

cantly different between the 2 groups (Table 2).

Differentially expressed genes and gene set

enrichment analysis

Limma analysis was performed to identify genes differentially

expressed between the 2 groups with above­mentioned criteria.

We found 1,303 genes significantly associated with each group

(Table 3, Supplementary Table 1). Compared to group 1, group

2 had 604 overexpressed and 699 underexpressed genes.

Subsequent functional annotation analysis revealed that mito­

tic cell division related processes were one of the most­enri­

ched biological processes in group 2 whereas mammary gland

development and hormone related processes had higher fold­

ES s in group 1 (Table 4, Supplementary Table 2). Group 1 had

significantly higher expression of AR and ESR1. To identify

significantly enriched signatures in the 2 groups, GSEA was

performed. In group 1, 2 gene sets were found to be significant

with a FDR < 25%, which included gene signatures related to

the luminal subtype (FARMER_BREAST_CANCER_BASAL_VS_

LUMINAL) excluding those related to the basal subtype (SMID_

BREAST_CANCER_BASAL_DN). In group 2, no gene sets were

significant with a FDR < 25%, but 40 gene sets met the criteria

of nominal P­value < 0.01 (Fig. 3, Table 5, Supplementary Table

3).

DISCUSSION

During the last 10 years, the breast cancer survival rate has

increased from 83.2% to 91.3%, with the number of breast cancer

survivors steadily increasing as well. Accordingly, the expected

lifetime of these survivors has lengthened mainly due to early

detection and development of treatment options and this has

led to more emphasis on prognostic management [24]. However,

the heterogeneity of breast cancer is still a hurdle in the suc­

cess ful treatment of breast cancer patients with prognostic

infor mation [25]. As tissue samples might not represent the

entire tumor burden, breast MRI has emerged as an object of

“radiogenomics” to provide structural and functional properties

of the entire tumor [10­13]. Breast MRI is very sensitive and is

able to complement histopathologic or molecular markers to

predict tumor biology [1].

In our study, the clustering of gene expression profiles found

two distinct groups and MRI features of internal enhancement

were significantly different between the 2 groups. There have

been several reports suggesting that computer­derived MRI

phenotypes can be related with the gene expression of breast

cancers [10­13]. In these previous studies, radiogenomic an­

aly ses were performed with the computerized calculation of

MR images. Tumor size differed according to gene expression

Table 2. Comparison of clinicopathologic and MRI

charac-teristics of 70 patients

Characteristic

Group 1

(n = 56)

Group 2

(n = 14) P-value

Age (yr)

0.137

<40

4 (71.4)

3 (21.4)

≥40

52 (92.9) 11 (78.6)

Race

0.494

White

54 (96.4) 13 (92.9)

Black

2 (3.6)

1 (7.1)

AJCC stage

0.223

Carcinoma in situ

0 (0)

0 (0)

Invasive, stage I

13 (23.2)

1 (7.1)

Invasive, stage II

38 (67.9) 10 (71.4)

Invasive, stage III

5 (8.9)

3 (21.4)

Histology

0.857

Invasive carcinoma of no

special type

50 (89.3) 13 (92.9)

Invasive lobular carcinoma

5 (8.9)

1 (7.1)

Others

1 (1.8)

0 (0)

Immunohistochemical subtype

<0.001

Luminal

55 (98.2)

3 (21.4)

HER2-enriched

0 (0)

2 (14.3)

Triple-negative

1 (1.8)

9 (64.3)

Shape

0.893

Oval

15 (26.8)

3 (21.4)

Round

17 (30.4)

5 (35.7)

Irregular

24 (42.9)

6 (42.9)

Margin

>0.999

Circumscribed

15 (26.8)

3 (21.4)

Not circumscribed

41 (73.2) 11 (78.6)

Internal enhancement

0.003

Homogeneous

16 (28.6)

1 (7.1)

Heterogeneous

27 (48.2)

3 (21.4)

Rim enhancement

13 (23.2) 10 (71.4)

Dark internal septation

0 (0)

0 (0)

Multiplicity

0.050

Single

35 (62.5) 13 (92.9)

Multiple

21 (37.5)

1 (7.1)

Values are presented as number (%).

AJCC, American Joint Committee on Cancer; HER2, human

epidermal growth factor receptor type 2.

(5)

Table 3. Most differentially expressed genes

Gene symbol

Fold change (log 2)

P-value

False discovery rate

Higher expression in group 1


AGR3

7.547464286

0.00000000000000000

0.0000000000000000

ESR1

5.021239583

0.00000000000000000

0.0000000000000000

C1orf64

4.753464286

0.00000000000000032

0.0000000000000724

NAT1

4.593283929

0.00000000000000000

0.0000000000000012

FOXA1

4.5084375

0.00000000000000000

0.0000000000000012

FSIP1

4.479303571

0.00000000000000001

0.0000000000000037

AGR2

4.360877232

0.00000000000000000

0.0000000000000004

ERBB4

3.207303373

0.00000000000004379

0.0000000000060927

AGR2

4.360877232

0.00000000000000000

0.0000000000000004

AR

2.81716369

0.00000000000004907

0.0000000000062907

Higher expression in group 2


HORMAD1

4.58407381

0.00000000000000000

0.0000000000000005

PPP1R14C

3.787029762

0.00000000000000026

0.0000000000000658

SOX11

3.754224171

0.00000000000014348

0.0000000000170812

LEMD1

3.70296875

0.00000000000001374

0.0000000000022904

ART3

3.628183929

0.00000000000001878

0.0000000000028450

FABP7

3.595150829

0.00000000939206593

0.0000002068736990

KLK8

3.431892857

0.00000008437144344

0.0000013224364175

ROPN1

3.396830357

0.00000000663902687

0.0000001573229116

S100A8

3.38294881

0.00000000918204510

0.0000002049563638

ROPN1B

3.376111607

0.00000000807284808

0.0000001860103245

MMP1

2.230638392

0.00019172059951384

0.0009182021049513

EGFR

2.159014285

0.00000000022527494

0.0000000063279478

Table 4. Functional annotation analysis of differentially expressed genes

Term

Fold enrichment

False discovery rate

Enriched in group 1

GO:0009719~response to endogenous stimulus

1.967091511

0.000000112834

GO:0044707~single-multicellular organism process

1.377890382

0.000000266149

GO:0010817~regulation of hormone levels

2.970122435

0.000000416408

GO:0007267~cell-cell signaling

1.91497894

0.000003295214

GO:0046883~regulation of hormone secretion

3.120706420

0.001985031706

GO:0061180~mammary gland epithelium development

6.172825887

0.005934101064

GO:0032355~response to estradiol

3.691974976

0.014932796834

GO:0030879~mammary gland development

4.080923780

0.007901849151

GO:0009725~response to hormone

2.047522312

0.000665049063

GO:0022612~gland morphogenesis

4.749350951

0.001019487098

Enriched in group 2

GO:0009888~tissue development

1.91063556

0.000000603981

GO:0007067~mitotic nuclear division

3.057975878

0.000006026920

GO:0000280~nuclear division

2.681743631

0.000009838709

GO:0048285~organelle fission

2.573320448

0.000022693575

GO:0044699~single-organism process

1.119085669

0.000024625453

GO:0000070~mitotic sister chromatid segregation

4.954840614

0.000038797216

GO:0000819~sister chromatid segregation

3.87096923

0.000062455658

GO:0008283~cell proliferation

1.736936747

0.000146131182

GO:0051310~metaphase plate congression

8.494012481

0.000207386724

(6)

C

D

E

F

Enrichment

score

(ES)

0

5,000

Rank in ordered ataset

d

Ranked

list

metric

(Signal2Noise)

Enrichment plot:

FARMER_BREAST_CANCER_BASAL_VS_LULMINAL

0.5

0.4

0.3

0.2

0.1

0.0

0.1

0.2

2

1

0

1

500 1,000 1,500 2,000 2,500 3,000 3,500 4,000 4,500

Zero cross at 2519 '2' (negatively correlated) '1' (positively correlated)

Enrichment

score

(ES)

0

5,000

Rank in ordered ataset

d

Ranked

list

metric

(Signal2Noise)

Enrichment plot:

MASSARWEH_TAMOXIFEN_RESISTANCE_DN

0.6

0.5

0.4

0.3

0.2

0.1

0.0

2

1

0

1

500 1,000 1,500 2,000 2,500 3,000 3,500 4,000 4,500

'1' (positively correlated) Zero cross at 2519 '2' (negatively correlated)

Enrichment

score

(ES)

0

5,000

Rank in ordered ataset

d

Ranked

list

metric

(Signal2Noise)

Enrichment plot:

SMID_BREAST_CANCER_BASAL_DN

0.0

2

1

0

1

500 1,000 1,500 2,000 2,500 3,000 3,500 4,000 4,500

'1' (positively correlated) Zero cross at 2519 '2' (negatively correlated)

Enrichment

score

(ES)

0

5,000

Rank in ordered dataset

Ranked

list

metric

(Signal2Noise)

Enrichment plot:

RAF_UP.V1_DN

0.6

0.5

0.4

0.3

0.2

0.1

0.0

2

1

0

1

500 1,000 1,500 2,000 2,500 3,000 3,500 4,000 4,500

'1' (positively correlated) Zero cross at 2519 '2' (negatively correlated)

Enrichment

score

(ES)

0

5,000

Rank in ordered ataset

d

Ranked

list

metric

(Signal2Noise)

Enrichment plot:

SMID_BREAST_CANCER_BASAL_UP

0.0

0.1

0.2

0.3

0.4

0.5

0.6

0.7

2

1

0

1

500 1,000 1,500 2,000 2,500 3,000 3,500 4,000 4,500

'1' (positively correlated) Zero cross at 2519 '2' (negatively correlated)

Enrichment

score

(ES)

0

5,000

Rank in ordered ataset

d

Ranked

list

metric

(Signal2Noise)

Enrichment plot:

VANTVEER_BREAST_CANCER_ESR1_DN

0.0

0.1

0.2

0.3

0.4

0.5

0.6

0.7

0.8

2

1

0

1

500 1,000 1,500 2,000 2,500 3,000 3,500 4,000 4,500

'1' (positively correlated) Zero cross at 2519 '2' (negatively correlated)

Enrichment profile

Hits

Ranking metric scores

0.7

0.6

0.5

0.4

0.3

0.2

0.1

Enrichment profile

Hits

Ranking metric scores

Enrichment profile

Hits

Ranking metric scores

Enrichment profile

Hits

Ranking metric scores

Enrichment profile

Hits

Ranking metric scores

Enrichment profile

Hits

Ranking metric scores

Fig. 3. Enrichment plots of top gene sets (signatures) for groups 1 (A–D) and 2 (E, F). In each plot, enrichment score (ES) is the

maxi mum deviation from zero encountered in running down the rank list (middle). The bottom portion of each plot shows the

value of the ranking metric which is signal-to-noise ratio in this analysis.

(7)

status whereas breast cancer stages according to the commonly

applied American Joint Committee on Cancer guidelines were

not differently distributed between 2 groups in our study [12,13].

Recently, rim enhancement on MRI has been reported to be

related to poor prognosis of breast cancers [10,26]; for exam ple,

a high calculated score indicating rim enhancement on MRI

was associated with early occurrence of metastasis and certain

RNAs were correlated with the high score of rim en hance ment

[10]. Rim enhancement was predominant in group 2 of our

study sample in which the genes related to poor prognosis were

overexpressed. Matrix metalloproteinase­1 which is related

to tumor growth and metastasis and epidermal growth factor

receptor which is associated with poor clinical outcomes of

tumor were dominantly expressed in group 2 [27,28]. However,

whether these genes cause rim enhancement is still unclear

and information on long­term outcome or metastasis was

unavailable in our study. Therefore, in order to clarify the

relationship between rim enhancement and certain genes of

poor prognosis, a further research would be needed. Targeted

acquisition of tissue sample in fibrotic cores or microvessel

density which have been associated with rim enhancement

histopathologically might be help reveal the mech anism behind

the presentation of rim enhancement by specific genes [26].

Since the development of DNA microarray technology, breast

cancers have been divided into 2 large categories based on

gene expression pattern of ER biology [2]. Despite the conti­

nuous development of state­of­the­art analytic methods,

un super vised hierarchical clustering probably remains the

most basic and robust method and our results agree with the

results of previous studies which performed similar an aly­

ses [9]. Since DNA microarray is not routinely performed in

clinical practice, breast cancer subtypes are currently based

on the immunohistochemical staining levels for the ex pres­

sion of the ER, PR, and HER2 [1]. Because luminal cancers

were predominant in group 1 and triple­negative cancers

were predominant in group 2 of our study sample, known

char ac teristics of luminal cancers such as heterogeneous en­

hance ment or multiplicity were frequently observed in group

1 [4­6] and single manifestation or rim enhancement, which

are known to be frequent in triple­negative cancers, were pre­

do minantly seen in group 2 [4­7]. Nevertheless, even though

the specific imaging features mentioned above were strongly

related to a peculiar molecular subtype of breast cancer [4­7,26],

cer tain clustered gene expression profiles may be associated

with specific imaging features such as rim enhancement or

hetero geneity of internal enhancement according to our results

as well as prior studies [10,13]. Since ERBB4, a gene correlated

with aggressiveness mainly in triple­negative breast cancers,

was one of the markedly underexpressed genes in group 2 in

spite of triple­negative cancers being absolutely predominant in

Table 5. Top 10 significantly enriched gene signatures in each group

Gene signature

ES

Nominal

P-value

FDR

Group 1

FARMER_BREAST_CANCER_BASAL_VS_LULMINAL

0.48625603

0.00000

0.21165773

SMID_BREAST_CANCER_BASAL_DN

0.7354685

0.00000

0.23257719

MASSARWEH_TAMOXIFEN_RESISTANCE_DN

0.6143302

0.00000

0.27332994

GOZGIT_ESR1_TARGETS_DN

0.5099707

0.00000

0.29569975

RAF_UP.V1_DN

0.57963943

0.00000

0.30762357

CHARAFE_BREAST_CANCER_LUMINAL_VS_BASAL_UP

0.7100135

0.00207

0.32511595

REACTOME_SIGNALING_BY_ERBB4

0.6657322

0.00000

0.32841143

GO_SECRETORY_GRANULE_MEMBRANE

0.6221506

0.00000

0.34353867

MASSARWEH_RESPONSE_TO_ESTRADIOL

0.6610997

0.00417

0.34401014

HALLMARK_ESTROGEN_RESPONSE_EARLY

0.57554954

0.00208

0.34932917

Group 2

SMID_BREAST_CANCER_BASAL_UP

–0.73014784

0.00000

1

SMID_BREAST_CANCER_RELAPSE_IN_BONE_DN

–0.71839243

0.00000

1

VANTVEER_BREAST_CANCER_ESR1_DN

–0.8044552

0.00000

1

GSE36476_CTRL_VS_TSST_ACT_40H_MEMORY_CD4_TCELL_YOUNG_DN

–0.7214786

0.00200

1

GSE18791_CTRL_VS_NEWCASTLE_VIRUS_DC_12H_UP

–0.6872284

0.00407

1

SMID_BREAST_CANCER_RELAPSE_IN_BRAIN_UP

–0.7895748

0.00216

1

GSE21360_SECONDARY_VS_TERTIARY_MEMORY_CD8_TCELL_UP

–0.59121305

0.00204

1

NAKAMURA_CANCER_MICROENVIRONMENT_DN

–0.83082336

0.00197

1

PID_AURORA_B_PATHWAY

–0.8470182

0.00204

0.9765514

DOANE_BREAST_CANCER_ESR1_DN

–0.82513964

0.00000

1

(8)

this group, we can hypothesize that an undiscovered intrinsic

relationship might exist between gene expression char ac­

teristics and imaging features [29].

Our study has several limitations. First, our sample size is

relatively small; we integrated TCGA and TCIA data to conduct

this analysis and a future study with a large study sample

is necessary. Second, information on long­term outcome or

metastasis was unavailable in our study sample, thus rela tion­

ship between prognosis and MRI features or specific genes

enriched in each group cannot be evaluated. Third, we did not

con sider interobserver variability when interpreting breast

MRI, but we did assess tumors using the standard BI­RADS

lexicon with arbitration between the 2 readers. Moreover,

moderate to substantial agreement on BI­RADS MRI lexicon has

been reported before [30]. Fourth, we excluded patients who

had non­mass enhancement on MRI for their breast cancers.

Thus, our results are not applicable to all breast malignancies

found on MRI. However, non­mass enhancement has lower

agreement among readers and is assessed by different imaging

descriptors compared to mass. A future study about non­mass

enhancement with a large sample might be needed because

we had only 12 nonmass enhancement cases in this study.

Finally, we did not perform kinetic analysis of breast MRI. As

the MR images of all dynamic enhancing phases under regular

conditions were unfortunately unavailable, interpretation

of kinetic features without supplementary computerized

parameters might be limited.

In conclusion, our results identified intuitive imaging fea­

tures of breast MRI associated with distinct gene expression

pro files using the standard imaging variables of BI­RADS, a lexi­

con which is routinely used in real clinical practice. The internal

enhancement pattern on MRI might reflect specific gene ex­

pres sion profiles of breast cancers, which can be recognized by

visual distinction.

CONFLICTS OF INTEREST

No potential conflict of interest relevant to this article was

reported.

ACKNOWLEDGEMENTS

This work was supported by INHA UNIVERSITY HOSPITAL

Research Grant.

SUPPLEMENTARY MATERIALS

Supplementary Tables can be found via https://astr.or.kr/src/

sm/astr­93­18­s002.pdf.

REFERENCES

1. Voduc KD, Cheang MC, Tyldesley S,

Gelmon K, Nielsen TO, Kennecke H.

Breast cancer subtypes and the risk of

local and regional relapse. J Clin Oncol

2010;28:1684­91.

2. Trop I, LeBlanc SM, David J, Lalonde L,

Tran­Thanh D, Labelle M, et al. Molecular

classification of infiltrating breast can cer:

toward personalized therapy. Radiographics

2014;34:1178­95.

3. Kim H, Cho J, Kwon SY, Kang SH. Biologic

sub type is a more important prognostic

fac tor than nodal involvement in patients

with stages I and II breast carcinoma. Ann

Surg Treat Res 2016;90:1­9.

4. Uematsu T, Kasami M, Yuen S. Triple­

nega tive breast cancer: correlation bet­

ween MR imaging and pathologic find­

ings. Radiology 2009;250:638­47.

5. Loo CE, Straver ME, Rodenhuis S, Muller

SH, Wesseling J, Vrancken Peeters MJ, et

al. Magnetic resonance imaging response

mo ni toring of breast cancer during neo ad­

ju vant chemotherapy: relevance of breast

cancer subtype. J Clin Oncol 2011;29:660­

6.

6. Youk JH, Son EJ, Chung J, Kim JA, Kim

EK. Triple­negative invasive breast cancer

on dynamic contrast­enhanced and dif­

fusion­weighted MR imaging: com pa rison

with other breast cancer subtypes. Eur

Radiol 2012;22:1724­34.

7. Dogan BE, Gonzalez­Angulo AM, Gilcrease

M, Dryden MJ, Yang WT. Multimodality

imaging of triple receptor­negative tumors

with mammography, ultrasound, and

MRI. AJR Am J Roentgenol 2010;194:1160­

6.

8. Agner SC, Rosen MA, Englander S,

Tomaszewski JE, Feldman MD, Zhang P,

et al. Computerized image analysis for

iden ti fying triple­negative breast cancers

and differentiating them from other

mole cular subtypes of breast cancer on

dy na mic contrast­enhanced MR images: a

feasi bility study. Radiology 2014;272:91­9.

9. Perou CM, Sorlie T, Eisen MB, van de Rijn

M, Jeffrey SS, Rees CA, et al. Molecular

portraits of human breast tumours.

Nature 2000;406:747­52.

10. Yamamoto S, Han W, Kim Y, Du L,

Jamshidi N, Huang D, et al. Breast can cer:

radiogenomic biomarker reveals asso cia­

tions among dynamic contrast­enhanced

MR imaging, long noncoding RNA, and

metastasis. Radiology 2015;275:384­92.

11. Yamamoto S, Maki DD, Korn RL, Kuo MD.

Radiogenomic analysis of breast cancer

using MRI: a preliminary study to define

the landscape. AJR Am J Roentgenol 2012;

(9)

199:654­63.

12. Ashraf AB, Daye D, Gavenonis S, Mies C,

Feldman M, Rosen M, et al. Identification

of intrinsic imaging phenotypes for breast

can cer tumors: preliminary associations

with gene expression profiles. Radiology

2014;272:374­84.

13. Zhu Y, Li H, Guo W, Drukker K, Lan L,

Giger ML, et al. Deciphering genomic un­

der pinnings of quantitative MRI­based

radio mic phenotypes of invasive breast

car ci noma. Sci Rep 2015;5:17787.

14. Clark K, Vendt B, Smith K, Freymann J,

Kirby J, Koppel P, et al. The Cancer Im­

aging Archive (TCIA): maintaining and

opera ting a public information repository.

J Digit Imaging 2013;26:1045­57.

15. Cancer Genome Atlas Network. Com pre­

hen sive molecular portraits of human

breast tumours. Nature 2012;490:61­70.

16. Broad Institute TCGA Genome Data An­

aly sis Center: Firehose version 2016_

01_28 stddata run [Internet]. Broad Insti­

tute of MIT and Harvard; c2016 [cited

2016 Sep 30]. Available from: http://

gdac.broadinstitute.org/runs/stddata__

2016_01_28/.

17. Hammond ME, Hayes DF, Dowsett M,

Allred DC, Hagerty KL, Badve S, et al.

Ameri can Society of Clinical Oncology/

College of American Pathologists guide­

line recommendations for immuno histo­

che mical testing of estrogen and pro ges­

te rone receptors in breast cancer. Arch

Pathol Lab Med 2010;134:907­22.

18. Wolff AC, Hammond ME, Schwartz JN,

Hagerty KL, Allred DC, Cote RJ, et al.

Ameri can Society of Clinical Oncology/

College of American Pathologists guide­

line recommendations for human epi der­

mal growth factor receptor 2 testing in

breast cancer. Arch Pathol Lab Med 2007;

131:18­43.

19. Carl J D’Orsi; American College of Radio­

logy. BI­RADS Committee. ACR BI­RADS

atlas: breast imaging reporting and data

sys tem. 5th ed. Reston (VA): American

College of Radiology; 2013.

20. Ritchie ME, Phipson B, Wu D, Hu Y, Law

CW, Shi W, et al. limma powers dif fer en­

tial expression analyses for RNA­se quenc­

ing and microarray studies. Nucleic Acids

Res 2015;43:e47.

21. Dennis G Jr, Sherman BT, Hosack DA,

Yang J, Gao W, Lane HC, et al. DAVID:

data base for annotation, visualization,

and integrated discovery. Genome Biol

2003;4:P3.

22. Subramanian A, Tamayo P, Mootha VK,

Mukherjee S, Ebert BL, Gillette MA, et al.

Gene set enrichment analysis: a know­

ledge­based approach for inter preting

genome­wide expression profiles. Proc

Natl Acad Sci U S A 2005;102:15545­50.

23. Mootha VK, Lindgren CM, Eriksson KF,

Subramanian A, Sihag S, Lehar J, et al.

PGC­1alpha­responsive genes involved

in oxidative phosphorylation are co ordi­

nately downregulated in human diabetes.

Nat Genet 2003;34:267­73.

years of cancer research. N Engl J Med

2012;366:2207­14.

25. Almendro V, Fuster G. Heterogeneity of

breast cancer: etiology and clinical rele­

vance. Clin Transl Oncol 2011;13:767­73.

26. Schmitz AM, Loo CE, Wesseling J,

Pijnappel RM, Gilhuijs KG. Association

bet ween rim enhancement of breast can­

cer on dynamic contrast­enhanced MRI

and patient outcome: impact of subtype.

Breast Cancer Res Treat 2014;148:541­51.

27. Liu H, Kato Y, Erzinger SA, Kiriakova GM,

Qian Y, Palmieri D, et al. The role of MMP­

1 in breast cancer growth and metastasis

to the brain in a xenograft model. BMC

Cancer 2012;12:583.

28. Rimawi MF, Shetty PB, Weiss HL, Schiff

R, Osborne CK, Chamness GC, et al. Epi­

der mal growth factor receptor ex pres sion

in breast cancer association with biologic

phe notype and clinical outcomes. Cancer

2010;116:1234­42.

29. Kim JY, Jung HH, Do IG, Bae S, Lee SK,

Kim SW, et al. Prognostic value of ERBB4

ex pression in patients with triple negative

breast cancer. BMC Cancer 2016;16:138.

30. Grimm LJ, Anderson AL, Baker JA, John­

son KS, Walsh R, Yoon SC, et al. Inter ob­

server variability between breast im agers

using the fifth edition of the BI­RADS

MRI lexicon. AJR Am J Roentgenol 2015;

204:1120­4.

(10)

Gene Symbol

Log2 Fold Change

P.Value

False discovery rate

HORMAD1

4.58407381

0.00000000000000000 0.0000000000000005

PPP1R14C

3.787029762

0.00000000000000026 0.0000000000000658

SOX11

3.754224171

0.00000000000014348 0.0000000000170812

LEMD1

3.70296875

0.00000000000001374 0.0000000000022904

ART3

3.628183929

0.00000000000001878 0.0000000000028450

FABP7

3.595150829

0.00000000939206593 0.0000002068736990

KLK8

3.431892857

0.00000008437144344 0.0000013224364175

ROPN1

3.396830357

0.00000000663902687 0.0000001573229116

S100A8

3.38294881

0.00000000918204510 0.0000002049563638

ROPN1B

3.376111607

0.00000000807284808 0.0000001860103245

KLK6

3.270041667

0.00000000163442877 0.0000000507586576

BCL11A

3.257823391

0.00000000000001581 0.0000000000025494

PSAT1

3.1595625

0.00000000000000024 0.0000000000000620

SBSN

3.120392857

0.00000000000015915 0.0000000000183840

CRABP1

3.111901786

0.00000000000233118 0.0000000001942646

CALML5

3.105238095

0.00000156727029923 0.0000155812330578

ACE2

3.101458333

0.00000000000000109 0.0000000000002096

SERPINB3

3.084651786

0.00000001190010384 0.0000002553670352

MUC15

3.070277381

0.00000020569499209 0.0000028187847729

SERPINB4

2.941723214

0.00000003483822233 0.0000006334222242

KRT16

2.881949405

0.00000000077537668 0.0000000276920244

EN1

2.873897321

0.00000000005897564 0.0000000033132383

LCT

2.763340774

0.00000000000027294 0.0000000000284312

GLYATL2

2.716571429

0.00000917932059096 0.0000707189567870

SCRG1

2.671659226

0.00000037710954445 0.0000047494904843

VGLL1

2.669721301

0.00000000000001701 0.0000000000026575

DDC

2.661559524

0.00000000139624588 0.0000000456289504

S100A7

2.623446429

0.00035057966790720 0.0015389801049482

HIST1H1A

2.622272321

0.00000000000053866 0.0000000000549656

FOXC1

2.61641183

0.00000000000188785 0.0000000001627455

C1orf106

2.590943567

0.00000000000156899 0.0000000001426354

ATP6V1C2

2.582880952

0.00000000008563103 0.0000000046038190

PROM1

2.58267619

0.00001611445916299 0.0001144492838281

HSD17B2

2.570516369

0.00000085053777727 0.0000093465689810

SCEL

2.543772215

0.00000000318123902 0.0000000855171779

MSLN

2.539818452

0.00000000067090225 0.0000000247888796

CHODL

2.522982143

0.00000000001145291 0.0000000008546950

TMSL8

2.512104911

0.00000000109662517 0.0000000365541725

S100A9

2.483907738

0.00000185543807325 0.0000178407507043

MGC102966

2.429375

0.00000097241522731 0.0000104336397780

PRDM13

2.422044643

0.00000024125955050 0.0000032253950602

SLPI

2.415333929

0.00000003861702298 0.0000006895896961

SUPPLEMENTARY MATERIALS

Supplementary Table 1.

(11)

IL22RA2

2.345142857

0.00000000066212780 0.0000000247062612

LY6D

2.342895834

0.00000000087179832 0.0000000302707750

ELF5

2.328696429

0.00001140607652520 0.0000851199740687

CNGA1

2.328534226

0.00000000001469690 0.0000000010497788

COL9A3

2.312254464

0.00000041588838099 0.0000051344244566

DKK1

2.309183333

0.00000079161287359 0.0000088349651071

MGC10981

2.302916667

0.00000000272712036 0.0000000745114854

MLZE

2.300159226

0.00000000275741250 0.0000000749296875

PTCHD1

2.28920355

0.00000092429634041 0.0000099816019483

UGT8

2.278517857

0.00000000000016496 0.0000000000183840

KLRG2

2.278504464

0.00000010582740660 0.0000015986013081

PKP1

2.265909226

0.00000000013065163 0.0000000063423121

GPR126

2.2615375

0.00000000000077258 0.0000000000730811

KCNN4

2.255928571

0.00000000002476266 0.0000000016291223

S100A7A

2.254089286

0.00005264416135698 0.0003122429499228

ZNF695

2.254040179

0.00000000004926840 0.0000000028644419

MMP12

2.250318452

0.00005849550796858 0.0003393010903050

SRrp35

2.231167623

0.00000000004220429 0.0000000025424270

MMP1

2.230638393

0.00019172059951384 0.0009182021049513

DSC2

2.2200625

0.00000000003466402 0.0000000021403976

IL12RB2

2.219327381

0.00000004579653654 0.0000007978490686

S100A2

2.207567857

0.00005273778566366 0.0003124276401876

DSC3

2.198776786

0.00000023051826120 0.0000031235536748

KCNK5

2.188916667

0.00000000399021142 0.0000001017911078

ACTL8

2.18739881

0.00000026268306656 0.0000034654758121

KCNG1

2.179859375

0.00000000000000041 0.0000000000000888

KRT6A

2.177241071

0.00001690123428914 0.0001180253791141

IMPA2

2.176928571

0.00000000000025126 0.0000000000273104

RARRES1

2.171236607

0.00000013903079314 0.0000020326139348

INDO

2.170377976

0.00003230229415783 0.0002039286247338

HRASLS

2.169944445

0.00000813514837105 0.0000643419292256

PI3

2.168123512

0.00000000561677594 0.0000001369945352

MIA

2.161558036

0.00039038803302555 0.0016885295546088

EGFR

2.159014286

0.00000000225274942 0.0000000632794780

SLC26A9

2.151720238

0.00000002743936290 0.0000005289258004

SERPINB5

2.127174053

0.00000004336078733 0.0000007633941431

TRPV6

2.123058036

0.00000000032502662 0.0000000140097681

LAMP3

2.109309524

0.00000393185010063 0.0000343368749261

MEX3A

2.106735119

0.00000000241546695 0.0000000663589821

MATN4

2.102535714

0.00000000000000004 0.0000000000000104

GPR158

2.091977679

0.00015428245022127 0.0007698725060941

SEC14L4

2.090399702

0.00000002807606796 0.0000005378557081

KRT6C

2.084380953

0.00002230054800583 0.0001480780080068

KRT23

2.063933036

0.00063658352077607 0.0025422664567734

(12)

ZIC1

2.043098313

0.00000011599656520 0.0000017312920180

B3GNT5

2.031375

0.00000000002330574 0.0000000015537162

CPA4

1.988730952

0.00000000008655495 0.0000000046039869

MAPK4

1.985441964

0.00000000011412530 0.0000000056980109

KLF5

1.979533482

0.00000008468182936 0.0000013231535838

GAL

1.975691964

0.00000000028380715 0.0000000127841060

ZBED2

1.974035714

0.00017615791176509 0.0008567991817368

PLAC2

1.973098214

0.00005830656458481 0.0003389916545628

CDH19

1.970605952

0.00000696490920272 0.0000562593635114

LCN2

1.96919881

0.00022696438819255 0.0010541638590799

TGM1

1.96027381

0.00000000168441210 0.0000000516690830

GSTA2

1.960008929

0.00003541521438950 0.0002205181468835

CXCL1

1.958901786

0.00001967198235048 0.0001341881470019

AIM2

1.958227976

0.00003161850599872 0.0002003707604482

CHI3L2

1.934666135

0.00006224240118782 0.0003560778099990

FAM83B

1.933955357

0.00002901309461208 0.0001852688033977

SLC6A2

1.911963967

0.00000001215797176 0.0000002586802502

CXCL13

1.9084125

0.00067808652900998 0.0026834015758318

BPI

1.905577056

0.00000000062333557 0.0000000239744450

SMC1B

1.89909662

0.00000343359467783 0.0000306570953378

AKR1B10

1.898714605

0.00005923220362931 0.0003427789561881

DNMT3B

1.886202381

0.00000000011509982 0.0000000056980109

HPDL

1.8859375

0.00000000899033642 0.0000002022336579

CD38

1.882401786

0.00015667050351636 0.0007784552194602

FGFBP1

1.876070238

0.00008543252151410 0.0004658261805567

SHC4

1.87258631

0.00021379287938007 0.0010046657865605

SLC6A14

1.870268601

0.00000136305203017 0.0000138803669060

SMPX

1.869928571

0.00000034003797844 0.0000043755844513

KRT17

1.868516071

0.00002106867335941 0.0001412109474491

FUT3

1.868023214

0.00006436234864318 0.0003661111981978

RNF182

1.867857143

0.00001024755108853 0.0000778689292442

KCNS1

1.862976786

0.00000000003537525 0.0000000021570277

TRIM2

1.858226191

0.00000000200227322 0.0000000578079801

ANXA8L2

1.853214286

0.00003626706587427 0.0002252612787222

RPRML

1.849584821

0.00000375311402625 0.0000331547175464

ONECUT2

1.848798568

0.00000006677020372 0.0000010769387697

FAM54A

1.842107143

0.00000000088438339 0.0000000303447945

C20orf42

1.841320238

0.00000005022495566 0.0000008437107814

HSPB3

1.840043155

0.00000940008919348 0.0000720865735697

GSTP1

1.8320625

0.00000141024899270 0.0000142643397967

ZFP42

1.831134524

0.00001812095132550 0.0001249720781069

CDCA7

1.827049107

0.00000000227947409 0.0000000633187248

PLCH1

1.816495217

0.00000000205700106 0.0000000587714589

BBOX1

1.812857143

0.00103060536828051 0.0038057805327936

(13)

POU2AF1

1.806470982

0.00032056985213158 0.0014311154113017

UNQ338

1.803857143

0.00001151770752581 0.0000854429341677

RGS20

1.792258929

0.00000001135404420 0.0000002468270478

LRP8

1.790503571

0.00000000064408055 0.0000000245832272

ACY1L2

1.790392857

0.00000023763693494 0.0000031940448245

MELK

1.788460317

0.00000000194330523 0.0000000568217903

C10orf38

1.775611607

0.00000000142671253 0.0000000463218355

GABRP

1.762630952

0.00039952221629867 0.0017176363555403

STAC2

1.762419643

0.00001630559817181 0.0001153154043268

TRIM29

1.757319643

0.00000837976484196 0.0000656949709190

ST8SIA1

1.756253189

0.00000192517619599 0.0000183590446789

TRPM8

1.756144048

0.00000070812789822 0.0000080286609776

STAC

1.750031548

0.00000000302410871 0.0000000817326678

CYP39A1

1.746964286

0.00000300112712629 0.0000274326062732

TTK

1.743630952

0.00000000176126855 0.0000000531595988

ANLN

1.743095238

0.00000000097683440 0.0000000327796778

C6orf173

1.741270833

0.00000000001799417 0.0000000012495950

LAD1

1.737327381

0.00000002946785533 0.0000005539070552

MAGEA4

1.735910714

0.00000124502158944 0.0000129151617162

CCKBR

1.733885417

0.00000053450554521 0.0000063031314294

KRTDAP

1.731725595

0.00001796086151499 0.0001240390988604

CA9

1.725220238

0.00000000030465322 0.0000000133647498

FZD9

1.712845238

0.00000000001424743 0.0000000010339117

KLHL34

1.711821429

0.00000084089931743 0.0000092814494197

PIK3C2G

1.711309524

0.00012293065083699 0.0006346600599062

NFIB

1.702664541

0.00000005359041369 0.0000008872585047

MAGEA3

1.702223214

0.00000094451989489 0.0000101561279020

CLIC3

1.697821429

0.00000179828823566 0.0000173915690102

BAIAP2L2

1.694589286

0.00000000153331640 0.0000000488317324

WNT6

1.679191817

0.00000000000016546 0.0000000000183840

NPM2

1.676727679

0.00000000079436445 0.0000000281689523

ASS1

1.672627976

0.00000017479301321 0.0000024758217168

BTG3

1.669002976

0.00000000057990015 0.0000000226523497

COL9A1

1.663410714

0.00009044489304459 0.0004894204169079

SERPINB2

1.661927296

0.00000438782149125 0.0000373357948983

GSTA5

1.64886756

0.00002142558602750 0.0001432191579379

CCNE1

1.647553571

0.00000000002292406 0.0000000015489228

ZNF750

1.640241071

0.00000438924650724 0.0000373357948983

KLK10

1.639858929

0.00060074310058319 0.0024241389128221

KLK5

1.639763393

0.00011932348603372 0.0006208297920589

CCL7

1.629769345

0.00038391152578626 0.0016620824216041

NMU

1.629380952

0.00010338365092799 0.0005481635786214

PSMAL

1.628699405

0.00000054496072552 0.0000063962526469

KREMEN2

1.628678571

0.00149028039040908 0.0051459958232358

(14)

KRT86

1.623883929

0.00000043065061823 0.0000052518368077

SFRP1

1.622904018

0.00699711994045176 0.0187088768461277

CTSL2

1.621468254

0.00000043196752339 0.0000052550793600

IL1R2

1.618630952

0.00000129239957007 0.0000133512352280

LY6K

1.618296248

0.00001366181308579 0.0000994309540450

C1orf135

1.618

0.00000000361095126 0.0000000946717506

PERP

1.616423214

0.00000000000160726 0.0000000001435054

SYT8

1.616282738

0.00002460928051243 0.0001614375108460

MCM10

1.615104167

0.00000000724695358 0.0000001685338043

TTLL4

1.614303571

0.00000000000055801 0.0000000000558007

AMY2A

1.608901786

0.00002310840308672 0.0001532387472594

FLJ21511

1.608678571

0.00177192350627952 0.0059341041737425

TMEM40

1.608017857

0.00002989540905857 0.0001901743578789

PHGDH

1.60340625

0.00000018400688474 0.0000025955815911

DNAH11

1.599955357

0.00000292891058439 0.0000269697107218

KIF14

1.599617347

0.00000007724725600 0.0000012261469206

FANCA

1.596558036

0.00000000018867179 0.0000000088164387

MUC16

1.594035714

0.00014578031147997 0.0007342122978096

KLHDC7B

1.593910714

0.00005143239376796 0.0003065100939688

CP

1.58838198

0.00583580479323174 0.0161121060000876

C15orf52

1.586422619

0.00000023877823249 0.0000032007805964

KRT83

1.581459821

0.00000133092481509 0.0000136645258223

CALCB

1.580946429

0.00021531339861794 0.0010099127514913

MARCO

1.58021875

0.00000003139713533 0.0000005835898761

FOXL1

1.574508929

0.00000000000147550 0.0000000001366199

PRKX

1.560705357

0.00000000093398205 0.0000000317680969

C1QL2

1.560316964

0.00000000189710439 0.0000000561273487

KRT81

1.559428571

0.00000005003744769 0.0000008437107814

NETO2

1.558495536

0.00000325237433402 0.0000293006696759

KIF2C

1.555607143

0.00000001480295154 0.0000003083948238

KRT5

1.554233929

0.00043434900011715 0.0018467219392736

C6orf105

1.553459821

0.00006988791582467 0.0003908720124422

ICEBERG

1.552522024

0.00142788436210851 0.0049856297559655

UGT1A6

1.552223214

0.00001853382907993 0.0001272927821424

ABTB2

1.55184375

0.00000000040418091 0.0000000167016903

MPZL2

1.549151191

0.00000070321804891 0.0000080093171857

AQP5

1.543449405

0.00004685988990879 0.0002836555079225

C8orf47

1.541001488

0.00099457184219877 0.0036918034231580

CDC20

1.540010714

0.00000000031430710 0.0000000136655262

NRTN

1.536434524

0.00000044466694910 0.0000053703737814

ATP6V0A4

1.532532738

0.01005964639952380 0.0252882011048863

CSRP2

1.53165625

0.00000025847276836 0.0000034189519625

CDH3

1.531370536

0.00024578379213990 0.0011284838941226

CHRNA5

1.531142857

0.00001310814407612 0.0000959600591224

(15)

FAM123B

1.52825

0.00000000000194143 0.0000000001645278

RASAL1

1.526357143

0.00000146268392590 0.0000147151300392

LPIN1

1.526120536

0.00000000009790916 0.0000000050468641

CTA-246H3.1

1.520214286

0.00214013305802301 0.0068814567782090

NLRP7

1.518473214

0.00018586055174303 0.0008935603449184

CHI3L1

1.517588095

0.00000478988103672 0.0000401461748773

PRKY

1.514282143

0.00000000131583701 0.0000000432841121

PGBD5

1.513520833

0.00002076397456345 0.0001399189660610

ARNTL2

1.506491071

0.00000000642329315 0.0000001529355511

RHCG

1.505566964

0.00000005028516257 0.0000008437107814

DEPDC1

1.505147321

0.00000022862080014 0.0000031062608715

AKR1CL2

1.504325893

0.00000173406226887 0.0000168355560084

CSAG3A

1.501761905

0.00011823153318144 0.0006157892353200

PAX6

1.497674703

0.00000110718954845 0.0000116073745259

CENPA

1.492980769

0.00000005849165786 0.0000009557460434

FAM83D

1.492504464

0.00004350570890705 0.0002665790986951

KIAA1609

1.490735651

0.00000000003207048 0.0000000020297775

NDC80

1.486938187

0.00000002591052742 0.0000005088017744

AQP9

1.484397321

0.00036292390607462 0.0015848205505442

PFKP

1.479430195

0.00000004770013830 0.0000008139955342

FADS2

1.478816071

0.00001204454403767 0.0000888240710743

GGH

1.476700397

0.00001703650696799 0.0001184736228650

NANOGP1

1.476580357

0.00007046264957037 0.0003923310109709

NCOA7

1.476560268

0.00000039841961683 0.0000049802452104

KIAA1804

1.475713967

0.00000002750414162 0.0000005289258004

CHST4

1.472130952

0.00000273723921968 0.0000253918294961

TSPYL5

1.471470779

0.00015526903881481 0.0007732521853327

DMRTA1

1.470474702

0.00016808331523750 0.0008223254170132

ME1

1.468285714

0.00000495914312895 0.0000411888964198

LMO4

1.463875

0.00000839916557764 0.0000656949709190

GYLTL1B

1.46240625

0.00000042285836508 0.0000051820878073

FAM3D

1.461080357

0.00002820928371000 0.0001810608710526

STOX2

1.452160714

0.00000129642555762 0.0000133652119342

PTPN14

1.449469643

0.00000000868327119 0.0000001973470726

SLC26A7

1.445933036

0.00000337995280987 0.0000302321360454

EPHB6

1.441848214

0.00000000088606800 0.0000000303447945

GBP1

1.440580357

0.00010630134997328 0.0005618464586326

CDCA2

1.439929762

0.00000000493258391 0.0000001220936610

IFRD1

1.437220982

0.00000000012057519 0.0000000059105485

C21orf91

1.434866071

0.00000000001426798 0.0000000010339117

CNKSR3

1.434303571

0.00000778984433483 0.0000621199707721

GABRE

1.434158482

0.00000073348329733 0.0000082973223680

DEFB1

1.433616071

0.00110455033929721 0.0040248920662923

TNNT2

1.432294643

0.00000042528405940 0.0000051990716308

(16)

ASPM

1.430199274

0.00000008540216913 0.0000013302518557

NDRG1

1.429115385

0.00000014540024272 0.0000021133756209

MAGEA12

1.427553571

0.00000451375028161 0.0000381873966295

GPT2

1.426464286

0.00000130766155242 0.0000134533081525

PPARGC1A

1.42091131

0.00000380985055917 0.0000335965657775

CCK

1.415674107

0.00041620940612184 0.0017786726757343

FABP5

1.412893452

0.00007296080096050 0.0004044390297145

EIF2C2

1.411598214

0.00000000887809506 0.0000002008618792

MAP7D2

1.411270635

0.00000364078688557 0.0000323338089305

SPRR1B

1.409616071

0.00268302396508342 0.0083427362098365

FAM62C

1.408928571

0.00002093081128733 0.0001404752435391

PRSS27

1.406354167

0.00000054345479136 0.0000063935857807

PGLYRP4

1.405280357

0.00000020368102338 0.0000028055237381

MPP6

1.405272321

0.00000006945309482 0.0000011130303658

ARL9

1.404589286

0.00026914653009981 0.0012256217217660

KHDRBS3

1.398035714

0.00000010929265287 0.0000016410308239

IFNG

1.39784375

0.00308177131473674 0.0093520273335250

BUB1

1.394303571

0.00000051377957712 0.0000061018952152

MCM4

1.393477679

0.00000001574120520 0.0000003238931110

PADI2

1.392678571

0.00000077029595774 0.0000086162858808

TCF7L1

1.388705357

0.00012931986235897 0.0006624992948718

GPR64

1.387767857

0.00054297028541557 0.0022232921020707

C14orf115

1.382916773

0.00000037046802422 0.0000047013708658

C4orf7

1.381200893

0.00146213443614451 0.0050874545446921

RLBP1

1.380633929

0.00007035480155916 0.0003921672327713

HSPA4L

1.377473214

0.00009434935083356 0.0005061660452444

NUDT8

1.377419643

0.00010421744812803 0.0005514443247812

TPX2

1.375551339

0.00000020032254170 0.0000027668859351

UBE2C

1.373830357

0.00000076692478205 0.0000085978114579

C6orf115

1.373821429

0.00000000341262108 0.0000000902809810

PLCG2

1.372125

0.00000025400949639 0.0000033777858562

MYO10

1.371189087

0.00000009087417045 0.0000013980641608

TMEM45A

1.370063492

0.00053703874730812 0.0022045925587361

TRIM43

1.369875

0.00012823768549479 0.0006576291563835

GNG4

1.366318452

0.00008238835858831 0.0004507021804612

MGC72080

1.366017857

0.00000004068495486 0.0000007213644479

GPSM2

1.365486607

0.00000046308558864 0.0000055659325557

CENPF

1.36461526

0.00000036137707118 0.0000046211901685

UGT2B7

1.361396429

0.00430284320752040 0.0124287787623351

C6orf142

1.361

0.00004182822562388 0.0002569301328248

NUF2

1.360042411

0.00000154385282441 0.0000154385282441

MYBL2

1.359493941

0.00000106955163065 0.0000112821901968

GPM6B

1.359019133

0.00006117273675726 0.0003507611052595

MGC13057

1.357783163

0.00000018772510668 0.0000026274860584

(17)

hCG_1990170

1.357321429

0.00060659774836074 0.0024420199209370

VSNL1

1.356610119

0.00088527138501126 0.0033634931041461

PLA2G7

1.356040179

0.00040891445405966 0.0017549976569084

NT5DC2

1.355044643

0.00000001567749937 0.0000003238931110

CHEK1

1.354482143

0.00000742787537497 0.0000596137670544

CEP55

1.350767857

0.00002868833542747 0.0001836641192539

CIB2

1.349449405

0.00000002911169111 0.0000005503705211

TTYH1

1.347462798

0.00016807211146751 0.0008223254170132

IGLV2-14

1.34465625

0.00190643375035872 0.0062877102584391

NHSL1

1.344084821

0.00000000540568618 0.0000001324923085

PLCB4

1.342441964

0.00016255392546704 0.0008015479559519

SLC1A6

1.341775595

0.00001580381950787 0.0001125628170076

KIAA0746

1.340982143

0.00000951053144883 0.0000727104850828

tcag7.1260

1.340723214

0.00000277972255641 0.0000256905966396

RRAGD

1.340678571

0.00000016148631539 0.0000023202056810

ETV4

1.338666396

0.00000000901962114 0.0000002022336579

ECEL1

1.338440476

0.00000108074199850 0.0000113762315631

SH2D2A

1.334209821

0.00000639329156341 0.0000518094940309

C15orf42

1.332854911

0.00000004676819429 0.0000008106627695

PNPLA3

1.332549107

0.00395476067721611 0.0115366414154496

NFE2L3

1.332223214

0.00000944486557433 0.0000723190319627

TMEM71

1.330440476

0.00005181838710090 0.0003082046409169

SPRR2F

1.322232143

0.00002710885046753 0.0001746704282702

SOX10

1.318739286

0.00005589381209121 0.0003264825472617

GJB5

1.317077381

0.01173476975966830 0.0287899159952608

FAM49A

1.316830357

0.00000002907564278 0.0000005503705211

IL8

1.314478316

0.00015486704011030 0.0007720191431221

FLJ35880

1.311988095

0.00002560430053072 0.0001666946649135

DLG7

1.310162698

0.00000060251250691 0.0000070386975107

SOSTDC1

1.307302083

0.01398844161983930 0.0334172040607724

C1GALT1

1.307075893

0.00000170452973936 0.0000166457982360

FAM30A

1.305767857

0.00155368624292414 0.0053317990491563

OGFRL1

1.304950893

0.00000435307388841 0.0000372694682227

WNT10A

1.304446429

0.00002223652539214 0.0001478492379797

DCC1

1.304355655

0.00000227914467565 0.0000214608726521

FCRL5

1.304307143

0.00010697317619555 0.0005648002967030

CSDA

1.302102678

0.00000042229333442 0.0000051820878073

ID4

1.301690476

0.00495701721356650 0.0140107891847555

B3GNT3

1.300794643

0.00036478034404209 0.0015915372776706

DLX6

1.298393452

0.00000485328561663 0.0000404440468052

BCL11B

1.296407738

0.00036225546829032 0.0015832843893808

SMOC1

1.295780357

0.00000492388675112 0.0000409641160659

SLC7A5

1.295387649

0.00000000932037185 0.0000002068736990

SLC45A4

1.292709821

0.00000110734352978 0.0000116073745259

수치

Table 1. Baseline characteristics of 70 women with invasive  breast cancers as masses on breast MRI
Table 4. Functional annotation analysis of differentially expressed genes
Fig. 3. Enrichment plots of top gene sets (signatures) for groups 1 (A–D) and 2 (E, F)

참조

관련 문서

This study is to examine lexicon of &lt; EojeNaehun &gt; lexicologically and morphologically to identify characteristics of lexicon and how to form

Inhibitory effects of the concentration of methanol extracts from Plantago Asiatica against the COX-2 protein expression and iNOS expression of the MDA-MB-231 human

Therefore, elucidating the effect of oleic acid, a substance derived from broccoli sprout extract, on breast cancer stem cells along with broccoli sprout extract, can

• Hormone Therapy With or Without Combination Chemotherapy in Treating Women Who Have Undergone Surgery for Node-Negative Breast Cancer (The TAILORx Trial)..

Results: 44 of 1048 patients with gastric cancer(4.1%) had synchronous and metachronous cancers. The average time interval between gastric cancer and secondary primary cancer

We found that FoxO1 is constantly increased in MCF-7/ADR, adriamycin-resistant breast cancer cells, and FoxO1 has a critical role in the MDR1 gene expression (16).. There is

Results: The human breast cancer cell subline MCF-7/MX5 cells selected in the presence of 5 µg/ml mitoxantrone (MX) were more resistant to MX (15.7... Western blot and

Kameoka, “Sentinel lymph node biopsy for breast cancer patients using fluorescence navigation with indocyanine green,” World Journal of Surgical Oncology, Vol..