47
Clinical Psychopharmacology and Neuroscience 2017;15(1):47-52 Copyrightⓒ 2017, Korean College of Neuropsychopharmacology
Received: May 6, 2016 /Revised: July 18, 2016
Accepted: August 9, 2016
Address for correspondence: Dong Hyun Ahn, MD, PhD Department of Psychiatry and Institute of Mental Health, Hanyang University College of Medicine, 222 Wangshimni-ro,
Seongdong-gu, Hanyang Medical Center, Seoul 04763, Korea Tel: +82-2-2290-8425, Fax: +82-2-2298-2055
E-mail: [email protected]
*These authors contributed equally to the work as co-first authors. Dong Hoon Oh’s current affiliation is Seulha Mental Health Clinic, Jeju, Korea, and Institute for Health and Society, Hanyang University, Seoul, Korea.
This is an Open-Access article distributed under the terms of the Creative Commons Attribution Non-Commercial License (http://creativecommons.org/licenses/by-nc/4.0) which permits unrestricted non-commercial use, distribution, and reproduction in any medium, provided the original work is properly cited.
Predicting Autism Spectrum Disorder Using Blood-based Gene Expression
Signatures and Machine Learning
Dong Hoon Oh1,*, Il Bin Kim2,*, Seok Hyeon Kim3, Dong Hyun Ahn3
1
Institute for Health and Society, Hanyang University, Seoul, 2Translational Neurogenetics Laboratory, Graduate School of Medical Science and Engineering, Korea Advanced Institute of Science and Technology (KAIST), Daejeon, 3Department of Psychiatry and Institute of Mental Health, Hanyang University College of Medicine, Seoul, Korea
Objective: The aim of this study was to identify a transcriptomic signature that could be used to classify subjects with autism spectrum disorder (ASD) compared to controls on the basis of blood gene expression profiles. The gene expression profiles could ultimately be used as diagnostic biomarkers for ASD.
Methods: We used the published microarray data (GSE26415) from the Gene Expression Omnibus database, which included 21 young adults with ASD and 21 age- and sex-matched unaffected controls. Nineteen differentially expressed probes were identified from a training dataset (n=26, 13 ASD cases and 13 controls) using the limma package in R language (adjusted p value <0.05) and were further analyzed in a test dataset (n=16, 8 ASD cases and 8 controls) using machine learning algorithms. Results: Hierarchical cluster analysis showed that subjects with ASD were relatively well-discriminated from controls. Based on the support vector machine and K-nearest neighbors analysis, validation of 19-DE probes with a test dataset resulted in an overall class prediction accuracy of 93.8% as well as a sensitivity and specificity of 100% and 87.5%, respectively. Conclusion: The results of our exploratory study suggest that the gene expression profiles identified from the peripheral blood samples of young adults with ASD can be used to identify a biological signature for ASD. Further study using a larger cohort and more homogeneous datasets is required to improve the diagnostic accuracy.
KEY WORDS: Autism spectrum disorder; Blood; Microarray analysis; Transcriptome; Machine learning; Decision support techniques.
INTRODUCTION
Autism spectrum disorders (ASDs) are devastating neurodevelopmental disorders characterized by deficits in social communication and interaction across multiple contexts as well as restricted, repetitive patterns of inter-ests and behavior. The Centers for Disease Control re-cently presented that the prevalence of ASD has risen to approximately 1 in 68, and most children are not diag-nosed with ASD until after 4 years of age in the United States.1) Because early intensive behavioral and
devel-opmental interventions for toddlers and children with au-tism could improve outcomes,2) there is a scientific need
for reliable diagnostic ASD biomarkers that are expressed early in life. Such markers could have a significant impact on diagnosis and treatment.
Although the complex etiologies of ASD are poorly un-derstood, the high heritability of ASD is supported by high concordance rates (from 36% to 95%) in monozygotic twins and higher recurrence risks of 11% and 19% with single-sibling involvement.3-5) Rapid advances in clinical
genetic testing technology have increased the diagnostic yield from about 10% a few years ago to about 30%.6)
However, because many of these genetic variants show in-complete penetrance and variable phenotypic ex-pression,7) the use of gene expression signature bio-markers may be informative and provide the best model for identifying ASD cases.
In particular, four studies have investigated blood-de-rived gene expression signatures to differentiate between ASD individuals (toddlers and children) and unaffected controls.8-11) These studies focused on individuals with a
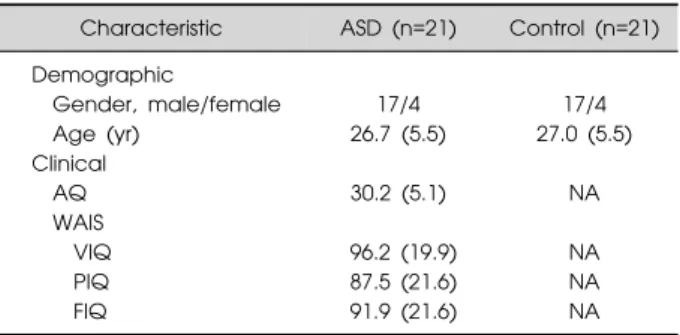
Table 1. Demographic and clinical characteristics of study subjects
Characteristic ASD (n=21) Control (n=21) Demographic Gender, male/female 17/4 17/4 Age (yr) 26.7 (5.5) 27.0 (5.5) Clinical AQ 30.2 (5.1) NA WAIS VIQ 96.2 (19.9) NA PIQ 87.5 (21.6) NA FIQ 91.9 (21.6) NA
Values are presented as number only or mean (standard deviation). ASD, autism spectrum disorder; AQ, autism spectrum quotient; WAIS, Wechsler Adult Intelligence Scale; IQ, intelligence quotients; VIQ, verbal IQ; PIQ, performance IQ; FIQ, full IQ; NA, not applied.
mean age of 2.2 to 9.6 years who were at risk for ASD, and there were relatively high predictive accuracies (between 68% and 91%). To date, no study has demonstrated diag-nostic prediction using blood-derived gene expression signatures in adult subjects with ASD. Accordingly, whether the gene expression profiles of adult individuals offer information about the ASD risk remains a critical question.
The aim of this study is to apply a transcriptomic ap-proach to identify a gene expression signature with prom-ising performance in the diagnostic prediction of young adults with ASD. Here, we used a published ASD micro-array dataset to test the hypothesis. These methods pro-vide researchers with the opportunity to test hypotheses without performing time-consuming, labor-intensive bench work.
METHODS
Acquisition of the Microarray Data
A publicly available microarray dataset (GSE26415) was downloaded from the Gene Expression Omnibus (http://www.ncbi.nlm.nih.gov/geo/) database,12) which
was deposited by Kuwano et al.13) The original data in-cluded 21 samples of peripheral leukocytes obtained from young adults with ASD and age- and sex-matched con-trols as well as from healthy women with children with ASD and matched controls. The pre-existing clinical diag-noses of ASD were made by experienced child psychia-trist and developmental pediatrician according to the Diagnostic and Statistical Manual of Mental Disorders, 4th edition, text revision (DSM-IV-TR). In order to cor-roborate the ASD diagnosis, the Japanese version of the Autism Spectrum Quotient was completed.13) The plat-form inplat-formation was GPL6480 (Agilent-014850 Whole Human Genome Microarray 4x44K G4112F). In this study, we utilized 42 microarrays from subjects with ASD (n=21) and their matched controls (n=21) for further analyses. The demographic and clinical characteristics of the study subjects are summarized in Table 1.
Data Preprocessing and Selection of Differentially Expressed Genes
The raw data in .CEL format were primarily processed using R language (http://www.r-project.org/)14) “limma”
package.15) The datasets were imported in R using the “read.maimages” function; the “normexp” function was used for background correction. The adjusted data were transformed with a logarithm for normalization using the
quantile method (Supplementary Fig. 1). Filtering was further achieved by building a criterion in which the 95th percentile of the negative probe on each array was set as a standard point of brightness. The control and low ex-pression probes were filtered out when the probes at one-third of the total arrays were 10% less bright than the standard point. The “avereps” function was used to aver-age the replicate spots on each array. Differentially ex-pressed (DE) probes were identified using the moderated
t-test from the limma package. p values were adjusted for
multiple testing with the Bonferroni correction, and probes were called significant when the adjusted p value was <0.05.
Development of a Prediction Model Using a Machine Learning Algorithm
We applied machine learning to develop a prediction model that used DE probes extracted from the training set, differentiating between individuals with ASD and controls in the test set. Our strategy included two main types of ma-chine learning, unsupervised and supervised learning.
For unsupervised learning, we adopted hierarchical cluster analysis using complete linkage and the Euclidean distance. Cluster analysis and visualization were per-formed using the “heatmap.2” function in the “gplots” package16) in R.
For supervised learning, we used three different chine learning algorithms, such as the support vector ma-chine (SVM),17) K-nearest neighbors (KNN)18) and linear
discriminant analysis (LDA).19) We performed prediction analysis in the subsequent sequential steps. Using the “set.seed” function in R, we randomly divided our data (n=42) into a training dataset (13 ASD and 13 control sub-jects) and test dataset (8 ASD and 8 control subsub-jects).
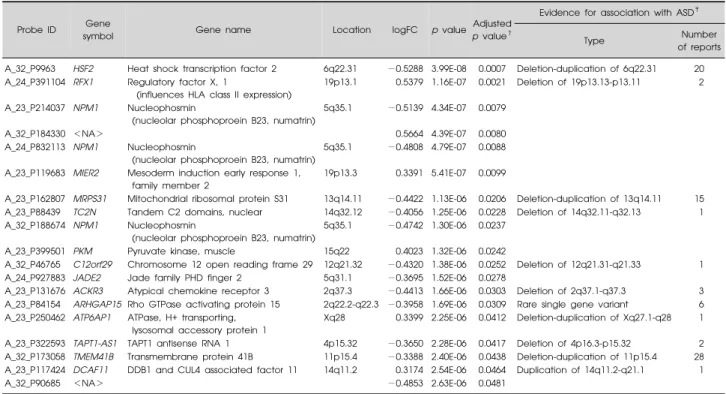
Table 2. Nineteen probes significantly dysregulated* in the ASD training sample compared with the unaffected control’s training sample
Probe ID Gene
symbol Gene name Location logFC p value
Adjusted p value†
Evidence for association with ASD‡
Type Number
of reports A_32_P9963 HSF2 Heat shock transcription factor 2 6q22.31 −0.5288 3.99E-08 0.0007 Deletion-duplication of 6q22.31 20 A_24_P391104 RFX1 Regulatory factor X, 1
(influences HLA class II expression)
19p13.1 0.5379 1.16E-07 0.0021 Deletion of 19p13.13-p13.11 2 A_23_P214037 NPM1 Nucleophosmin
(nucleolar phosphoproein B23, numatrin)
5q35.1 −0.5139 4.34E-07 0.0079
A_32_P184330 <NA> 0.5664 4.39E-07 0.0080
A_24_P832113 NPM1 Nucleophosmin
(nucleolar phosphoproein B23, numatrin)
5q35.1 −0.4808 4.79E-07 0.0088 A_23_P119683 MIER2 Mesoderm induction early response 1,
family member 2
19p13.3 0.3391 5.41E-07 0.0099
A_23_P162807 MRPS31 Mitochondrial ribosomal protein S31 13q14.11 −0.4422 1.13E-06 0.0206 Deletion-duplication of 13q14.11 15 A_23_P88439 TC2N Tandem C2 domains, nuclear 14q32.12 −0.4056 1.25E-06 0.0228 Deletion of 14q32.11-q32.13 1 A_32_P188674 NPM1 Nucleophosmin
(nucleolar phosphoproein B23, numatrin)
5q35.1 −0.4742 1.30E-06 0.0237 A_23_P399501 PKM Pyruvate kinase, muscle 15q22 0.4023 1.32E-06 0.0242
A_32_P46765 C12orf29 Chromosome 12 open reading frame 29 12q21.32 −0.4320 1.38E-06 0.0252 Deletion of 12q21.31-q21.33 1 A_24_P927883 JADE2 Jade family PHD finger 2 5q31.1 −0.3695 1.52E-06 0.0278
A_23_P131676 ACKR3 Atypical chemokine receptor 3 2q37.3 −0.4413 1.66E-06 0.0303 Deletion of 2q37.1-q37.3 3 A_23_P84154 ARHGAP15 Rho GTPase activating protein 15 2q22.2-q22.3 −0.3958 1.69E-06 0.0309 Rare single gene variant 6 A_23_P250462 ATP6AP1 ATPase, H+ transporting,
lysosomal accessory protein 1
Xq28 0.3399 2.25E-06 0.0412 Deletion-duplication of Xq27.1-q28 1 A_23_P322593 TAPT1-AS1 TAPT1 antisense RNA 1 4p15.32 −0.3650 2.28E-06 0.0417 Deletion of 4p16.3-p15.32 2 A_32_P173058 TMEM41B Transmembrane protein 41B 11p15.4 −0.3388 2.40E-06 0.0438 Deletion-duplication of 11p15.4 28 A_23_P117424 DCAF11 DDB1 and CUL4 associated factor 11 14q11.2 0.3174 2.54E-06 0.0464 Duplication of 14q11.2-q21.1 1
A_32_P90685 <NA> −0.4853 2.63E-06 0.0481
ASD, autism spectrum disorder; ID, intellectual disability; NA, not applied; logFC, log2 of fold change. *Adjusted p values <0.05; †Bonferroni correction.
‡
The Simons Foundation Autism Research Initiative (SFARI) Gene 2.0 database (available at http://gene.sfari.org).
Fig. 1. Heat-map overview of the two-way hierarchical clustering
analysis of 19 differentially-expressed probes. Each row represents the relative levels of expression for a single probe. The red or green color indicates relatively high or low expression, respec-tively. In the sample clustering dendrogram, red indicates autism spectrum disorder samples while blue indicates control samples.
Each algorithm was trained on the training dataset of 26 randomly selected samples, which were labeled with DE probes. Eight ASD and 8 control subjects in the test data-set were validated. All supervised machine learning anal-yses were performed using the “MLinterfaces” pack-ages20) in R language.
Supplementary Figure 2 briefly describes the study design. The protocol of this study was reviewed and ap-proved by the institutional review board of Hanyang University Hospital (HYUH IRB-2015-05-008).
RESULTS
Altered Gene Expression Profiling between the ASD and Control Groups
In comparing microarray data for the subjects with ASD (n=13) with those of unaffected controls (n=13) in the training dataset, a total of 19 DE probes were identified (adjusted p value <0.05), including 6 up-regulated probes and 13 down-regulated probes (Supplementary Fig. 3). Among the 19 probes, 15 were annotated as gene symbols using the Bioconductor “hgug4112a.db” package.21) Ten of these genes (or loci) had previously reported associa-tions with ASD (Table 2).
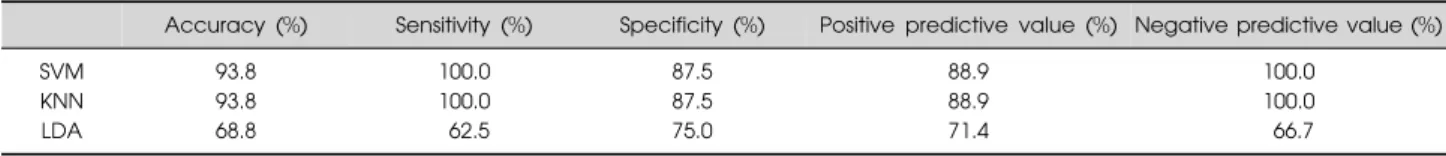
Table 3. Prediction performances of the 19-probe set on the test (validation) set, according to machine learning algorithms
Accuracy (%) Sensitivity (%) Specificity (%) Positive predictive value (%) Negative predictive value (%)
SVM 93.8 100.0 87.5 88.9 100.0
KNN 93.8 100.0 87.5 88.9 100.0
LDA 68.8 62.5 75.0 71.4 66.7
SVM, support vector machine; KNN, K-nearest neighbor; LDA, linear discriminant analysis.
Unsupervised Machine Learning
Using the 19-probe expression signature, a hierarchical cluster analysis of all samples (n=42) showed that ASDs were relatively well discriminated from controls (with the sorting of three ASD cases into the control group), sug-gesting that these probes could be helpful for differ-entiating between ASDs and controls. Detailed results from the hierarchical cluster analysis are presented in Figure 1.
Supervised Machine Learning
For the supervised machine learning algorithms, we simply built a classifier using the 19-probe expression sig-nature and assessed its predictive performance. With this 19-probe prediction model, the test dataset was used to validate the prediction of ASD. This validation test re-vealed that our prediction model successfully dis-tinguished between the individuals with ASD and controls. Both SVM and KNN analysis accurately identi-fied 8 individuals with ASD and 8 controls with the ex-ception of classifying one control as ASD, resulting in a predictive accuracy of 93.8% (sensitivity of 100% and specificity of 87.5%). However, in the LDA analysis, the diagnostic prediction of ASD vs. control samples was 68.8% accurate (Table 3).
DISCUSSION
Our analyses were designed to validate a potential bio-logical signature using peripheral blood microarray data obtained from young Asian adults with ASD in combina-tion with machine learning algorithms. In this exploratory study using previously published microarray data,13) we
identified a blood-based gene expression signature that re-liably identified young adults with ASD.
These results are consistent with the findings of four previous studies that reported on gene expression sig-natures with high diagnostic accuracy for toddlers and children with ASD.8-11) The results of this and four
pre-vious studies suggest that gene expression profiles from the peripheral blood samples contain a biological sig-nature that could be used to predict the ASD risk in both
children and young adults. According to several studies of healthy adults, the expression of most genes within in-dividuals remains temporally stable, and only 1% to 2% of genes display significant changes over time periods of at least one month.22,23) In addition, previous studies
ob-served that the cognitive, behavioral, and emotional symptoms of individuals with ASD generally persist over time.24,25) Therefore, the gene expression patterns under-lying these long-standing phenotypes may be constant over time in the transition children to young adults.
Gene expression microarrays primarily measure mes-senger RNA for thousands of identified genes.26) The mi-croarrays specifically evaluate the sequence of DNA that is transcribed to RNA in the genome at a given time. Prediction models using multivariate gene expression have been widely adopted for screening, diagnosis, and prognosis.27,28) Several previous transcriptome-wide
stud-ies of gene expression in ASD subjects have used post mortem brain tissue29-31) or peripheral blood samples.8-11,13)
Among them, the gene expression profiles using periph-eral blood have shown that RNA expression is disrupted across hundreds of genes in individuals with ASD. Blood-based analyses of gene expression profiles are en-couraging because blood samples are easily obtainable from living individuals and are likely to contain ASD-rel-evant signatures.
Although the connection between blood and brain tran-scriptomic profiles is not well known, growing evidence suggests that measurements performed in tissues that are not primarily involved in the disease process may uncover disease signatures.10) Sullivan et al.32) have established a
shared gene expression profile between whole blood and brain tissues suggesting that the cautious and thoughtful use of peripheral gene expression may be a useful surro-gate for gene expression in the brain. Further research will be required to determine whether the dysregulated sig-natures in peripheral blood are actual indicators of the brain pathophysiology in ASD. Our results could also pro-vide further epro-vidence of the emerging consensus that pe-ripheral blood is a potential source of biological signatures that are responsible for dysregulation of the brain and oth-er unreachable tissues.33)
The gene list in our study partially overlaps with pre-viously reported candidate genes and loci associations for ASD (Table 2). These various transcriptomic changes would be representative of the genomic alteration in the ASD. Blood-derived gene expression studies of subjects with ASD repeatedly demonstrate dysregulation of im-mune/inflammation genes.34) Regulatory factor X1
(RFX1; transcription factor regulating a wide variety of genes involved in immunity)35) expression was
sig-nificantly increased in the ASD group in our study. Substantial percentages of patients with ASD show pe-ripheral markers of mitochondrial energy metabolism dysfunction.36) We found the mitochondrial ribosomal
protein S31 (MRPS31) expression was significantly re-duced in the ASD group. In particular, we identified a probe (A_23_P399501, pyruvate kinase muscle isozyme [PKM]) that has the best ability for detecting whether a sample was collected from a patient with ASD (Supplementary Fig. 4). The PKM expression level was significantly higher in ASD subjects than in controls. Pyruvate kinase is an enzyme involved in glycolysis. Its primary function is to catalyze the transfer of a phosphate group from phosphoenolpyruvate to adenosine diphos-phate as the last step of glycolysis, generating one mole-cule of pyruvate and one molemole-cule of adenosine triphosphate.37) A previous study also demonstrated that the plasma pyruvate levels were higher in children with autism than in controls.38) These results suggested that the PKM expression level in peripheral blood may serve as a biomarker to distinguish ASD from controls.
Our study has several limitations, mostly stemming from small sample size and lack of phenotypic in-formation of the original data. In particular, most of ASD subjects in this study exhibited normal intelligence quo-tients (IQ; mean full scale IQ, 91.9), this probably does not represent the broader ASD population. Unfortunately, it is not well understood about the connection between the pe-ripheral blood and the brain transcriptomic profiles and the influence of age factor for gene expression in subjects with ASD. The results of our study should be cautiously interpreted. If further analysis is performed on a more ho-mogeneous dataset and validated in an independent, large cohort of cases and controls, the accuracy of the results should be higher. These strategies for class prediction analyses will help identify robust biomarkers for both the diagnosis of ASD and individualized treatment options for patients and their families.39)
In conclusion, this study reveals a blood-based gene ex-pression signature that has promising accuracy in
dis-tinguishing between young adults with ASD and age- and sex- matched unaffected controls. The ability of the 19 DE probes to correctly predict ASD samples compares favor-ably with the results of four previous studies on ASD diag-nosis in toddlers and children. This transcriptomics ap-proach may shed light on an important aspect of clinical biomarker discovery, offering high predictive accuracy for detecting ASD.
We thank Dr. Yuki Kuwano for generously depositing the microarray data series (GSE26415) online.
REFERENCES
1. Christensen DL, Baio J, Van Naarden Braun K, Bilder D, Charles J, Constantino JN, et al. Prevalence and
characteristics of autism spectrum disorder among children aged 8 years--autism and developmental disabilities monitoring network, 11 sites, United States, 2012. MMWR Surveill Summ 2016;65:1-23.
2. Warren Z, McPheeters ML, Sathe N, Foss-Feig JH, Glasser A, Veenstra-Vanderweele J. A systematic review of early
intensive intervention for autism spectrum disorders. Pediatrics 2011;127:e1303-e1311.
3. Constantino JN, Zhang Y, Frazier T, Abbacchi AM, Law P.
Sibling recurrence and the genetic epidemiology of autism. Am J Psychiatry 2010;167:1349-1356.
4. Ozonoff S, Young GS, Carter A, Messinger D, Yirmiya N, Zwaigenbaum L, et al. Recurrence risk for autism spectrum
disorders: a Baby Siblings Research Consortium study. Pediatrics 2011;128:e488-e495.
5. Rosenberg RE, Law JK, Yenokyan G, McGready J, Kaufmann WE, Law PA. Characteristics and concordance
of autism spectrum disorders among 277 twin pairs. Arch Pediatr Adolesc Med 2009;163:907-914.
6. Schaefer GB, Mendelsohn NJ. Clinical genetics evaluation
in identifying the etiology of autism spectrum disorders: 2013 guideline revisions. Genet Med 2013;15:399-407.
7. Codina-Solà M, Rodríguez-Santiago B, Homs A, Santoyo J, Rigau M, Aznar-Laín G, et al. Integrated analysis of whole-
exome sequencing and transcriptome profiling in males with autism spectrum disorders. Mol Autism 2015;6:21.
8. Glatt SJ, Tsuang MT, Winn M, Chandler SD, Collins M, Lopez L, et al. Blood-based gene expression signatures of
infants and toddlers with autism. J Am Acad Child Adolesc Psychiatry 2012;51:934-944.e932.
9. Hu VW, Lai Y. Developing a predictive gene classifier for
autism spectrum disorders based upon differential gene expression profiles of phenotypic subgroups. N Am J Med Sci (Boston) 2013;6:10.7156/najms.2013.0603107.
10. Kong SW, Collins CD, Shimizu-Motohashi Y, Holm IA, Campbell MG, Lee IH, et al. Characteristics and predictive
value of blood transcriptome signature in males with autism spectrum disorders. PLoS One 2012;7:e49475.
11. Pramparo T, Pierce K, Lombardo MV, Carter Barnes C, Marinero S, Ahrens-Barbeau C, et al. Prediction of autism
by translation and immune/inflammation coexpressed genes in toddlers from pediatric community practices. JAMA Psychiatry 2015;72:386-394.
12. Edgar R, Barrett T. NCBI GEO standards and services for ■ Acknowledgments
microarray data. Nat Biotechnol 2006;24:1471-1472.
13. Kuwano Y, Kamio Y, Kawai T, Katsuura S, Inada N, Takaki A, et al. Autism-associated gene expression in peripheral
leucocytes commonly observed between subjects with autism and healthy women having autistic children. PLoS One 2011;6:e24723.
14. R Core Team. R: a language and environment for statistical
computing. Vienna:R Foundation for Statistical Computing; 2013.
15. Ritchie ME, Phipson B, Wu D, Hu Y, Law CW, Shi W,
et al. limma powers differential expression analyses for RNA-sequencing and microarray studies. Nucleic Acids Res 2015;43:e47.
16. Warnes GR, Bolker B, Bonebakker L, Gentleman R, Liaw WHA, Lumley T, et al. gplots: various R programming tools
for plotting data. R package version, 2(4). 2012.
17. Cortes C, Vapnik V. Support-vector networks. Mach Learn
1995;20:273-297.
18. Shakhnarovich G, Indyk P, Darrell T. Nearest-neighbor
methods in learning and vision: theory and practice. Cambridge, MA:MIT Press;2006.
19. Fisher RA. The use of multiple measurements in taxonomic
problems. Ann Eugen 1936;7:179-188.
20. Carey V, Gentleman R, Mar J, Vertrees cfJ, Gatto L.
MLInterfaces: uniform interfaces to R machine learning procedures for data in Bioconductor containers. R package version 1.52.0. 2016.
21. Carlson M. hgug4112a.db: Agilent "Human Genome, Whole"
annotation data (chip hgug4112a). R package version 3.2.2. 2016.
22. Karlovich C, Duchateau-Nguyen G, Johnson A, McLoughlin P, Navarro M, Fleurbaey C, et al. A longitudinal study of
gene expression in healthy individuals. BMC Med Genomics 2009;2:33.
23. Campbell C, Vernon SD, Karem KL, Nisenbaum R, Unger ER. Assessment of normal variability in peripheral blood
gene expression. Dis Markers 2002;18:201-206.
24. Freeman BJ, Rahbar B, Ritvo ER, Bice TL, Yokota A, Ritvo R. The stability of cognitive and behavioral parameters in
autism: a twelve-year prospective study. J Am Acad Child Adolesc Psychiatry 1991;30:479-482.
25. Soke GN, Philofsky A, Diguiseppi C, Lezotte D, Rogers S, Hepburn S. Longitudinal changes in Scores on the Autism
Diagnostic Interview--Revised (ADI-R) in pre-school children with autism: Implications for diagnostic classification and symptom stability. Autism 2011;15:545-562.
26. Zhu B, Xu F, Baba Y. An evaluation of linear RNA
amplification in cDNA microarray gene expression analysis.
Mol Genet Metab 2006;87:71-79.
27. Lee J, Goh LK, Chen G, Verma S, Tan CH, Lee TS.
Analysis of blood-based gene expression signature in first-episode psychosis. Psychiatry Res 2012;200:52-54.
28. van't Veer LJ, Dai H, van de Vijver MJ, He YD, Hart AA, Mao M, et al. Gene expression profiling predicts clinical
outcome of breast cancer. Nature 2002;415:530-536.
29. Purcell AE, Jeon OH, Zimmerman AW, Blue ME, Pevsner J. Postmortem brain abnormalities of the glutamate
neurotransmitter system in autism. Neurology 2001;57: 1618-1628.
30. Nagarajan RP, Hogart AR, Gwye Y, Martin MR, LaSalle JM. Reduced MeCP2 expression is frequent in autism
frontal cortex and correlates with aberrant MECP2 promoter methylation. Epigenetics 2006;1:e1-e11.
31. Campbell DB, D'Oronzio R, Garbett K, Ebert PJ, Mirnics K, Levitt P, et al. Disruption of cerebral cortex MET
signaling in autism spectrum disorder. Ann Neurol 2007;62:243-250.
32. Sullivan PF, Fan C, Perou CM. Evaluating the comparability
of gene expression in blood and brain. Am J Med Genet B Neuropsychiatr Genet 2006;141B:261-268.
33. Baron CA, Liu SY, Hicks C, Gregg JP. Utilization of
lymphoblastoid cell lines as a system for the molecular modeling of autism. J Autism Dev Disord 2006;36:973-982.
34. Rossignol DA, Frye RE. A review of research trends in
physiological abnormalities in autism spectrum disorders: immune dysregulation, inflammation, oxidative stress, mitochondrial dysfunction and environmental toxicant exposures. Mol Psychiatry 2012;17:389-401.
35. Herrero Sanchez C, Reith W, Silacci P, Mach B. The
DNA-binding defect observed in major histocompatibility complex class II regulatory mutants concerns only one member of a family of complexes binding to the X boxes of class II promoters. Mol Cell Biol 1992;12:4076-4083.
36. Palmieri L, Persico AM. Mitochondrial dysfunction in
autism spectrum disorders: cause or effect? Biochim Biophys Acta 2010;1797:1130-1137.
37. Gupta V, Bamezai RN. Human pyruvate kinase M2: a
multifunctional protein. Protein Sci 2010;19:2031-2044.
38. Giulivi C, Zhang YF, Omanska-Klusek A, Ross-Inta C, Wong S, Hertz-Picciotto I, et al. Mitochondrial dysfunction
in autism. JAMA 2010;304:2389-2396.
39. Lee YJ, Oh SH, Park C, Hong M, Lee AR, Yoo HJ, et al.
Advanced pharmacotherapy evidenced by pathogenesis of autism spectrum disorder. Clin Psychopharmacol Neurosci 2014;12:19-30.