INTRODUCTION
Alzheimer disease (AD) is an age-related progressive
Fluid-Attenuated Inversion Recovery Hypointensity of
the Pulvinar Nucleus of Patients with Alzheimer Disease:
Its Possible Association with Iron Accumulation as
Evidenced by the T2* Map
Won-Jin Moon, MD
1, Hee-Jin Kim, MD
2, 3, Hong Gee Roh, MD
1, Jin Woo Choi, MD
1, Seol-Heui Han, MD
3, 4Departments of 1Radiology and 3Neurology, Konkuk University Medical Center, Konkuk University School of Medicine, Seoul 143-792, Korea; 2Department of Neurology, Hanyang University Medical Center, Hanyang University School of Medicine, Seoul 133-791, Korea; 4Center for Geriatric
Neuroscience Research, Konkuk University School of Medicine, Seoul 143-792, Korea
Objective: We hypothesized that prominent pulvinar hypointensity in brain MRI represents the disease process due to iron accumulation in Alzheimer disease (AD). We aimed to determine whether or not the pulvinar signal intensity (SI) on the fluid-attenuated inversion recovery (FLAIR) sequences at 3.0T MRI differs between AD patients and normal subjects, and also whether the pulvinar SI is correlated with the T2* map, an imaging marker for tissue iron, and a cognitive scale.
Materials and Methods: Twenty one consecutive patients with AD and 21 age-matched control subjects were prospectively included in this study. The pulvinar SI was assessed on the FLAIR image. We measured the relative SI ratio of the pulvinar to the corpus callosum. The T2* values were calculated from the T2* relaxometry map. The differences between the two groups were analyzed, by using a Student t test. The correlation between the measurements was assessed by the Pearson’s correlation test.
Results: As compared to the normal white matter, the FLAIR signal intensity of the pulvinar nucleus was significantly more hypointense in the AD patients than in the control subjects (p < 0.01). The pulvinar T2* was shorter in the AD patients than in the control subjects (51.5 ± 4.95 ms vs. 56.5 ± 5.49 ms, respectively, p = 0.003). The pulvinar SI ratio was strongly correlated with the pulvinar T2* (r = 0.745, p < 0.001). When controlling for age, only the pulvinar-to-CC SI ratio was positively correlated with that of the Mini-Mental State Examination (MMSE) score (r = 0.303, p < 0.050). Conversely, the pulvinar T2* was not correlated with the MMSE score (r = 0.277, p = 0.080).
Conclusion: The FLAIR hypointensity of the pulvinar nucleus represents an abnormal iron accumulation in AD and may be used as an adjunctive finding for evaluating AD.
Index terms: Alzheimer disease; Magnetic resonance imaging; T2* relaxometry; Thalamus; Pulvinar nucleus; Iron
Received February 6, 2012; accepted after revision May 29, 2012. Corresponding author: Seol-Heui Han, MD, Center for Geriatric Neuroscience Research, Konkuk University School of Medicine, 120-1 Neungdong-ro, Gwanjin-gu, Seoul 143-792, Korea.
• Tel: (822) 2030-7561 • Fax: (822) 2030-7469
• E-mail: [email protected]
This is an Open Access article distributed under the terms of the Creative Commons Attribution Non-Commercial License (http://creativecommons.org/licenses/by-nc/3.0) which permits unrestricted non-commercial use, distribution, and reproduction in any medium, provided the original work is properly cited.
Korean J Radiol 2012;13(6):674-683
degenerative disease of the brain, and it is clinically characterized by an early dysfunction of memory and cognition. The neuropathological hallmarks of AD are senile plaques and neurofibrillary tangles that are formed by an accumulation of abnormal extracellular ß-amyloid protein (Aß) and intracellular hyperphosphorylated tau-protein, respectively. Aß is especially thought to have a pivotal role in the development of AD (1). Recent studies have suggested that Aß precipitation and its toxicity are related with an abnormal amount of iron content (2). Accumulation of iron in the AD brain occurs in proximity to the neuritic plaques (2). A recent animal study first demonstrated the iron accumulation within the amyloid plaque in the pISSN 1229-6929 · eISSN 2005-8330
thalamus by using a magnetic resonance imaging (MRI) (3). Although the primary sites of AD pathology are
the cerebral cortices, including the hippocampi and parahippocampal gyri, AD pathology also involves the subcortical deep nuclei (4-6). Among the subcortical deep nuclei, the pulvinar nucleus has not been a subject of dementia research until recently, yet it has been suggested to have a major role in various cognitive functions, such as attention and visual processing, as well as memory (7-10).
The application of high-field (3T) MRI in routine clinical practice has enabled a detection of subtle abnormality, which could not be seen with 1.5T, and 3T MRI provides a higher signal-to-noise ratio (SNR) and contrast-to-noise ratio (CNR), in addition to better spatial resolution (11). Even the routine fluid-attenuated inversion recovery (FLAIR) sequence can offer a different perspective concerning a patient’s disease by providing better image quality at 3T MRI than at 1.5T MRI.
Before undertaking this prospective study, we incidentally observed that a substantial portion of AD patients showed FLAIR hypointensity in the thalamus, and this FLAIR hypointensity was localized at the pulvinar nucleus. Until recently, there have been almost no reports on FLAIR signal alteration of the pulvinar nucleus of the thalamus in either pathologic or normal conditions. Only one recent study has reported on the FLAIR hypointensity of the pulvinar nucleus in 11 healthy individuals at 3T, as compared to that at 1.5T, and the number of cases in that study was rather small to generalize the results (12).
We hypothesized that pulvinar hypointensity would be more common in AD patients as compared to that in healthy individuals, and pulvinar hypointensity represents iron accumulation due to a neurodegenerative process, associated with primary AD pathology. We made the assumption that the long TR and long TE of FLAIR, as well as the high field strength at 3T, as compared with 1.5T, might cause a more prominent T2* effect on FLAIR, and therefore, FLAIR signal intensity will be positively correlated with the T2* relaxation time (T2*) (13, 14). Considering this, T2* measurement would be crucial to test our hypothesis since the measurement of T2* has been used for in vivo quantitative analysis of the iron content of different tissues (15, 16).
Hence, we conducted this prospective study to investigate if the pulvinar signal intensity on FLAIR, as evaluated by using 3T magnetic resonance (MR) imaging with including the T2* map, differs between AD patients and normal
subjects in terms of the hypointensity, and if the pulvinar signal intensity is correlated with the T2* relaxometry map as a tissue iron marker and with the Mini-Mental State Examination (MMSE) score as a marker of disease severity.
MATERIALS AND METHODS
Study Population
This study was approved by the institutional review board at our institution. All the participants or their guardians provided written informed consent for participation in this study.
From December 2006 to November 2007, 21 consecutive patients with AD and 21 age-matched healthy control subjects were enrolled in this prospective study (Table 1). The patients with AD were recruited from the Dementia-Memory Disorder Clinic of our hospital. The patients with AD were diagnosed according to the criteria of the National Institute of Neurological and Communicative Disorders and Stroke and the Alzheimer’s Disease and Related Disorders Association (NINCDS/ADRDA) (17).
Twenty one age-matched control subjects were selected from a consecutive series of patients, who were referred for the same MR imaging protocol as the patients with AD, as part of a routine medical checkup between December 2006 and December 2007. The following criteria were used for inclusion in the study: no clinical evidence of neuropsychiatric disorders and no apparent abnormal finding on the MR study. A neuroradiologist reviewed all the MR images. We excluded those patients with a history of neurological disease, malignancy, stroke or brain surgery. Any subjects who showed focal neurologic deficits on a detailed neurological examination were also excluded. The indications for MRI included headache (n = 8), dizziness or vertigo (n = 13).
All the eligible subjects undertook a standard battery of neuropsychological tests, including assessment of the
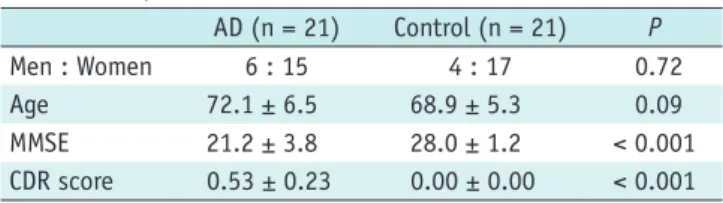
Table 1. Demographic Data of Alzheimer Disease Group and Control Group* AD (n = 21) Control (n = 21) P Men : Women 6 : 15 4 : 17 0.72 Age 72.1 ± 6.5 68.9 ± 5.3 0.09 MMSE 21.2 ± 3.8 28.0 ± 1.2 < 0.001 CDR score 0.53 ± 0.23 0.00 ± 0.00 < 0.001 Note.— *Values are means ± standard deviations. AD = Alzheimer disease, MMSE = Mini-Mental State Examination, CDR = Clinical Dementia Rating
global cognitive impairment using the Mini-Mental State Examination (MMSE) (18) score and the global functional impairment using the Clinical Dementia Rating (CDR) scale (19). The MR imaging data of the patients were visually inspected by a neuroradiologist to rule out any major neuropathology, other than neurodegeneration, such as a tumor, stroke and severe white matter disease.
MR Imaging Protocol
A 3T unit (Signa HDx; GE Medical Systems, Milwaukee, WI, USA) with an 8 channel head coil was used for MR imaging. The routine MR imaging protocol included the following sequences: 1) the axial and sagittal T1-weighted inversion recovery sequences (repetition time [TR]/echo time [TE]/ inversion time [TI]: 2468/12/920 msec, section thickness: 5 mm, matrix: 512 x 224), 2) the axial T2-weighted fast spin-echo sequence (TR/effective TE: 4000/106 msec, section thickness: 5 mm, matrix: 384 x 384), 3) the axial fluid-attenuated inversion recovery sequence (FLAIR, TR/ TE/TI: 11000/105/2600 msec, section thickness: 5 mm, matrix: 384 x 224), 4) the axial T2*-weighted gradient-echo sequence (TR/TE: 550/17 msec, section thickness: 5 mm, matrix: 384 x 224, flip angle: 15°) and 5) the T1-weighted volumetric spoiled gradient-echo sequence (SPGR) (TR/ TE: 7.3/2.7 msec, section thickness: 1.5 mm, matrix: 256 x 256, flip angle: 13°). The field of view of all the sequences was 230 x 230 mm.
The T2* weighted images for the quantitative T2* map were obtained with a single-shot echo-planar imaging sequence at a TE of 20, 40, 60, 80, 100, 120, 140, 160 and 180 msec and a TR of 10000 msec within a total acquisition time of 4.5 minutes (section thickness: 3.5 mm, matrix: 128 x 128, field of view: 240 x 240 mm, flip angle: 90° and a NEX of 3). The T2* maps were obtained using the manufacturer’s software (Functool, GE, Milwaukee, WI, USA). The T2* values were calculated for each voxel by voxel-by-voxel fitting of the data acquired at the nine TEs to obtain a monoexponential signal intensity decay curve, which is given by SI (t) = SI0 e-t/T2* (t = echo time, SI = measured
signal, SI0 = constant, T2* = effective transverse relaxation
time) (20). All the axial images of all the sequences were obtained parallel to the anterior commissure to the posterior commissure (AC-PC) line.
Image Analysis
Two expert neuroradiologists, with more than 10 years of experience each in neuroimaging, reviewed all the
images; any disagreements were resolved by a consensus. The reviewers were ‘blinded’ to the clinical diagnosis. On the FLAIR images, the SI of the pulvinar nucleus was graded with a four-point scoring system, according to the signal intensity relative to the adjacent structures: the SI of the pulvinar nucleus was graded as isointense (grade 0), compared with the SI of the remaining thalamus, as mildly hypointense (grade 1) when it was hypointense relative to the SI of the remaining thalamus, as moderately hypointense (grade 2) when it has hypointense relative to the SI of the adjacent temporal white matter, and as markedly hypointense (grade 3) when it was hypointense relative to the SI of the globus pallidus.
In addition, the presence of T1 hyperintensity of the pulvinar nucleus was evaluated on the T1-weighted images.
Quantitative imaging analysis was performed by one neuroradiologist and using a free software, called Medical Image Processing Analysis, and Visualization (MIPAV) software (Center for Information Technology, National Institutes of Health, Bethesda, MD, USA) on a PC workstation. Both the FLAIR and T2* map images were automatically realigned with each other in the MIPAV software program. The FLAIR signal intensities for each hemisphere were measured in 4 distinct regions of interest (ROIs): the pulvinar (PUL), the putamen (PUT), the globus pallidus (GP) and the splenium of the corpus callosum (CC) (Fig. 1). The CC was chosen as a reference to calculate the relative SI ratio. The PUT and GP were chosen to validate the above qualitative analysis since the PUT and GP were used as internal references for qualitative evaluation. For the definition of the first three ROIs, the axial section at the level of the anterior commissure was used. The ROIs of the CC were located at the central portion of the splenium of the CC in the axial slice that showed the largest extension of the corpus callosum. The ROIs were oval-shaped, with an area of 24 ± 2 mm2 for the PUL and CC.
Concerning the PUT and GP, the ROIs were polygonal in shape, as to conform to the shape of the structures. The ROIs were carefully chosen to minimize the partial volume effects and to avoid possible artifacts. For the ROIs on the FLAIR images, the relative signal intensity ratio of the PUL, PUT and GP was calculated, using the CC as a reference as follows: A/CC ratio = SI of the A/SI of the CC, where A is the SI of the PUL, PUT or GP.
The predefined ROIs of the PUL, PUT or GP on the FLAIR images were transferred to the corresponding T2* images, which were realigned to the same axial location as those of
the FLAIR images in the MIPAV software program.
All the measurements on the FLAIR and T2* images were performed twice at an interval of at least 2 weeks between the sessions by the same neuroradiologist. The mean of the four measurements (two sessions of two measurements determined from each hemisphere) was used as the final measured value for each case.
Statistical Analysis
Statistical analysis was performed using the statistical software package SPSS (version 12.0 for Windows; SSPS, Chicago, IL, USA). The level of significance was set at
p < 0.05. All the continuous variables were tested for
normalization.
The difference in gender distribution between the AD and control subjects was evaluated with a Fisher’s exact test, while the age and clinical features (MMSE) were evaluated with a two-tailed Student’s t test.
A Mann-Whitney test was used to compare the grading of the PUL hypointensity between the AD and control subjects. Analysis of variance (ANOVA) with Bonferroni’s post hoc comparison was used to compare the FLAIR SI ratios among the PUL, PUT and GP in each group. A two-tailed Student t test was used for continuous variables to compare the MR
measurements between the two groups.
The correlation between the specific region SI ratio and the corresponding T2* was calculated by using a Pearson’s correlation coefficient. The correlations between the clinical scores (MMSE) and the MR measurements were assessed with Pearson’s correlation coefficient, and the partial correlation test with controlling for age.
The differences between the right and left signal intensities, in all the regions, were also assessed with a paired t tests and Pearson’s correlation coefficient. The intra-rater reliability between the two measurement sessions was assessed with the intra-class coefficient (ICC).
RESULTS
The demographic data is shown in Table 1. There was no significant difference of the age and gender distribution between the AD and control subjects.
As compared to the normal white matter, the FLAIR signal intensity of pulvinar nucleus was significantly more hypointense in the AD patients than that in the control subjects (p = 0.005, Mann-Whitney test). The FLAIR signal intensity of the AD patients was Grade 0 in 2 cases (9.5%), Grade 1 in 6 cases (28.6%) and Grade 2 in 13 cases (61.9%),
A B
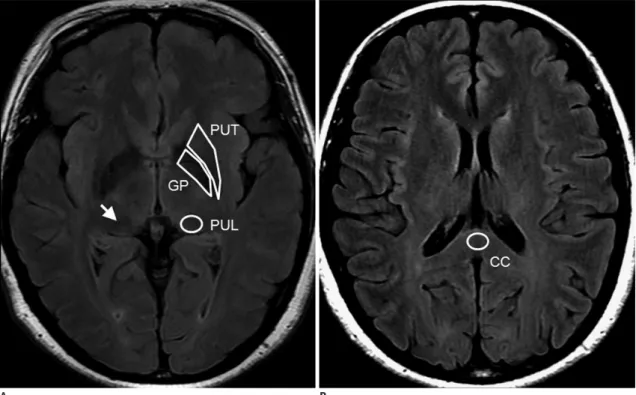
Fig. 1. Four different Regions of Interest (ROIs) on fluid attenuated inversion recovery (FLAIR) images.
A. Axial FLAIR image at level of AC-PC line. White arrow indicates pulvinar nucleus (PUL). Polygonal ROIs are placed around putamen (PUT) and globus pallidus (GP). B. Axial FLAIR image at level of corpus callosum. ROI for corpus callosum (CC) is placed at central part of corpus callosal splenium.
while that of the control subjects was Grade 0 in 9 cases (42.9%), Grade 1 in 7 cases (33.3%) and Grade 2 in 5 cases (23.8%) (Fig. 2).
There was no evidence of T1 hyperintensity in either the AD or the control subjects.
The PUL/CC, PUT/CC and GP/CC ratios were significantly different from each other in either the AD or the control groups (p < 0.002 for PUL/CC vs. PUT/CC in the AD groups, otherwise p < 0.001) (Table 2).
The PUL/CC ratio was significantly lower in the AD
A
C
B
D
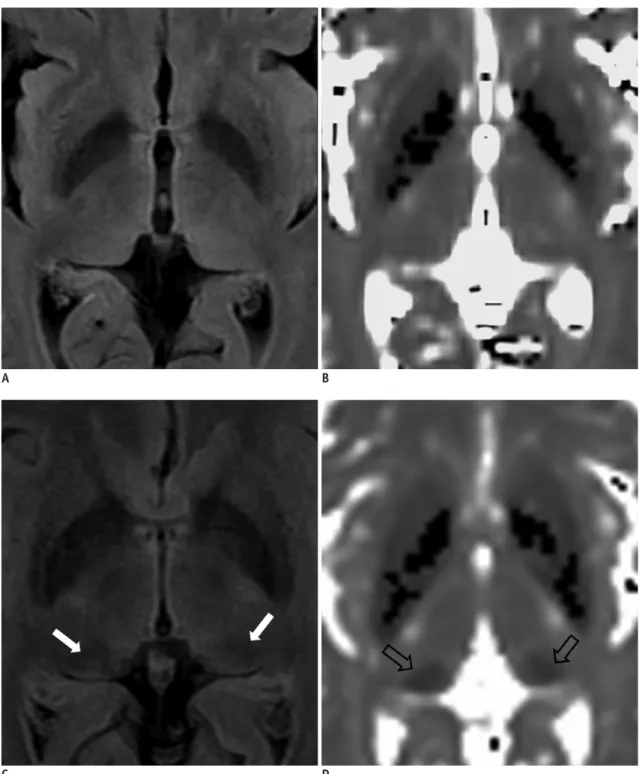
Fig. 2. Difference of fluid-attenuated inversion recovery signal intensity and T2* values of thalamic pulvinar nuclei in Alzheimer disease subject and control subject.
There is no discernable hypointensity (A) and T2* shortening (B) of pulvinar nuclei in age-matched control subject. In contrast, white arrows indicate bilateral hypointense pulvinar nuclei relative to remaining thalami in patient with Alzheimer disease (C). Prominent T2* shortening is noted in this patient (arrows) (D).
subjects than in the control subjects (p < 0.01). While the PUT/CC ratio was significantly decreased in the AD patients, as compared to that of the control subjects (p < 0.01), the GP/CC ratio showed no significant difference between the two groups (p = 0.09).
The PUL T2* was 51.52 ± 4.95 ms in the AD patients versus 56.55 ± 5.49 in the control subjects (p = 0.003). The PUL/CC ratio and the PUL T2* showed a strong correlation with each other (r = 0.745, p < 0.001). The PUT T2* and the PUT/CC ratio were also significantly lower in the AD patients than in the control subjects (p = 0.015).
When the control subject group and AD group were combined, the PUL/CC ratio and PUT/CC ratio showed a positive correlation with the MMSE score (r = 0.319, p = 0.020 and r = 0.317, p = 0.021, respectively). Yet when controlling for age, only the PUL/CC ratio was positively correlated with the MMSE score (r = 0.303, p < 0.05), suggesting a disease effect. On the other hand, the PUL T2* tended to decrease as the MMSE score decreased, but there was no statistical significance (r = 0.277, p = 0.080). In the AD group alone, the PUL/CC ratio, the PUT/CC ratio, the GP/ CC ratio and the corresponding T2* values did not correlate with the MMSE score (r = -0.005, p = 0.983; r = 0.035, p = 0.884; r = -0.139, p = 0.559; r = -0.149, p = 0.530; r = 0.108,
p = 0.649; r = 0.203, p = 0.406, respectively).
The right and left signal intensities of all the ROIs showed no significant difference in both groups (p > 0.05). The correlation coefficients for the right and left FLAIR signal intensities were 0.912 for the PUL, 0.872 for the PUT and 0.962 for the GP; the correlation coefficient for the right and left T2* was 0.908 for the PUL T2*. The ICC for the intrarater reliability was 0.944 and 0.927 for the right and left PUL T2*, respectively, 0.920 and 0.917 for the right and left PUT T2*, 0.894 and 0.903 for the right and left GP T2*, 0.994 and 0.997 for the right and left PUL FLAIR signal intensities, 0.995 for the CC FLAIR signal intensity, 0.996 and 0.997 for the right and left PUT FLAIR signal
intensities, and 0.995 and 0.975 for the right and left GP FLAIR signal intensities, respectively.
DISCUSSION
In this study, we report on the results of the FLAIR hypointensity and T2* measurement of the pulvinar nucleus, which may represent an iron accumulation in AD patients. We found that the FLAIR hypointensity was more prominent in the AD subjects than that in the age-matched control subjects, and the FLAIR hypointensity was correlated with T2* shortening.
The presence of FLAIR hypointensity or T2 hypointensity can be found in various conditions, in addition to
hemorrhage (21). There have been reports on T2/FLAIR hypointensity of the pre- and postcentral cortex in the normal brain, and in the brain with amyotrophic lateral sclerosis (22), in the basal ganglia and thalami in the brain with multiple sclerosis (23), in the basal ganglia, subtantia nigra and dentate nucleus in the brain with normal aging (24) and in the brain with Parkinson syndrome (25). Although several factors, such as iron accumulation (22, 24), oxygen free radicals (26) and increased lipofuscin granules within the neurons (27), have all been suggested as the causes of hypointensity, several recent studies have highlighted iron accumulation as having a major role in T2/ FLAIR hypointensity (24, 28). Yet, regarding the pulvinar nucleus, only one recent study has observed the FLAIR hypointensity in healthy individuals by using 3T MR imaging (12). Hence, to the best of our knowledge, our study is the first report that has demonstrated more prominent FLAIR hypointensity of the pulvinar nucleus in AD patients than in healthy controls.
The pulvinar is the largest nucleus of the thalamus, and it is well developed in human and primates (29). It is made up of three main parts: the medial, inferior and lateral pulvinar (30). According to the previous nonhuman primate
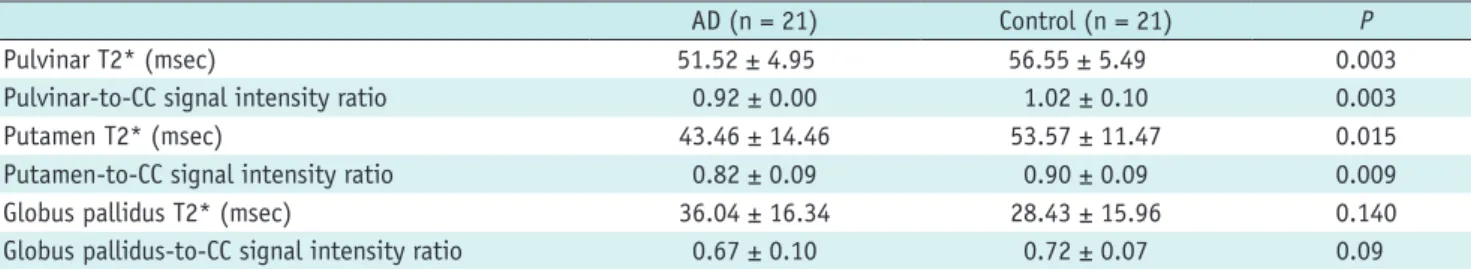
Table 2. Magnetic Resonance Measurement of Signal Intensity on FLAIR and T2* of Deep Gray Structures
AD (n = 21) Control (n = 21) P
Pulvinar T2* (msec) 51.52 ± 4.95 56.55 ± 5.49 0.003
Pulvinar-to-CC signal intensity ratio 0.92 ± 0.00 1.02 ± 0.10 0.003
Putamen T2* (msec) 43.46 ± 14.46 53.57 ± 11.47 0.015
Putamen-to-CC signal intensity ratio 0.82 ± 0.09 0.90 ± 0.09 0.009
Globus pallidus T2* (msec) 36.04 ± 16.34 28.43 ± 15.96 0.140
Globus pallidus-to-CC signal intensity ratio 0.67 ± 0.10 0.72 ± 0.07 0.09 Note.— Pulvinar versus PUT in AD p = 0.002, others in AD and control p < 0.001. FLAIR = fluid-attenuated inversion recovery, AD = Alzheimar disease, PUT = putamen, CC = corpus callosum
studies, the medial pulvinar interconnects with the parieto-occipital cortex (31), prefrontal cortex, posterior cingulum, retrosplenial and posterior parahippocampal cortex (29), while the inferior and lateral parts of the pulvinar nucleus have connections with the occipital, parietal and temporal lobes (32). A recent human study that employed a diffusion tensor imaging has reproduced the extensive cortico-pulvinar connections, as were reported in the previous nonhuman studies (33). The major function of the pulvinar nucleus is suggested to be visuospatial attention (9, 34, 35) and higher-order visual processing (8, 36). A study on the brain stimulation in humans has even suggested a role of the pulvinar nucleus in verbal and nonverbal memory (37).
Although AD has a predilection for the cerebral cortex, previous pathologic studies have reported that the thalamic nuclei are involved in the later stages of AD (4, 5, 38). Pulvinar involvement has been reported in all the patients with AD by previous neuropathologic studies (5, 7, 39-41). Postmortem studies have shown the presence of amyloid plaques, and neuronal loss in the pulvinar nucleus in AD brains (5, 6). The pulvinar hypointensity of the AD patients, in our study, may also represent a certain pathology associated with AD.
Pathologic studies have revealed that iron accumulation in the brain increases with age, and this also contributes to the neurodegenerative diseases, including AD, Parkinson disease and dementia with Lewy bodies (2, 42). Hallgren and Sourander (43) demonstrated the presence of
physiologic iron accumulation in the brain in the following sites (in descending order): globus pallidus, red nucleus, substantia nigra, putamen, dentate nucleus and caudate nucleus. Our result for PUT T2* supports these previous pathologic studies. A lesser amount of nonheme iron was found in the thalamus (43). Brain iron, other than that found in hemoglobin, is mostly protein bound, and the different forms of nonheme iron include ferritin (most common), transferrin, lactoferrin, hemosiderin, ionic iron and biogenic magnetite (28, 44, 45). The recent MR studies are in agreement with the histologic findings of the iron accumulation in the normal aging brain, as well as in various neurodegenerative conditions of the brain (16, 20, 24, 28, 42, 46-48). However, the thalamus does not show an age-related iron deposition when studied by using a T2* relaxometry (20). Conversely, iron deposition, seen as T2* hypointensity or T2* shortening, has been reported in the thalamus in some pathologic conditions, such as multiple sclerosis (49), children’s infarction (50) and
aceruloplasminemia (51).
Two recent human MR studies have demonstrated an abnormal iron accumulation in the brains of AD patients (48, 52). Brar et al. (52) reported a prominent iron accumulation in the substantia nigra of AD patients, who developed parkinsonism during the disease course. Zhu et al. (48) have shown, by using a phase-corrected MR imaging, that the bilateral hippocampi, parietal cortex, putamen, caudate nucleus and dentate nucleus showed significantly higher iron content in AD patients, as compared to that of healthy controls. But in the same study, the thalamus, as a whole, did not show an increased concentration of iron. There has been no previous report on visualizing the iron accumulation of the pulvinar nucleus in AD patients by performing MR imaging.
On the other hand, several animal studies that were done at high magnetic fields have revealed that amyloid plaques can be detected as hypointense structures by MR imaging (3, 53-57). A recent APP/PS1 murine study reported T2* hypointensity in the ventral posteromedial and posterior thalamic nuclei as an evidence of iron accumulation in the thalamus (3). That study demonstrated that T2* hypointensity coincides with a high iron and calcium content within the amyloid plaque (3). Furthermore, the thalamic amyloid plaque was reported to have more dense iron aggregates, as compared with the amyloid plaque in the other brain regions (3, 54, 56). In contrast, Meadowcroft et al. (57) suggested that different amyloid plaque morphologies also play a role in the T2* hypointensity of amyloid plaques in APP/PS1 mouse tissues. Given these reports, we suggest that the pulvinar hypointensity in AD patients and that are observed on FLAIR might be used as an MR imaging marker for the thalamic amyloid plaques or at least as an MR imaging marker for thalamic iron accumulation.
Considering the lack of reports on pulvinar hypointensity in AD patients since the advent of MR imaging, visualization of FLAIR hypointensity of the pulvinar in our study may be partly due to the fact that the previous studies did not separately analyze the subregions of the thalami, unlike our study, and partly due to the higher strength scanner we used. With higher field MR imaging, the magnetic susceptibility effect of a paramagnetic substance, such as tissue iron, is increased. Furthermore, the longer TR and TE might have enhanced the T2* shortening effect (13). Therefore, T2* shortening, which is normally not prominent on FLAIR, may be enhanced enough to visualize the
increased brain iron content on FLAIR imaging, at higher field MR.
In our study, the FLAIR hypointensity was well correlated with the T2* value, measured from the T2* map, which supports our hypothesis that FLAIR hypointensity is caused by the abnormally increased iron content of the pulvinar nucleus. T2* relaxometry has been previously used for the quantifying tissue iron in various organs (15, 16, 20). There are other techniques that have enabled in vivo quantitative measurement of tissue iron, such as phase-corrected imaging (48), susceptibility weighted imaging (28) and the field dependent relaxation rate increase imaging (42). Among those techniques, T2* relaxometry is a relatively simple and well established technique with a shorter acquisition time (13).
We made the assumption that FLAIR hypointensity and/or the T2* value of the pulvinar nucleus would be correlated with the clinical scale (MMSE). This assumption was based on the fact that the pulvinar nucleus has extensive connections with the cerebral cortices, and the cerebral cortices are primarily involved in AD. While the correlation between the FLAIR hypointensity of the pulvinar nucleus and the MMSE was weak in the combined AD and control group, the T2* was not correlated with the MMSE. The AD group alone did not show any correlation between the MR measurements and the MMSE. This lack of correlation between the T2* (or pulvinar hypointensity) and the MMSE may be partly due to the fact that the MMSE does not represent the linear function of cognitive decline. In addition, MMSE does not measure specific cognitive function, but rather, it assesses the general cognitive decline. The MMSE does not linearly represent general cognitive decline as well. The function of the pulvinar is known to be attention, i.e., visual and/or auditory attention and attention processing (33-36). Therefore, the correlation of the pulvinar hypointensity with more specific clinical tools for measuring the attention deficit may be necessary in a future study. The other reason for the lack of correlation might be a methological issue, associated with the calculation of the T2*. We did not perform any postprocessing correction for B0 inhomogeneity for better T2* calculation because we assumed that the macroscopic field distortion would be minimal in the center of the T2* images, which is where the ROIs were chosen for this study. Perhaps additional postprocessing correction for B0 inhomogeneity might have improved the T2* calculation, and this might improve the correlation between the T2*
values and the clinical scales (58). Finally, the lack of a link between the MR measurements and the MMSE might be attributed to a possible inclusion of the future AD-converters in the control subjects.
There are some limitations to address in this study. First, the study included only clinically defined AD. Thus, this study requires further testing by comparing with the results from the pathology and amyloid imaging. Second, we performed ROI-based analysis by a single rater, rather than a computer-based analysis, such as a voxel-based analysis. Finally, there is still a possibility that several other metals in a diseased brain, such as copper and zinc, might have affected the MR signal due to their magnetic susceptibility (59). Although the T2* map is regarded as a good tool for measuring tissue iron (15), B0 inhomogeneity due to macroscopic field distortion may hamper the precise quantification of different types of tissue iron. Therefore, further optimization of the T2* map with postprocessing is required for future study. Other new techniques, such as SWI phase imaging might be an alternative for measuring the brain iron (28). We did not analyze T2* values for other structures, such as hippocampi and cerebral cortex because the research focus of this study was pulvinar nucleus. Further study using T2* map for the entire brain in patients with AD would be necessary to better understand the iron-related neurodegeneration in AD. Our results should be confirmed in a larger scale investigation, yet our new finding could be used as a surrogate marker for the presence of AD changes in the thalamus.
In conclusion, FLAIR hypointensity of the pulvinar nucleus and T2* shortening are more prominent in AD patients than in healthy individuals. While the FLAIR hypointensity was correlated with the MMSE score, the T2* did not show a significant correlation with the MMSE. We suggest that pulvinar hypointensity may be used as an adjunctive finding in the evaluation of AD.
Acknowledgements
This research was supported by the second stage of BK 21 (Brain Korea 21) Project in 2008.
This research was also supported by Konkuk University in 2012.
REFERENCES
1. Hardy J, Selkoe DJ. The amyloid hypothesis of Alzheimer’s disease: progress and problems on the road to therapeutics.
Science 2002;297:353-356
2. Zecca L, Youdim MB, Riederer P, Connor JR, Crichton RR. Iron, brain ageing and neurodegenerative disorders. Nat Rev
Neurosci 2004;5:863-873
3. Dhenain M, El Tannir El Tayara N, Wu TD, Guégan M, Volk A, Quintana C, et al. Characterization of in vivo MRI detectable thalamic amyloid plaques from APP/PS1 mice. Neurobiol Aging 2009;30:41-53
4. Braak H, Braak E. Neuropathological stageing of Alzheimer-related changes. Acta Neuropathol 1991;82:239-259
5. Kuljis RO. Lesions in the pulvinar in patients with Alzheimer’s disease. J Neuropathol Exp Neurol 1994;53:202-211
6. Leuba G, Saini K. Pathology of subcortical visual centres in relation to cortical degeneration in Alzheimer’s disease.
Neuropathol Appl Neurobiol 1995;21:410-422
7. Rizzo M, Anderson SW, Dawson J, Myers R, Ball K. Visual attention impairments in Alzheimer’s disease. Neurology 2000;54:1954-1959
8. Kaas JH, Lyon DC. Pulvinar contributions to the dorsal and ventral streams of visual processing in primates. Brain Res Rev 2007;55:285-296
9. Snow JC, Allen HA, Rafal RD, Humphreys GW. Impaired attentional selection following lesions to human pulvinar: evidence for homology between human and monkey. Proc Natl
Acad Sci U S A 2009;106:4054-4059
10. Zarei M, Patenaude B, Damoiseaux J, Morgese C, Smith S, Matthews PM, et al. Combining shape and connectivity analysis: an MRI study of thalamic degeneration in Alzheimer’s disease. Neuroimage 2010;49:1-8 11. Willinek WA, Kuhl CK. 3.0 T neuroimaging: technical
considerations and clinical applications. Neuroimaging Clin N
Am 2006;16:217-228, ix
12. Sohn CH, Sevick RJ, Frayne R, Chang HW, Kim SP, Kim DK. Fluid attenuated inversion recovery (FLAIR) imaging of the normal brain: comparisons between under the conditions of 3.0 Tesla and 1.5 Tesla. Korean J Radiol 2010;11:19-24 13. Chavhan GB, Babyn PS, Thomas B, Shroff MM, Haacke
EM. Principles, techniques, and applications of T2*-based MR imaging and its special applications. Radiographics 2009;29:1433-1449
14. Allkemper T, Schwindt W, Maintz D, Heindel W, Tombach B. Sensitivity of T2-weighted FSE sequences towards
physiological iron depositions in normal brains at 1.5 and 3.0 T. Eur Radiol 2004;14:1000-1004
15. Aquino D, Bizzi A, Grisoli M, Garavaglia B, Bruzzone MG, Nardocci N, et al. Age-related iron deposition in the basal ganglia: quantitative analysis in healthy subjects. Radiology 2009;252:165-172
16. Siemonsen S, Finsterbusch J, Matschke J, Lorenzen A, Ding XQ, Fiehler J. Age-dependent normal values of T2* and T2’ in brain parenchyma. AJNR Am J Neuroradiol 2008;29:950-955 17. McKhann G, Drachman D, Folstein M, Katzman R, Price D,
Stadlan EM. Clinical diagnosis of Alzheimer’s disease: report of the NINCDS-ADRDA Work Group under the auspices of Department of Health and Human Services Task Force on
Alzheimer’s Disease. Neurology 1984;34:939-944
18. Folstein MF, Folstein SE, McHugh PR. “Mini-mental state”. A practical method for grading the cognitive state of patients for the clinician. J Psychiatr Res 1975;12:189-198
19. Morris JC. The Clinical Dementia Rating (CDR): current version and scoring rules. Neurology 1993;43:2412-2414
20. Péran P, Cherubini A, Luccichenti G, Hagberg G, Démonet JF, Rascol O, et al. Volume and iron content in basal ganglia and thalamus. Hum Brain Mapp 2009;30:2667-2675
21. Allkemper T, Tombach B, Schwindt W, Kugel H, Schilling M, Debus O, et al. Acute and subacute intracerebral hemorrhages: comparison of MR imaging at 1.5 and 3.0 T--initial
experience. Radiology 2004;232:874-881
22. Karaarslan E, Arslan A. Perirolandic cortex of the normal brain: low signal intensity on turbo FLAIR MR images.
Radiology 2003;227:538-541
23. Bakshi R, Benedict RH, Bermel RA, Caruthers SD, Puli SR, Tjoa CW, et al. T2 hypointensity in the deep gray matter of patients with multiple sclerosis: a quantitative magnetic resonance imaging study. Arch Neurol 2002;59:62-68 24. Milton WJ, Atlas SW, Lexa FJ, Mozley PD, Gur RE. Deep gray
matter hypointensity patterns with aging in healthy adults: MR imaging at 1.5 T. Radiology 1991;181:715-719
25. Drayer BP, Olanow W, Burger P, Johnson GA, Herfkens R, Riederer S. Parkinson plus syndrome: diagnosis using high field MR imaging of brain iron. Radiology 1986;159:493-498 26. Bowen BC, Pattany PM, Bradley WG, Murdoch JB, Rotta
F, Younis AA, et al. MR imaging and localized proton spectroscopy of the precentral gyrus in amyotrophic lateral sclerosis. AJNR Am J Neuroradiol 2000;21:647-658
27. Cheung G, Gawel MJ, Cooper PW, Farb RI, Ang LC, Gawal MJ. Amyotrophic lateral sclerosis: correlation of clinical and MR imaging findings. Radiology 1995;194:263-270
28. Harder SL, Hopp KM, Ward H, Neglio H, Gitlin J, Kido D. Mineralization of the deep gray matter with age: a retrospective review with susceptibility-weighted MR imaging.
AJNR Am J Neuroradiol 2008;29:176-183
29. Baleydier C, Mauguiere F. Anatomical evidence for medial pulvinar connections with the posterior cingulate cortex, the retrosplenial area, and the posterior parahippocampal gyrus in monkeys. J Comp Neurol 1985;232:219-228
30. Carrera E, Bogousslavsky J. The thalamus and behavior: effects of anatomically distinct strokes. Neurology 2006;66:1817-1823
31. Yeterian EH, Pandya DN. Corticothalamic connections of the posterior parietal cortex in the rhesus monkey. J Comp Neurol 1985;237:408-426
32. Schmahmann JD, Pandya DN. Anatomical investigation of projections from thalamus to posterior parietal cortex in the rhesus monkey: a WGA-HRP and fluorescent tracer study. J
Comp Neurol 1990;295:299-326
33. Leh SE, Chakravarty MM, Ptito A. The connectivity of the human pulvinar: a diffusion tensor imaging tractography study. Int J Biomed Imaging 2008;2008:789539
binocular response properties of cells in the striate-recipient zone of the cat’s lateral posterior-pulvinar complex. J
Neurophysiol 1989;62:544-557
35. Casanova C, Merabet L, Desautels A, Minville K. Higher-order motion processing in the pulvinar. Prog Brain Res 2001;134:71-82
36. Villeneuve MY, Kupers R, Gjedde A, Ptito M, Casanova C. Pattern-motion selectivity in the human pulvinar. Neuroimage 2005;28:474-480
37. Johnson MD, Ojemann GA. The role of the human thalamus in language and memory: evidence from electrophysiological studies. Brain Cogn 2000;42:218-230
38. Braak H, Braak E. Alzheimer’s disease affects limbic nuclei of the thalamus. Acta Neuropathol 1991;81:261-268
39. Ogren MP, Mateer CA, Wyler AR. Alterations in visually related eye movements following left pulvinar damage in man.
Neuropsychologia 1984;22:187-196
40. Petersen SE, Robinson DL, Keys W. Pulvinar nuclei of the behaving rhesus monkey: visual responses and their modulation. J Neurophysiol 1985;54:867-886
41. Robinson DL, Petersen SE. The pulvinar and visual salience.
Trends Neurosci 1992;15:127-132
42. Bartzokis G. Age-related myelin breakdown: a developmental model of cognitive decline and Alzheimer’s disease. Neurobiol
Aging 2004;25:5-18; author reply 49-62
43. Hallgren B, Sourander P. The effect of age on the non-haemin iron in the human brain. J Neurochem 1958;3:41-51
44. Dobson J. Nanoscale biogenic iron oxides and neurodegenerative disease. FEBS Lett 2001;496:1-5 45. Haacke EM, Cheng NY, House MJ, Liu Q, Neelavalli J, Ogg
RJ, et al. Imaging iron stores in the brain using magnetic resonance imaging. Magn Reson Imaging 2005;23:1-25 46. Ge Y, Jensen JH, Lu H, Helpern JA, Miles L, Inglese M, et al.
Quantitative assessment of iron accumulation in the deep gray matter of multiple sclerosis by magnetic field correlation imaging. AJNR Am J Neuroradiol 2007;28:1639-1644
47. McNeill A, Birchall D, Hayflick SJ, Gregory A, Schenk JF, Zimmerman EA, et al. T2* and FSE MRI distinguishes four subtypes of neurodegeneration with brain iron accumulation.
Neurology 2008;70:1614-1619
48. Zhu WZ, Zhong WD, Wang W, Zhan CJ, Wang CY, Qi JP, et al. Quantitative MR phase-corrected imaging to investigate increased brain iron deposition of patients with Alzheimer disease. Radiology 2009;253:497-504
49. Drayer B, Burger P, Hurwitz B, Dawson D, Cain J. Reduced signal intensity on MR images of thalamus and putamen in multiple sclerosis: increased iron content? AJR Am J
Roentgenol 1987;149:357-363
50. Cross PA, Atlas SW, Grossman RI. MR evaluation of brain iron in children with cerebral infarction. AJNR Am J Neuroradiol 1990;11:341-348
51. Grisoli M, Piperno A, Chiapparini L, Mariani R, Savoiardo M. MR imaging of cerebral cortical involvement in
aceruloplasminemia. AJNR Am J Neuroradiol 2005;26:657-661 52. Brar S, Henderson D, Schenck J, Zimmerman EA. Iron
accumulation in the substantia nigra of patients with Alzheimer disease and parkinsonism. Arch Neurol 2009;66:371-374
53. Braakman N, Matysik J, van Duinen SG, Verbeek F, Schliebs R, de Groot HJ, et al. Longitudinal assessment of Alzheimer’s beta-amyloid plaque development in transgenic mice monitored by in vivo magnetic resonance microimaging. J
Magn Reson Imaging 2006;24:530-536
54. Jack CR Jr, Garwood M, Wengenack TM, Borowski B, Curran GL, Lin J, et al. In vivo visualization of Alzheimer’s amyloid plaques by magnetic resonance imaging in transgenic mice without a contrast agent. Magn Reson Med 2004;52:1263-1271
55. Lee SP, Falangola MF, Nixon RA, Duff K, Helpern JA. Visualization of beta-amyloid plaques in a transgenic mouse model of Alzheimer’s disease using MR microscopy without contrast reagents. Magn Reson Med 2004;52:538-544 56. Vanhoutte G, Dewachter I, Borghgraef P, Van Leuven F, Van
der Linden A. Noninvasive in vivo MRI detection of neuritic plaques associated with iron in APP[V717I] transgenic mice, a model for Alzheimer’s disease. Magn Reson Med 2005;53:607-613
57. Meadowcroft MD, Connor JR, Smith MB, Yang QX. MRI and histological analysis of beta-amyloid plaques in both human Alzheimer’s disease and APP/PS1 transgenic mice. J Magn
Reson Imaging 2009;29:997-1007
58. Yang X, Sammet S, Schmalbrock P, Knopp MV. Postprocessing correction for distortions in T2* decay caused by quadratic cross-slice B0 inhomogeneity. Magn Reson Med 2010;63:1258-1268
59. Schenck JF, Zimmerman EA. High-field magnetic resonance imaging of brain iron: birth of a biomarker? NMR Biomed 2004;17:433-445