102 Copyright © 2015 by Korean Society of Otorhinolaryngology-Head and Neck Surgery.
This is an open-access article distributed under the terms of the Creative Commons Attribution Non-Commercial License (http://creativecommons.org/licenses/by-nc/3.0) which permits unrestricted non-commercial use, distribution, and reproduction in any medium, provided the original work is properly cited.
Original Article
INTRODUCTION
Hearing-impaired (HI) persons with sensorineural hearing loss have several pathological symptoms, such as deteriorated time
and spectral resolutions and abnormally high hearing thresholds, generally in high-frequency ranges [1]. As a result, intelligibility for words that contain consonants with a spectral power that is mainly placed in a high-frequency range (e.g., fricatives) become especially weak, and this requires the help of hearing support (HS) devices, such as digital hearing aids and cochlear implants, to improve the patient’s intelligibility. Most HS devices utilize hearing-compensation algorithms (e.g., wide dynamic range compression [WDRC]) to selectively amplify the sound compo-nents in high-frequency ranges where the hearing thresholds are abnormally high. However, when the values of WDRC gain in high-frequency bands become too high at the severe hearing
• Received January 16, 2014 Revised February 20, 2014 Accepted March 29, 2014
• Corresponding author: In Young Kim
Department of Biomedical Engineering, Hanyang University, 222 Wangsimni-ro, Seongdong-gu, Seoul 133-791, Korea Tel: +82-2-2220-0691, Fax: +82-2-2220-4949 E-mail: [email protected]
*The first two authors contributed equally to this study.
pISSN 1976-8710 eISSN 2005-0720
Effects of the Simultaneous Application of Nonlinear
Frequency Compression and Dichotic Hearing on the
Speech Recognition of Severely Hearing-Impaired
Subjects: Simulation Test
Jong Ho Hwang1,*·Kyoung Won Nam1,*·Sung Hoon Yoon2·Jinryoul Kim1·Sunhyun Yook1·Sung Hwa Hong3 Dong Pyo Jang1·In Young Kim1
1Department of Biomedical Engineering, 2Institute of Biomedical Engineering, Hanyang University, Seoul; 3Department of Otolaryngology-Head and Neck Surgery, Samsung Medical Center, Seoul, Korea
Objectives. The clinical effects of the simultaneous application of nonlinear frequency compression and dichotic hearing on
people with hearing impairments have not been evaluated previously. In this study, the clinical effects of the simulta-neous application of these two techniques on the recognition of consonant-vowel-consonant (CVC) words with frica-tives were evaluated using normal-hearing subjects and a hearing loss simulator operated in the severe hearing loss setting.
Methods. A total of 21 normal-hearing volunteers whose native language was English were recruited for this study, and two
different hearing loss simulators, which were configured for severe hearing loss in the high-frequency range, were uti-lized. The subjects heard 82 English CVC words, and the word recognition score and response time were measured.
Results. The experimental results demonstrated that the simultaneous application of these two techniques showed almost
even performance compared to the sole application of nonlinear frequency compression in a severe hearing loss set-ting.
Conclusion. Though it is generally accepted that dichotic hearing can decrease the spectral masking thresholds of an
hear-ing-impaired person, simultaneous application of the nonlinear frequency compression and dichotic hearing tech-niques did not significantly improve the recognition of words with fricatives compared to the sole application of non-linear frequency compression in a severe hearing loss setting.
loss setting, the clipping phenomenon can be generated in the output signal of the WDRC [2], which deteriorates the speech intelligibility of an HI person. In addition, HI persons who have a dead zone at a specific high-frequency range cannot hear the sound components in the dead zone range at any values of the WDRC gain [3].
In order to improve the speech intelligibility of such severe hearing loss patients, two techniques have been suggested: non-linear frequency compression and dichotic hearing. Nonnon-linear frequency compression aims to supply more sounds in fre-quency regions to HI persons with severe hearing loss in frequency regions by compressing the original sounds in high-frequency regions so that the inaudible sound components move to the lower-frequency range where the degree of hearing im-pairment is relatively low [4,5]. This technique enables HI per-sons with severe hearing impairment in high-frequency regions to hear the high-frequency sounds, unless they cannot hear any-thing. However, this technique can worsen these persons’ ability to discriminate between fricatives (e.g., s, th, and f), whose spec-tral powers are similar to each other and are mainly in relatively high-frequency regions (approximately 3,000–4,000 Hz), be-cause it reduces the separation between frequency components, and therefore, can worsen the intelligibility of words containing fricatives. The second technique, dichotic hearing, aims to im-prove the frequency selectivity of the HI person. The bandwidths of the native auditory filters of HI persons are generally wider than those of normal-hearing (NH) persons (i.e., spectral smear-ing), and therefore, the frequency selectivity of HI persons is rel-atively low. Several previous reports have demonstrated that dichotic hearing could reduce the spectral masking threshold and improve the frequency selectivity of HI persons [6]. Between these two techniques, the former can supply inaudible sounds in high-frequency regions to an HI person, but can also decrease the frequency selectivity of the HI person in high-frequency re-gions; in contrast, the latter can improve the frequency selectivity of the HI person, but cannot supply inaudible sounds in high-fre-quency regions. However, as far as we know, there has been no report that evaluated the clinical effects of the simultaneous ap-plication of these two techniques.
In this study, the clinical effects of the simultaneous applica-tion of the nonlinear frequency compression and dichotic hear-ing techniques on the recognition of words with fricatives were evaluated using 21 NH subjects and two hearing loss simulators operated in the severe hearing loss setting.
MATERIALS AND METHODS
Description of the utilized algorithmsIn this study, three HS algorithms were implemented using MAT-LAB [7]: WDRC, nonlinear frequency compression, and dichotic hearing. For WDRC, the eight-channel side-branch WDRC
algo-rithm suggested by Yasu et al. [8] was utilized. It was implement-ed so that the gain values of each frequency band were automat-ically calculated when the hearing threshold values of the subject were entered. For nonlinear frequency compression, the algo-rithm suggested by Simpson et al. [5] was utilized. In the imple-mented algorithm, the input frequency range was set to 0–8,000 Hz and the cutoff frequency was set to 2,000 Hz. The compres-sion ratio in the region under the cutoff frequency was set to 1:1 (no compression) and the compression ratio in the region over the cutoff frequency was set to 1:3. Areas over the 4,000 Hz af-ter compression were zero-padding processed (1,024- point Fast Fourier Transform with 50% overlap). For dichotic hearing, the nonlinear, comb filter-based dichotic hearing algorithm suggested by Cheeran et al. [9] was utilized. During implementation, the frequency range 1–5,000 Hz was divided into 18 frequency bands and gamma-tone filters with shapes similar to the real au-ditory filter, which were applied to each frequency band, as in Eq. 1:
g(t)=atn–1e–2πbtcos (2πft+ϕ) Eq. 1
where f represents the center frequency of the frequency band (Hz), ϕ represents the phase of the carrier (radians), constants a and b represent amplitude and bandwidth of the gamma-tone filter, respectively, n represents the order of the gamma-tone fil-ter, and t represents the time (second). In this study, gamma-tone filters were generated using a MATLAB code suggested by Staney [10], and among the suggested four types of gamma-tone filters, the ‘Moore’ methodology was selected to generate the 18 gamma-tone filters that covered the 1–5,000 Hz region (the cen-ter frequencies of each frequency band were 75, 130, 195, 273, 364, 472, 600, 751, 930, 1,141, 1,391, 1,686, 2,035, 2,448, 2,935, 3,512, 4,194, and 5,000 Hz). Then, among the imple-mented 18 gamma-tone filters, the output signals of the nine odd filters (1st, 3rd, 5th, …, 17th) were added together and this summed signal was heard by the left ear; furthermore, the out-put signals of the nine even filters (2nd, 4th, 6th, …, 18th) were added together and this summed signal was heard by the right ear at the same time.
Settings for hearing loss simulators
In this study, two hearing loss simulators were utilized to simu-late an HI person with severe hearing loss in the high-frequency region: a hearing loss simulator with threshold-adjustment abili-ty (Hearing Loss and Prosthesis Simulator; Sensimetrics Co., Malden, MA, USA; denoted by HLS-1) [11,12] and a hearing loss simulator with both the threshold- and smearing-adjustment abilities (Cochclear Implant and Hearing Loss Simulator ver. 1.08.01; TigerSpeech Technology, Shanghai, China; denoted by HLS-2) [13,14]. For both HLS-1 and HLS-2, the hearing thresh-olds of each frequency band were set to 20, 20, 25, 35, 50, 85, and 90 dB hearing level for frequency bands 1, 2, …, and 7,
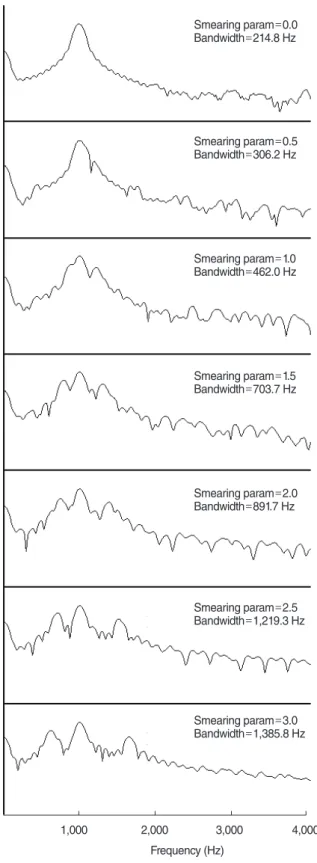
re-spectively (the center frequencies of each frequency band were 125, 250, 500, 1,000, 2,000, 4,000, and 8,000 Hz, respectively), based on the audiogram data of an HI person with severe hear-ing loss in the high-frequency region (Fig. 1) [15]. In addition, for HLS-2, the degree of spectral smearing was determined on the basis of a previous article by Glasberg et al. [16], which demon-strated that the bandwidth of the auditory filters of persons with severe hearing loss is approximately six times wider than that of an NH person. Based on the measurements of Glasberg et al. [16], the value of the HLS-2 smearing parameter was adjusted in order to examine the relationship between the value of the smearing parameter and the bandwidth of the HLS-2 output signal. That is, first, the smearing parameter value was set to zero (simulating the NH condition) and the bandwidth of the HLS-2 output signal when a 1-kHz pure-tone sine wave was entered into the HLS-2 was measured. Then, the same measurements were repeated with increasing smearing parameter values from 0.5 to 3.0 at 0.5 intervals (simulating HI conditions). Each out-put signal of HLS-2 was normalized and the difference between two frequency values with a normalized amplitude of 0.707 was regarded as the auditory filter bandwidth of HLS-2 (Fig. 2). In these measurements, the auditory filter bandwidth of the HLS-2 output signal at smearing parameter 2.5 was approximately six times wider than that when the smearing parameter was 0. On the basis of these measurements, the smearing parameter of HLS-2 was set to 2.5 during experiments.
Utilized sound sources and tested algorithm combinations
Sound files contained in the free-download software for the inter-active listening rehabilitation and functional hearing test (Sound Express Auditory Training [SEAT]; TigerSpeech Technology) [17] were utilized in this study (16-bit quantization and 22-kHz sam-pling frequency). Among the thousands of sound files in the SEAT program, 216 consonant-vowel-consonant (CVC) English words that were utilized in the CVC word recognition test of House et al. [18] were initially extracted, and 82 CVC words
0 10 20 30 40 50 60 70 80 90 100 125 250 500 1,000 2,000 4,000 8,000 Frequency (Hz) Hear ing le vel (dB)
Fig. 1. Hearing threshold setting for both the HLS-1 and HLS-2 that simulates severe hearing loss in the high-frequency region. HLS, hearing loss simulator.
Fig. 2. Measurements of the HLS-2 bandwidth when a 1-kHz pure-tone sine wave was entered into HLS-2 and the values of the smear-ing parameter were adjusted from 0.0 to 3.0 at 0.5 intervals. HLS, hearing loss simulator.
1,000 2,000 3,000 4,000 Frequency (Hz) Smearing param=0.0 Bandwidth=214.8 Hz Smearing param=0.5 Bandwidth=306.2 Hz Smearing param=1.0 Bandwidth=462.0 Hz Smearing param=1.5 Bandwidth=703.7 Hz Smearing param=2.0 Bandwidth=891.7 Hz Smearing param=2.5 Bandwidth=1,219.3 Hz Smearing param=3.0 Bandwidth=1,385.8 Hz
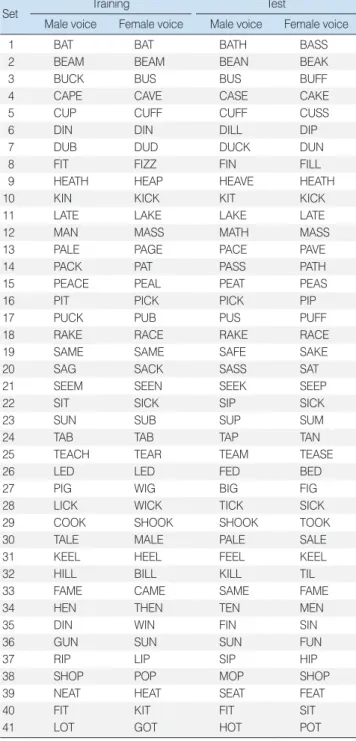
from the extracted 216 words were then randomly selected, as shown in Table 1. Each of the sound files of the 82 CVC words that were ultimately selected were down-sampled to 16-bit quan-tization and 16-kHz sampling frequency conditions considering the hardware specification of the conventional HS devices. These down-sampled sound files were utilized for the clinical tests. During the clinical tests, two different combinations of the test-ing algorithms were evaluated. First, the original sound was en-tered into the nonlinear frequency compression algorithm, the
output of the nonlinear frequency compression algorithm was entered into the WDRC algorithm, the output of the WDRC al-gorithm was entered into the HLS, and the output of the HLS was heard by the NH subject (same sounds in both ears; nonlin-ear compression only; denoted by testing algorithm combination 1 [TAC1]) (Fig. 3A). Second, the original sound was entered into the nonlinear frequency compression algorithm and the output of the nonlinear frequency compression algorithm was entered into the two different comb filters (odd-band filter and even-band filter). The output of the odd-band comb filter was processed us-ing the WDRC algorithm and HLS, and the output of the HLS was heard by the left ear of the subject; the output of the even-band comb filter was processed using the WDRC algorithm and HLS, and the output of the HLS was heard by the right ear of the subject simultaneously (different sound in each ear; both nonlin-ear compression and dichotic; denoted by TAC2) (Fig. 3B). For effective clinical tests, each of the selected 82 CVC words were pre-processed using each of the TAC1 and TAC2 combina-tions, and 328 sound files (164 files for HLS-1 and 164 files for HLS-2) were generated by recording the outputs of the simula-tors for each case. These were utilized during the experiments.
Participants
A total of 21 NH volunteers whose native language was English participated in this study. The recruited volunteers’ audiogram values were measured using the pure-tone audiometry testing protocol using an audiometer (Digital audiometer; Digital Re-cordings, Halifax, NS, Canada) and a headset (AKG K-271 Mk2; AKG, Vienna, Austria). Among those whose values were under 25 dB HL at all testing frequency bands [19,20], 11 applicants (6 males and 5 females; mean age, 26.0 years; range, 22 to 43 years)
Comp. WDRC HLS Comp. Comb-R WDRC HLS Comb-L WDRC HLS A B
Fig. 3. Schematics of the combinations of testing algorithms: (A) TAC1. (B) TAC2. Comp., frequency compression; Comb-L, odd-band comb filter; Comb-R, even-odd-band comb filter; WDRC, wide dy-namic range compression; HLS, hearing loss simulator; TAC, testing algorithm combination.
Table 1. The 82 consonant-vowel-consonant English words selected for word recognition testing
Set Training Test
Male voice Female voice Male voice Female voice
1 BAT BAT BATH BASS
2 BEAM BEAM BEAN BEAK
3 BUCK BUS BUS BUFF
4 CAPE CAVE CASE CAKE
5 CUP CUFF CUFF CUSS
6 DIN DIN DILL DIP
7 DUB DUD DUCK DUN
8 FIT FIZZ FIN FILL
9 HEATH HEAP HEAVE HEATH
10 KIN KICK KIT KICK
11 LATE LAKE LAKE LATE
12 MAN MASS MATH MASS
13 PALE PAGE PACE PAVE
14 PACK PAT PASS PATH
15 PEACE PEAL PEAT PEAS
16 PIT PICK PICK PIP
17 PUCK PUB PUS PUFF
18 RAKE RACE RAKE RACE
19 SAME SAME SAFE SAKE
20 SAG SACK SASS SAT
21 SEEM SEEN SEEK SEEP
22 SIT SICK SIP SICK
23 SUN SUB SUP SUM
24 TAB TAB TAP TAN
25 TEACH TEAR TEAM TEASE
26 LED LED FED BED
27 PIG WIG BIG FIG
28 LICK WICK TICK SICK
29 COOK SHOOK SHOOK TOOK
30 TALE MALE PALE SALE
31 KEEL HEEL FEEL KEEL
32 HILL BILL KILL TIL
33 FAME CAME SAME FAME
34 HEN THEN TEN MEN
35 DIN WIN FIN SIN
36 GUN SUN SUN FUN
37 RIP LIP SIP HIP
38 SHOP POP MOP SHOP
39 NEAT HEAT SEAT FEAT
40 FIT KIT FIT SIT
participated in tests using HLS-1 and 10 applicants (4 males and 6 females; mean age, 24.8 years; range, 19 to 34 years) participat-ed in tests using HLS-2. Detailparticipat-ed experimental protocols were approved by the local Institutional Review Board (IRB) of Han-yang University (HYU IRB HYI-12-048 for HLS-1 and HYU IRB HYI-13-120 for HLS-2). The content of the experiments was ex-plained to each subject and written agreements were acquired before beginning the experiments, and each participant was paid a reward (approximately 30 United States dollars).
Experimental protocol
Clinical tests were performed in a sound-proof room (left×right× height: 300 cm×300 cm×200 cm) at Hanyang University. When each subject entered the testing room, the experimental proce-dures were explained and re-explained to each subject before be-ginning the experiments until the subject fully understood the content of the experiments. Then, the subject was asked to wear a headset (THD 39, GN Otometrics A/S, Taastrup, Denmark) with the volume preadjusted to 65 dB SPL (sound press level), and the experiment began. During both tests for HLS-1 and HLS-2, initial training was performed so that the subject became familiar with the content and procedures of the experiment. When the training began, one of the 82 CVC words contained in the second and third columns in Table 1 (no processed) was played and the sub-ject was asked to select the word they heard among the six words displayed on the monitor in front of them. The same procedure was repeated 82 times (with all 82 words), and then the subject
took a rest for three minutes before beginning the actual test. When the actual test began, 164 sound files representing the 82 CVC words in the fourth and fifth columns of Table 1 and two testing algorithm combinations (TAC1 and TAC2) were played one-by-one for either HLS-1 or HLS-2, and the subject was asked to select the word they heard among the six words dis-played on the monitor. To reduce the training effect during suc-cessive experiments, words processed by TAC1 and TAC2 were randomly played and the gender of the voice (male or female) saying the words was also randomly selected. In addition, to re-duce the listening fatigue of the subject, the subject took a rest for 30 seconds after 42 words had been tested.
After overall measurements, statistical analysis was performed only using the 34 words containing the fricatives s, f, and th ei-ther at the front or rear position among the 82 words. The calcu-lations were performed using commercial software [21], and the nonparametric Mann-Whitney test was applied to the compari-son between the two groups because the number of participating subjects was insufficient for a conventional t-test.
RESULTS
Clinical measurements when HLS-1 was utilized
Table 2 shows the correction ratio (%) of the target CVC words when HLS-1 was utilized. There was a statistically significant dif-ference between (female voice, TAC1) and (female voice, TAC2)
Table 2. Measurements of the correction ratios (%) when HLS-1 was utilized
Voice ~th ~s ~f s~ f~ front-f rear-f fri-s fri-f
Male voice TAC1 31.82±33.71 98.19±6.03 54.55±26.97 97.73±7.54 45.45±33.20 71.59±17.76 73.74±12.45 97.98±4.49 48.48±26.30 TAC2 22.73±34.38 94.55±9.34 45.45±26.97 84.90±30.15 52.27±32.51 72.73±15.63 67.68±15.28 89.90±13.57 50.00±24.72 Female voice TAC1 68.19±33.71 90.91±10.44 54.55±15.08 95.45±10.11 43.18±16.17 69.32±11.68 78.79±10.49 92.93±7.49 46.97±12.51 TAC2 77.28±26.11 76.36±17.48 50.00±22.36 95.45±10.11 54.55±24.54 75.00±11.18 72.73±10.38 84.85±10.27 53.03±20.84 Values are presented as mean±standard deviation.
HLS, hearing loss simulator; ~th, words that end in th; ~s, words that end in s; ~f, words that end in f; s~, words that begin with s; f~, words that begin with f; front-f, words that begin with fricatives; rear-f, words that end in fricatives; fri-s, words with fricative s; fri-f, words with fricative-f; TAC, testing algorithm combination.
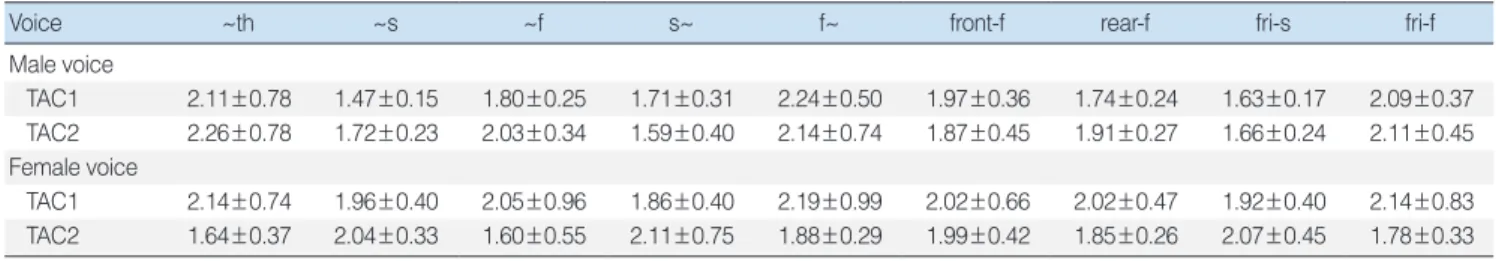
Table 3. Measurements of the response time (second) when HLS-1 was utilized
Voice ~th ~s ~f s~ f~ front-f rear-f fri-s fri-f
Male voice TAC1 2.11±0.78 1.47±0.15 1.80±0.25 1.71±0.31 2.24±0.50 1.97±0.36 1.74±0.24 1.63±0.17 2.09±0.37 TAC2 2.26±0.78 1.72±0.23 2.03±0.34 1.59±0.40 2.14±0.74 1.87±0.45 1.91±0.27 1.66±0.24 2.11±0.45 Female voice TAC1 2.14±0.74 1.96±0.40 2.05±0.96 1.86±0.40 2.19±0.99 2.02±0.66 2.02±0.47 1.92±0.40 2.14±0.83 TAC2 1.64±0.37 2.04±0.33 1.60±0.55 2.11±0.75 1.88±0.29 1.99±0.42 1.85±0.26 2.07±0.45 1.78±0.33 Values are presented as mean±standard deviation.
HLS, hearing loss simulator; ~th, words that end in th; ~s, words that end in s; ~f, words that end in f; s~, words that begin with s; f~, words that begin with f; front-f, words that begin with fricatives; rear-f, words that end in fricatives; fri-s, words with fricative s; fri-f, words with fricative-f; TAC, testing algorithm combination.
(P<0.05); however, in other situations, there were no significant differences between TAC1 and TAC2 (P>0.05). In the fricative-position analysis (comparing the words that begin with fricatives [s~ and f~; front-f] and the words that end in fricatives [~s, ~f, and ~th; rear-f]), there were no significant differences between TAC1 and TAC2 for all situations in the Mann-Whitney test (P>0.05). In the fricative-type analysis (comparing the words whose fricative is s [s~ and ~s], f [f~ and ~f], and th [~th]), there were no significant differences between TAC1 and TAC2 for all situations in the Mann-Whitney test (P>0.05). Table 3 shows the response time (second) of the subjects when HLS-1 was utilized. The response time was measured as the time interval between
the end of the sound file and the clicking time of the mouse to select a word on the monitor. In the fricative-position analysis, there were no significant differences between TAC1 and TAC2 for all situations (P>0.05). In the fricative-type analysis, there were no significant differences between TAC1 and TAC2 for all situations (P>0.05).
Clinical measurements when the HLS-2 was utilized
Table 4 shows the correction ratio when HLS-2 was utilized. In the fricative-position analysis, there were no significant differ-ences between TAC1 and TAC2 for all situations (P>0.05). In the fricative-type analysis, there were no significant differences
Table 4. Measurements of the correction ratios (%) when HLS-2 was utilized
Voice ~th ~s ~f s~ f~ front-f rear-f fri-s fri-f
Male voice TAC1 30.00±34.96 80.00±18.86 90.00±21.08 85.00±21.08 60.00±24.15 72.50±21.08 71.11±15.89 82.22±18.29 70.00±20.49 TAC2 40.00±21.08 78.00±28.98 75.00±26.35 85.00±12.91 42.50±26.48 63.75±16.08 68.89±19.46 81.11±17.41 53.33±23.31 Female voice TAC1 65.00±33.75 86.00±21.19 55.00±15.81 82.50±16.87 62.50±21.25 72.50±14.19 74.44±14.86 84.44±15.00 60.00±17.92 TAC2 65.00±33.75 70.00±31.62 55.00±36.89 85.00±17.48 62.50±21.25 73.75±16.08 65.56±20.59 76.67±23.69 60.00±16.10 Values are presented as mean±standard deviation.
HLS, hearing loss simulator; ~th, words that end in th; ~s, words that end in s; ~f, words that end in f; s~, words that begin with s; f~, words that begin with f; front-f, words that begin with fricatives; rear-f, words that end in fricatives; fri-s, words with fricative s; fri-f, words with fricative-f; TAC, testing algorithm combination.
Table 5. Measurements of the response times (second) when HLS-2 was utilized
Voice ~th ~s ~f s~ f~ front-f rear-f fri-s fri-f
Male voice TAC1 2.50±1.04 1.97±0.45 2.13±0.78 2.18±0.84 2.11±0.68 2.14±0.87 2.12±0.56 2.06±0.71 2.11±0.64 TAC2 2.15±0.45 2.12±0.63 2.21±0.56 2.28±1.14 2.23±0.63 2.26±0.83 2.15±0.50 2.19±0.81 2.22±0.56 Female voice TAC1 3.06±1.92 2.24±0.58 2.36±1.09 2.22±0.69 2.02±0.68 2.12±0.58 2.45±0.71 2.23±0.44 2.13±0.69 TAC2 2.51±0.80 2.39±0.83 2.26±1.19 2.17±0.40 2.13±0.65 2.15±0.45 2.39±0.79 2.29±0.61 2.17±0.76 Values are presented as mean±standard deviation.
HLS, hearing loss simulator; ~th, words that end in th; ~s, words that end in s; ~f, words that end in f; s~, words that begin with s; f~, words that begin with f; front-f, words that begin with fricatives; rear-f, words that end in fricatives; fri-s, words with fricative s; fri-f, words with fricative-f; TAC, testing algorithm combination.
Table 6. Comparison of correction ratios between HLS-1 and HLS-2
Voice ~th ~s ~f s~ f~ front-f rear-f fri-s fri-f
Mail voice TAC1 0.91 0.01 0.01 0.10 0.31 0.86 0.97 0.00 0.06 TAC2 0.12 0.18 0.03 0.36 0.51 0.23 0.69 0.19 0.80 Female voice TAC1 0.85 0.90 1.00 0.05 0.04 0.50 0.77 0.19 0.08 TAC2 0.43 0.88 0.70 0.12 0.44 0.91 0.32 0.61 0.31 Total TAC1 1.00 0.08 0.02 0.03 0.07 0.43 0.94 0.03 0.03 TAC2 0.71 0.76 0.04 0.22 0.91 0.37 0.83 0.52 0.57
P-values in the Mann-Whitney test.
HLS, hearing loss simulator; ~th, words that end in th; ~s, words that end in s; ~f, words that end in f; s~, words that begin with s; f~, words that begin with f; front-f, words that begin with fricatives; rear-f, words that end in fricatives; fri-s, words with fricative s; fri-f, words with fricative-f; TAC, testing algorithm combination.
Table 7. Comparison of response times between HLS-1 and HLS-2
Voice ~th ~s ~f s~ f~ front-f rear-f fri-s fri-f
Mail voice TAC1 0.34 0.04 0.22 0.34 0.46 0.97 0.04 0.02 0.60 TAC2 0.97 0.31 0.46 0.03 0.50 0.28 0.34 0.02 0.38 Female voice TAC1 0.15 0.19 0.46 0.29 0.46 0.50 0.13 0.08 0.97 TAC2 0.00 0.42 0.08 0.40 0.86 0.38 0.04 0.38 0.22 Total TAC1 0.08 0.02 0.23 0.22 0.30 0.63 0.02 0.01 0.68 TAC2 0.03 0.06 0.10 0.03 0.41 0.10 0.03 0.03 0.19
P-values in the Mann-Whitney test.
HLS, hearing loss simulator; ~th, words that end in th; ~s, words that end in s; ~f, words that end in f; s~, words that begin with s; f~, words that begin with f; front-f, words that begin with fricatives; rear-f, words that end in fricatives; fri-s, words with fricative s; fri-f, words with fricative-f; TAC, testing algorithm combination.
between TAC1 and TAC2 for all situations (P>0.05). Table 5 shows the response times of the subjects when HLS-2 was utilized. In the fricative-position analysis, there were no significant differences be-tween TAC1 and TAC2 for all situations (P>0.05). In the fricative-type analysis, there were no significant differences between TAC1 and TAC2 for all situations (P>0.05).
Comparison between the measurements of HLS-1 and HLS-2
Table 6 represents the comparison of correction ratios between HLS-1 and HLS-2. There were significant differences between the results of HLS-1 and HLS-2 for (~s, male voice, TAC1), (~f, male voice, TAC1), (~f, male voice, TAC2), (~f, total, TAC1), (~f, total, TAC2), (s~, total, TAC1), (f~, female voice, TAC1), (fri-s, male voice, TAC1), (fri-s, total, TAC1), and (fri-f, total, TAC1) (P>0.05). Table 7 represents the comparison of response times between HLS-1 and HLS-2. There were significant differences between the results of HLS-1 and HLS-2 for (~th, female voice, TAC2), (~th, total, TAC2), (~s, male voice, TAC1), (~s, total, TAC1), (s~, male voice, TAC2), (s~, total, TAC2), (rear-f, male voice, TAC1), (rear-f, female voice, TAC2), (rear-f, total, TAC1), (rear-f, total, TAC2), (fri-s, male voice, TAC1), (fri-s, male voice, TAC2), (fri-s, total, TAC1), and (fri-s, total, TAC2) (P>0.05).
DISCUSSION
The purpose of this study is not to show whether dichotic hear-ing can improve speech intelligibility of the HI person or not be-cause the clinical benefits of dichotic hearing on speech intelligi-bility are currently on debate as mentioned above. Rather, the purpose of this study is to see whether the simultaneous applica-tion of the nonlinear frequency compression and dichotic hear-ing—which are expected to provide a synergetic effect consider-ing the concept of the individual techniques—would induce a synergetic effect and improve speech intelligibility compared to the sole application of the nonlinear frequency compression. In this study, the clinical tests were not performed with actual
HI patients with severe hearing loss in high-frequency ranges, but with NH subjects and an HLS that had parameters configured for severe hearing loss in high-frequency ranges. There have been several previous reports that utilized a device that simulates vari-ous hearing-impairment conditions for clinical tests. For example, Loebach and Pisoni [22] performed a clinical test using 155 NH subjects and a cochlear implant simulator (eight-channel sin-ewave vocoder) to evaluate the clinical efficacy of training. Kagomiya and Nakagawa [23] evaluated the performance of hearing assistance devices using nine NH Japanese subjects and a cochlear implant simulator. Nejime and Moore [24] investigat-ed the effect of digital processing, which slows the speinvestigat-ed of speech without changing its pitch, using young, NH, native Eng-lish speakers and a cochlear hearing loss simulator. The benefits of using a hearing loss simulator are remarkable because accu-rate HI subject recruitment for a specific study is extremely diffi-cult, for example, when the testing stimuli are composed of a language foreign to the subject.
In this study, two types of simulator (HLS-1 or HLS-2) were utilized. Among the two utilized simulators, HLS-2 is more real-istic because the deterioration of the frequency selectivity and abnormal hearing thresholds occur simultaneously in almost all sensorineural HI persons. In a clinical viewpoint, HLS-1 does not reflect the actual hearing impairment cases. However, there have been several studies that utilized a simulator that can only adjust the hearing threshold [11,22,23] and therefore, in this study, we performed the clinical test using both simulators. In fact, before comparing the TAC-1 and TAC-2, as a prelimi-nary test to see the effect of the nonlinear frequency compres-sion in the utilized experimental setting, we performed addition-al comparison test using two addition-algorithm combinations for each of HLS-1 and HLS-2: (1) original sound→WDRC→HLS →NH subject (TAC0) and (2) original sound→nonlinear frequency compression→WDRC→HLS→NH subject (TAC1). In this com-parison study, the average correction scores (for all types and po-sitions of the fricatives and all voice genders) of the TAC0 and TAC1 were 19.7 and 24.3 (among 34 testing words) for HLS-1
and 27.0 and 24.7 for HLS-2. Since the non-linear frequency compression can worsen the spectral selectivity in high-frequen-cy regions while it can make the high-frequenhigh-frequen-cy sounds audible, it may improve the recognition of fricatives in HLS-1 because the HLS-1 maintains the high spectral selectivity of the NH lis-teners; in contrast, in case of the HLS-2, both of the nonlinear frequency compression and the HLS-2 (which also simulates spectral smearing effect) worsen the spectral selectivity simulta-neously and as a result, the recognition of fricatives would be worse. Taking these points into consideration, it can be concluded that both of the utilized simulators worked properly.
Experimental results of this simulation study demonstrated that the sole application of either HLS-1 or HLS-2 cannot induce the synergetic effect of improving the speech intelligibility of HI persons compared to the application of the nonlinear frequency compression technique only. There may be several possible rea-sons for these results: first, the utilized simulators cannot emulate the characteristics of real HI patients sufficiently since there are several other characteristic phenomena of HI persons, such as loudness recruitment, that the utilized simulators do not reflect; and secondly, the numbers of subjects and tested words are not sufficient for reliable statistical investigation. In addition, the ef-fect of dichotic hearing on speech intelligibility improvement is still debatable, though it is generally regarded that dichotic hear-ing can decrease the spectral maskhear-ing thresholds of an HI person. For example, Chaudhari and Pandey [25] reported that when they performed speech perception tests for vowel-consonant-vowel (VCV) and consonant-vowel-consonant-vowel (CV) words using 10 HI sub-jects and 18 filter banks, which were divided into odd bands and even bands, employing dichotic hearing improved the recogni-tion score and reduced the response time for both VCV and CV words. In contrast, Murase et al. [26] reported that when they played a recording of VCV and CV syllables for four HI subjects in four different ways (diotic, diotic with amplitude –6 dB, dichotic with cross-over frequency 0.8 kHz, and dichotic with cross-over frequency 1.6 kHz) the rank of speech recognition score was dich-otic (0.8 kHz)>didich-otic>didich-otic (–6 dB)>dichdich-otic (1.6 kHz). Mani et al. [27] reported that when they played a recording of 30 sentenc-es for eight bilateral nucleus-24 implant users in three different ways (diotic, low-high dichotic, and odd-even dichotic) the rank of speech recognition score was diotic>odd-even dichotic>low-high dichotic. Furthermore, Kolte and Chaudhari [28] reported that when they played a recording of VCV words processed by an 18-band dichotic comb filter to seven HI subjects, the speech percep-tion score increased for four subjects but decreased for three sub-jects. In addition, the response time decreased for five subjects but increased for two subjects. As shown in these previous reports, dichotic hearing improved speech recognition in some studies, but other studies that showed that dichotic hearing did not improve speech recognition.
When evaluating the clinical effects of a specific speech en-hancement algorithm using NH subjects and a simulator that
emulates various hearing loss conditions, the performance and characteristics of the utilized simulator can seriously affect the experimental results. For example, in this study, we selected two HLSs with different characteristics that were commonly utilized in other studies: HLS-1 reflected hearing threshold variations only and HLS-2 reflected both hearing threshold variations and the spectral smearing effect simultaneously. Although there were no statistically significant differences between the experimental results of TAC1 and TAC2 in most testing conditions when either HLS-1 (3.1) or HLS-2 (3.2) was applied, there were significant differences between the results of HLS-1 and HLS-2 at several testing conditions (3.3), which may have been due to the differ-ence between the two utilized simulators. These experimental re-sults may be explained as follows. There are several factors that affect the speech intelligibility of the listener such as temporal and spectral selectivity, temporal and spectral masking, level of hearing thresholds, binaural summation, loudness recruitment, right ear advantage, and so on. However, the specific role of each of those factors is not clear; (1) one factor can affect the recogni-tion of a specific sound independently, (2) two or more factors can affect the recognition of a specific sound complexly, and (3) one factor can affect the recognition of sounds more dominantly than other factors. Considering the experimental results of this study, it may be postulated that the effect of the deteriorated hearing thresholds may be the most dominant factor for speech recognition of HI person, and that the spectral selectivity of the ear may also affect the recognition of the fricative s and f critical-ly. Though the evidence is not sufficient for any solid conclusions and more specified and well-designed investigations should be conducted, the result of this study can be a starting point for such further clinical investigations.
In future studies, the reliability of the results of the current study can be improved by (1) recruiting more subjects and testing words, and (2) utilizing a more updated simulator for hearing loss simula-tion that can reflect various acoustic characteristics of actual HI persons, e.g., loudness recruitment and right ear advantage. In conclusion, simultaneous application of the nonlinear fre-quency compression and dichotic hearing techniques did not sig-nificantly improve the recognition of words with fricatives com-pared to the sole application of nonlinear frequency compression in a severe hearing loss setting. Although it is generally accepted that dichotic hearing can decrease the spectral masking thresh-olds of an HI person, further verification of its clinical benefit on speech intelligibility is required.
CONFLICT OF INTEREST
No potential conflict of interest relevant to this article was re-ported.
ACKNOWLEDGMENTS
This work was supported by grants from the Seoul R&BD Pro-gram, KOREA (No. SS100022) and was also supported by the Basic Science Research Program through the National Research Foundation of Korea (NRF), funded by the Ministry of Educa-tion, Science, and Technology (No. 2012R1A1A2041508).
REFERENCES
1. Carney AE, Nelson DA. An analysis of psychophysical tuning curves in normal and pathological ears. J Acoust Soc Am. 1983 Jan;73(1): 268-78.
2. Harvey D. Compression systems in hearing aids. In: Dillon H, editor. Hearing aids. 2nd ed. New York: Thieme; 2012. p. 171-2.
3. Taylor B. Constructing a hearing aid fitting using the latest clinical evidence [Internet]. Houston (TX): AudiologyOnline; 2012 [cited 2015 Apr 25]. Available from: http://www.audiologyonline.com/arti-cles/constructing-hearing-aid-fitting-using-6584.
4. Harvey D. Frequency lowering. In: Dillon H, editor. Hearing aids. 2nd ed. New York: Thieme; 2012. p. 239-40.
5. Simpson A, Hersbach AA, McDermott HJ. Improvements in speech perception with an experimental nonlinear frequency compression hearing device. Int J Audiol. 2005 May;44(5):281-92.
6. Kulkarni PN, Pandey PC, Jangamashetti DS. Binaural dichotic pre-sentation to reduce the effects of spectral masking in moderate bilat-eral sensorineural hearing loss. Int J Audiol. 2012 Apr;51(4):334-44. 7. MATLAB mathematics. R2010b. Natick (MA): The MathWorks Inc.;
2010.
8. Yasu K, Hishitani M, Arai T, Murahara Y. Critical-band based frequen-cy compression for digital hearing aids. Acoust Sci Tech. 2004 May; 25(1):61-3.
9. Cheeran AN, Pandey PC, Jangamashetti DS. Design of comb filters based on auditory filter bandwidths for binaural dichotic presenta-tion for persons with sensorineural hearing impairment. In: 2002 14th Intemational Conference on Digital Signal Processing Proceed-ings DSP 2002; 2002 Jul 1-3; Santorini, Hellas. Piscataway (NJ): The Institute of Electrical and Electronics Engineers; 2002. p. 971-4. 10. Staney M. An efficient implementation of the Patterson-Holdsworth
auditory filter bank. Cupertino (CA): Apple Computer Inc.; 1993. 11. Desloge JG, Zurek PM, Ghitza O, Wiegand TE, Goldsworthy R, Cheyne
H. HeLPS (Hearing Loss and Prosthesis Simulator) [CD-ROM]. Ver-sion 1.0. Malden: Senseimetrics; 2006.
12. Zurek PM, Desloge JG. Hearing loss and prosthesis simulation in au-diology. Hear J. 2007 July;60(7):32,33,36,38.
13. AngelSim (TigerCIS). Cochclear implant and hearing loss simulator [Internet]. Version 1.08.01. Shanghai: TigerSpeech Technology; 2012 [cited 2015 Apr 25]. Available from: http://www.tigerspeech.com/ tst_tigercis.html.
14. Chatterjee M, Peredo F, Nelson D, Baskent D. Recognition of inter-rupted sentences under conditions of spectral degradation. J Acoust Soc Am. 2010 Feb;127(2):EL37-41.
15. Kuk F, Keenan D, Peeters H, Korhonen P, Auriemmo J. 12 Lessons learned about linear frequency transposition. Hear Rev. 2008 Nov; 15(12):32-41.
16. Glasberg BR, Moore BC. Auditory filter shapes in subjects with uni-lateral and biuni-lateral cochlear impairments. J Acoust Soc Am. 1986 Apr;79(4):1020-33.
17. Sound express auditory training (SEAT): a new way to learn sound and music [Internet]. Version 5.04.01. Shanghai: TigerSpeech Tech-nology; 2012 [cited 2015 Apr 25]. Available from: http://www.tiger-speech.com/tst_soundex.html.
18. House AS, Williams CE, Heker MH, Kryter KD. Articulation-testing methods: consonantal differentiation with a closed-response set. J Acoust Soc Am. 1965 Jan;37:158-66.
19. Yellin MW, Roland PS. Special auditory/vestibular testing. In: Roland PS, Marple BF, Meyerhoff WL, editors. Hearing loss. New York: Thieme Medical Publisher Inc.; 1997. p. 71-106.
20. Joe WK. Audiology pure-tone testing [Internet]. New York: Medscape; c2013 [cited 2015 Mar 10]. Available from: http://emedicine.med-scape.com/article/1822962-overview#a01.
21. GraphPad Prism [Internet]. Version 5.01. La Jolla (CA): GraphPad Software Inc; 2007 [cited 2015 Apr 25]. Available from: http://www. graphpad.com/scientific-software/prism/.
22. Loebach JL, Pisoni DB. Perceptual learning of spectrally degraded speech and environmental sounds. J Acoust Soc Am. 2008 Feb; 123(2):1126-39.
23. Kagomiya T, Nakagawa S. Development of a Japanese speaker dis-crimination test for evaluation of hearing assistance devices. In: Pro-ceedings of the 17th International Congress of Phonetic Sciences (ICPhS XVII); 2011 Aug 17-21; Hong Kong, China. Hong Kong: City University of Hong Kong; 2011. p. 998-1001.
24. Nejime Y, Moore BC. Evaluation of the effect of speech-rate slowing on speech intelligibility in noise using a simulation of cochlear hear-ing loss. J Acoust Soc Am. 1998 Jan;103(1):572-6.
25. Chaudhari DS, Pandey PC. Dichotic presentation of speech signal us-ing critical filter bank for bilateral sensorineural hearus-ing impairment. In: Proceedings of the 16th International Congresses on Acoustics; 1998 Jun 20-26; Seattle, USA. International Congresses on Acous-tics; 1998. p. 213-4.
26. Murase A, Nakajima F, Sakamoto S, Suzuki V, Kawase T. Effect and sound localization with dichotic-listening digital hearing aids. In: The 18th International Congress on Acoustics ICA 2004; 2004 Apr 4-9; Kyoto, Japan. International Congresses on Acoustics; 2004. p. II-1519-II-1522.
27. Mani A, Loizou PC, Shoup A, Roland P, Kruger P. Dichotic speech recognition by bilateral cochlear implant users. Int Congr Ser. 2004 Nov;1273:466-9.
28. Kolte MT, Chaudhari DS. Evaluation of speech processing schemes to improve perception of sensorineural hearing impaired. Curr Sci. 2010 Mar;98(5):613-5.