저작자표시-비영리-변경금지 2.0 대한민국 이용자는 아래의 조건을 따르는 경우에 한하여 자유롭게 l 이 저작물을 복제, 배포, 전송, 전시, 공연 및 방송할 수 있습니다. 다음과 같은 조건을 따라야 합니다: l 귀하는, 이 저작물의 재이용이나 배포의 경우, 이 저작물에 적용된 이용허락조건 을 명확하게 나타내어야 합니다. l 저작권자로부터 별도의 허가를 받으면 이러한 조건들은 적용되지 않습니다. 저작권법에 따른 이용자의 권리는 위의 내용에 의하여 영향을 받지 않습니다. 이것은 이용허락규약(Legal Code)을 이해하기 쉽게 요약한 것입니다. Disclaimer 저작자표시. 귀하는 원저작자를 표시하여야 합니다. 비영리. 귀하는 이 저작물을 영리 목적으로 이용할 수 없습니다. 변경금지. 귀하는 이 저작물을 개작, 변형 또는 가공할 수 없습니다.
A THESIS FOR THE DEGREE OF MASTER OF SCIENCE
Studies on dietary protein
hydrolysates for red seabream
(Pagrus major) and olive flounder
(Paralichthys olivaceus)
JEJU NATIONAL UNIVERSITY
Department of Marine Life Science
BUI, THI DIEU HIEN
Studies on dietary protein hydrolysates for red
seabream (Pagrus major) and olive flounder
(Paralichthys olivaceus)
Bui, Thi Dieu Hien
(Supervised by Professor Kyeong-Jun Lee)
A thesis submitted in partial fulfillment of the requirement for the degree of
Master of Science
2014. 2.
This thesis has been examined and approved.
………
Thesis director, Gi-Young Kim, Associate Professor of Marine Life Sciences
………
Sang-Rul Park, Assistant Professor of Marine Life Sciences
………
Kyeong-Jun Lee, Associate Professor of Marine Life Sciences
Feb, 2014
Department of Marine Life Science
GRADUATE SCHOOL
JEJU NATIONAL UNIVERSITY
CONTENTS
국문초록 ... i ABSTRACT ... iii LIST OF FIGURES ... v LIST OF TABLES ... vi 1. INTRODUCTION ... 1EXPERIMENT I. Study on dietary protein hydrolysates for red seabream (Pagrus major) .. 3
2.1.
MATERIALS AND METHODS ... 42.1.1.
Experimental diets... 42.1.2.
Fish and feeding trial... 82.1.3.
Sample collection ... 82.1.4.
Analytical methods ... 92.1.5.
Digestibility test ... 122.1.6.
Bacterial challenge ... 132.1.7.
Statistical analysis ... 143.1.
RESULTS ... 153.1.1.
Growth performance ... 153.1.2.
Whole body composition ... 173.1.3.
Hematological parameters ... 183.1.4.
Non-specific immunity parameters ... 193.1.5.
Apparent digestibility coefficient ... 213.1.6.
Challenge test ... 22EXPERIMENT II. Study on dietary protein hydrolysates for olive flounder (Paralichthys
olivaceus) ... 28
2.2.
MATERIALS AND METHODS ... 292.2.1.
Experimental diets... 292.2.2.
Fish and feeding trial... 322.2.3.
Sample collection ... 322.2.4.
Bacterial challenge ... 333.2.
RESULTS ... 343.2.1.
Growth performance ... 343.2.2.
Whole body composition ... 363.2.3.
Non-specific immunity parameters ... 373.2.4.
Challenge test ... 394.2.
DISCUSSION ... 405.
REFERENCES ... 436.
SUMMARY ... 50i
국문초록
이 실험은 참돔(실험 1)과 넙치(실험 2)를 대상으로 사료 내 가수분해 단백질(protein hydrolysates)의 첨가효과를 알아보기 위해 수행되었다. 각 실험에 사용된 실험사료는 어분을 이용한 기초사료(Con)와 기초사료의 어분을 krill hydrolysate concentrate (KH), shrimp hydrolysate powder (SH), tilapia hydrolysate powder (TH)로 각각 4-5% 대체한 3 개의 사료로 총 4 개의 사료가 제작되었다. 실험 1 은 초기평균무게 29.0 ±0.1 g 의 참돔을 180 L 원형 플라스틱 수조에 각 실험구당 33 마리씩 3 반복으로 배치하였다. 실험사료는 1 일 2 회 만복급이 하였으며 실험은 총 12 주간 진행되었다. 실험 2 는 초기평균무게 45.5 ±0.2 g 의 넙치를 180 L 원형 플라스틱 수조에 각 실험구당 25 마리씩 3 반복으로 배치하였다. 실험사료는 1 일 2 회 만복급이 하였으며 실험은 총 5 주간 진행되었다. 실험 1 의 분석결과 KH 와 SH 실험구의 성장 및 사료효율이 대조구에 비해 유의적으로 증가하였다. 실험사료의 단백질 소화율은 가수분해 단백질로 어분을 대체한 실험구(KH, SH, TH)가 대조구에 비해 유의적으로 높았다. Antiprotease 와 superoxide dismutase 활성은 KH 실험구가 대조구에 비해 유의적으로 높았다. Immunoglobulin level 은 KH, SH, TH 실험구가 대조구에 비해 유의적으로 높았다. 병원성 균주(Edwardsiella tarda)를 이용한 공격실험 결과 KH 와 TH 실험구의 생존율이 대조구에 비해 유의적으로 높았다. 실험 2 의 분석결과 SH 실험구의 성장 및 사료효율이 대조구에 비해 유의적으로 증가하였다. 전어체의 단백질 함량은 KH, SH, TH 실험구가 대조구에 비해 높았으며 지방 함량은 TH 실험구가 대조구에 비해 유의적으로 낮았다. Myeloperoxidase 와 superoxide dismutase 활성은 SH 실험구가 대조구에 비해
ii 유의적으로 높았으며 immunoglobulin level 은 KH 실험구가 대조구에 비해 유의적으로 높았다. 병원성 균주(Streptococcus iniae)를 이용한 공격실험 결과 KH 와 TH 실험구의 생존율이 대조구에 비해 유의적으로 높았다. 이상의 결과를 종합해 볼 때 사료 내 가수분해 단백질의 첨가는 넙치와 참돔의 성장과 사료효율을 증진시키고 면역력과 질병저항성을 향상시킬 수 있을 것으로 사료된다.
iii
ABSTRACT
Two feeding trials were carried out to examine the effects of dietary supplementation of protein hydrolysates on red seabream and olive founder. Two set of experimental diets were prepared in a similar way, a basal fish meal based diet was used as a control and three other diets were prepared by partial replacement of fish meal with krill hydrolysate concentrate, shrimp hydrolysate powder or tilapia hydrolysate powder (designated as Con, KH, SH and TH, respectively). In experiment I, triplicate groups of red seabream (29.0 ± 0.1 g) were fed one of the diets to apparent satiation twice a day for 12 weeks. Growth performance and feed utilization were significantly higher in fish fed the KH and SH diets. Diets with the tested hydrolysates showed significantly higher digestibility of dietary protein compared to the Con diet. Antiprotease and superoxide dismutase activities were significantly increased in fish fed the KH diet compared to those of fish fed the Con diet. Immunoglobulin level was significantly elevated in fish fed diets containing the hydrolysates. Dietary inclusion of KH and TH significantly increased disease resistance of fish against Edwardsiella tarda. In experiment II, Triplicate groups of fish (45.5 ± 0.2 g) were fed one of the diets to apparent satiation twice daily for 5 weeks. Growth performance and feed utilization were significant higher in fish fed SH diet compared to those the other experimental groups. Significantly higher whole-body protein contents were found in all hydrolysate treated groups. Also, significantly increased whole-body dry matter showed in fish fed the SH whereas whole-body lipid significantly decreased fish offered the TH diet. Myeloperoxidase and superoxide dismutase activities were significantly increased in fish fed the SH diet and immunoglobulin did so in fish provided KH diet compare to those of fish fed
iv
the Con diet. The results of challenge test revealed the significant increase of fish disease resistance against S. iniae in fish groups fed the KH and TH diets.
The results of two experiments indicate that dietary supplementation of the
protein hydrolysates, even to a high fish meal diet, is an efficient strategy to improve
growth performance, feed utilization, innate immunity and disease resistance of red
seabream and olive flounder.
v
LIST OF FIGURES
Fig. 1-1. Apparent digestibility coefficient of dry matter (ADCd) and apparent digestibility coefficient of protein (ADCp) of fish fed the four experimental diets. ... 21 Fig. 1-2. Survival rate of red seabream fed the four experimental diets after challenge with Edwardsiella tarda. ... 22 Fig. 2-1. Survival rate of olive flounder fed the four experimental diets after challenge with Streptococcus iniae. ... 39
vi
LIST OF TABLES
Table 1-1. Chemical compositions and peptide profiles of the tested protein hydrolysates .. 5 Table 1-2. Dietary formulation and proximate composition of the four experimental diets for red seabream (% dry matter). ... 6 Table 1-3. Growth performance and feed utilization of red seabream fed the four
experimental diets for 12 weeks. ... 16 Table 1-4. Whole-body composition of red seabream fed the four experimental diets for 12 weeks. ... 17 Table 1-5. Hematological parameters of red seabream fed the four experimental diets for 12 weeks. ... 18 Table 1-6. Non-specific immune parameters of red seabream fed the four experimental diets for 12 weeks. ... 20 Table 2-1. Dietary formulation and proximate composition of the four experimental diets for olive flounder (% dry matter). ... 30 Table 2-2. Growth performance and feed utilization of olive flounder fed the four
experimental diets for 5 weeks. ... 35 Table 2-3. Whole-body composition of olive flounder fed the four experimental diets for 5 weeks. ... 36 Table 2-4. Non-specific immune parameters of olive flounder fed the four experimental diets for 5 weeks. ... 38
1
1.
INTRODUCTION
The principle of enzymatic hydrolysis of protein is the use of multi-enzymes under controlled conditions to breakdown protein chains into low molecular weight compounds such as free amino acids and short chain peptides. It is well known that fish processing waste as a rich source of diverse bioactive nitrogenous components (Harnedy and FitzGerald 2012). Enzymatic hydrolysis is an ideal technology for converting low value byproducts from fish processing to biologically functional products (Gildberg, 1993; Shahidi, 1994). Fish protein hydrolysates have been proven as a potential protein source with well-balanced amino acid profile and bioactive peptides being applied in many important sectors including pharmaceutical and feed industries (Chalamaiah et al., 2012). In aquaculture, fish protein hydrolysates have been evaluated in several fish species as fish meal replacer, attractant (Hardy, 1991; Cahu et al., 1999; Refstie et al., 2004) and immunostimulant (Bøgwald et al., 1996; Gildberg et al., 1996; Liang et al., 2006).
Composition of amino acids and bioactive peptides of protein hydrolysates varies depending on the processed raw material, enzyme source and hydrolysis conditions (Klompong et al., 2009). There is limited information on the beneficial effects of using the protein hydrolysates from different sources of aquatic byproducts in fish feeds. Thus, it is a novel challenge to estimate potential properties, nutritive value and practical implement of the protein hydrolysates from various sources of aquatic processing wastes. In the shrimp processing industry, approximately 35-45% of processed materials are discarded as leftovers (INFOFISH, 1991). These wastes comprise useful components such as proteins, lipid, carotenoids and chitin (Heu et al., 2003; Zhao et al., 2011). The processing of the shrimp wastes by enzymatic hydrolysis results in the formation of bioactive peptides with growth
2
and non-specific stimulating properties (Gildberg and Stenberg, 2001). Among cultured fish species in the world, tilapia production is ranked the second-largest after carps (FAO, 2010). Annually, a huge quantity of tilapia byproducts with promising nutritional and functional values was generated. Tilapia protein hydrolysate is a desirable source of essential amino acids and minerals suggesting it as a potential ingredient in aquafeeds (Foh et al., 2011). Antarctic krill is a rich source of high quality protein which is poorly utilized (Gildberg, 1993). The hydrolysis of krill protein has been expected to add more value and more marketable products. Krill hydrolysate was reported as a feed attractant in the diets of yellow perch (Perca flavescens) and lake whitefish (Coregonus clupeaformis) (Kolkovski et al., 2000).
Red sea bream (Pagrus major) is a high value commercial marine cultured fish specially in Korea and Japan, due to its flavor for a high-quality sashimi grade and its traditional use as special food often served at New Year's and festive occasions.
Olive flounder has been the most important marine aquaculture species in Korea. Its production increased sharply from 48,073 tons in 2001 to 91,125 tons in 2006 (Kim et al. 2007).
We conducted two experiments to investigate the effects of dietary supplementation of the protein hydrolysates including krill hydrolysate concentrate, shrimp hydrolysate powder and tilapia hydrolysate powder on juveniles red seabream and olive flounder.
3
Experiment I
Growth performance, feed utilization, innate immunity, digestibility and
disease resistance of juvenile red seabream (Pagrus major) fed diets
supplemented with protein hydrolysates
4
2.1. MATERIALS AND METHODS
2.1.1. Experimental diets
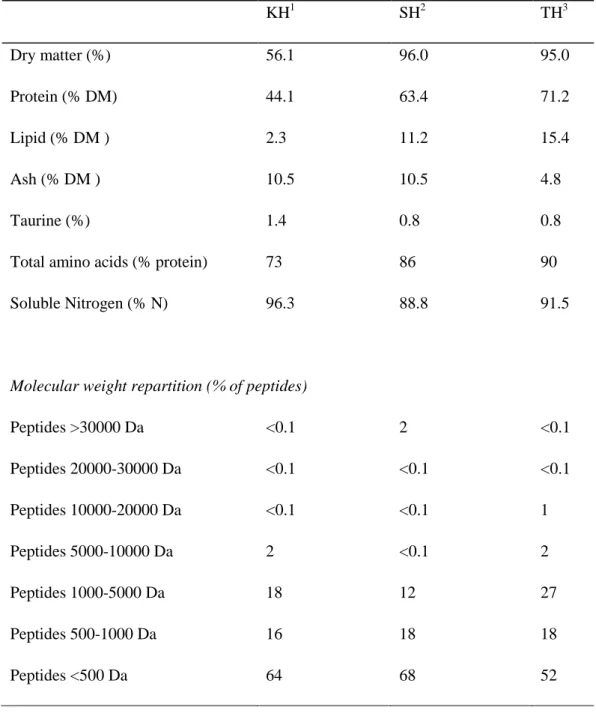
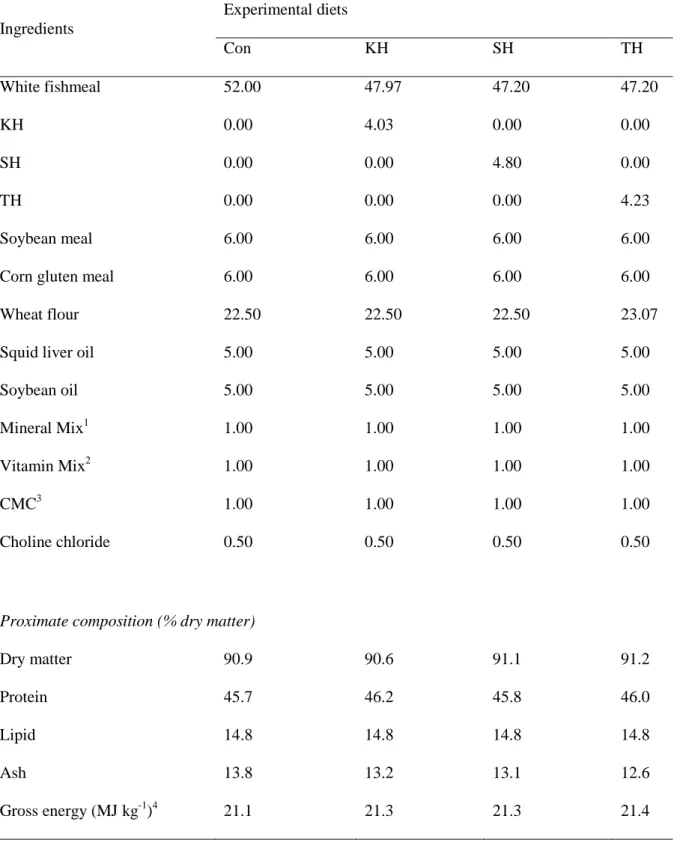
Three protein hydrolysates were provided by AQUATIV (Aquaculture division of DIANA Group), Elven, France. Briefly, whole Antarctic krill (Euphausia superba) was enzyme hydrolyzed and defatted to produce krill hydrolysate concentrate (KH). Farmed white shrimp (Litopenaeus vannamei) head co-products were enzyme hydrolyzed and spray-dried to produce shrimp hydrolysate powder (SH). Farmed tilapia co-products containing heads, bones, trims and viscera were enzyme processed and spray-dried to produce tilapia hydrolysate powder (TH). Proximate composition and peptide profile of the protein hydrolysates are provided in Table 1-1. Peptide profiles of the hydrolysates were determined by size exclusion chromatography method (Guérard et al., 2001). Four experimental diets were formulated to be isonitrogenous (46% crude protein) and isocaloric (21.1MJ kg-1). A basal fish meal based diet was regarded as a control and three other experimental diets were prepared by partial replacement of fish meal with KH, SH or TH (designated as Con, KH, SH and TH, respectively) (Table 1-2). All dry ingredients were thoroughly mixed with squid liver oil, soybean oil and 20~30% double distilled water. Then, the mixed dough was extruded through a meat chopper machine (SMC-12, Kuposlice, Busan, Korea) in 3 mm diameter, freeze-dried at −40°C for 24 h and stored at −20°C until use.
5
Table 1-1. Chemical compositions and peptide profiles of the tested protein hydrolysates
.
1
Krill hydrolysate concentrate
2
Shrimp hydrolysate powder
3
Tilapia hydrolysate powder
KH1 SH2 TH3 Dry matter (%) 56.1 96.0 95.0 Protein (% DM) 44.1 63.4 71.2 Lipid (% DM ) 2.3 11.2 15.4 Ash (% DM ) 10.5 10.5 4.8 Taurine (%) 1.4 0.8 0.8
Total amino acids (% protein) 73 86 90 Soluble Nitrogen (% N) 96.3 88.8 91.5
Molecular weight repartition (% of peptides)
Peptides >30000 Da <0.1 2 <0.1 Peptides 20000-30000 Da <0.1 <0.1 <0.1 Peptides 10000-20000 Da <0.1 <0.1 1 Peptides 5000-10000 Da 2 <0.1 2 Peptides 1000-5000 Da 18 12 27 Peptides 500-1000 Da 16 18 18 Peptides <500 Da 64 68 52
6
Table 1-2. Dietary formulation and proximate composition of the four experimental diets for
Ingredients Experimental diets Con KH SH TH White fishmeal 52.00 47.97 47.20 47.20 KH 0.00 4.03 0.00 0.00 SH 0.00 0.00 4.80 0.00 TH 0.00 0.00 0.00 4.23 Soybean meal 6.00 6.00 6.00 6.00 Corn gluten meal 6.00 6.00 6.00 6.00 Wheat flour 22.50 22.50 22.50 23.07 Squid liver oil 5.00 5.00 5.00 5.00 Soybean oil 5.00 5.00 5.00 5.00 Mineral Mix1 1.00 1.00 1.00 1.00 Vitamin Mix2 1.00 1.00 1.00 1.00
CMC3 1.00 1.00 1.00 1.00
Choline chloride 0.50 0.50 0.50 0.50
Proximate composition (% dry matter)
Dry matter 90.9 90.6 91.1 91.2 Protein 45.7 46.2 45.8 46.0 Lipid 14.8 14.8 14.8 14.8 Ash Gross energy (MJ kg-1)4 13.8 21.1 13.2 21.3 13.1 21.3 12.6 21.4
7
1
Mineral premix (g kg-1 of mixture): MgSO4.7H2O, 80.0; NaH2PO4.2H2O, 370.0; KCl, 130.0;
Ferric citrate, 40.0; ZnSO4.7H2O, 20.0; Ca-lactate, 356.5; CuCl, 0.2; AlCl3. 6H2O, 0.15;
Na2Se2O3, 0.01; MnSO4.H2O, 2.0; CoCl2.6H2O, 1.0. 2
Vitamin premix (g kg-1 of mixture):L-ascorbic acid, 121.2; DL- tocopheryl acetate, 18.8; thiamin hydrochloride, 2.7; riboflavin, 9.1; pyridoxine hydrochloride, 1.8; niacin, 36.4; Ca-D
-pantothenate, 12.7; myo-inositol, 181.8; D-biotin, 0.27; folic acid, 0.68; p-aminobezoic acid,
18.2; menadione, 1.8; retinyl acetate, 0.73; cholecalficerol, 0.003; cyanocobalamin, 0.003.
3
Carboxymethyl Cellulose
4
Gross energy of experimental diets was calculated according to gross energy values 5.64 kcal g-1 crude protein, 4.11 kcal g-1 carbohydrate, and 9.44 kcal g-1 crude fat, respectively (NRC, 1993 ).
8 2.1.2. Fish and feeding trial
Juvenile red seabreams were transported from a private hatchery to the Marine and Environmental Research Institute, Jeju National University, Jeju, Korea. The health status of the fish was checked upon arrival and the fish were immediately treated with 100 mg L-1 formalin for 20 min. The fish were fed a commercial diet for 2weeks to be acclimated to the experimental conditions and facilities. At the end of the acclimation period, the fish (initial mean body weight, 29.0 ± 0.1 g) were randomly distributed into 12 polyvinyl circular tanks of 150L capacity at a density of 33 fish per tank. The tanks were supplied with sand filtered seawater at a flow-rate of 3 L min-1 and aeration to maintain enough dissolved oxygen. A photoperiod of 12h light and 12h dark was used. The average water temperature during the trial was 22.0 ± 1.8°C. Triplicate groups of fish were fed one of the experimental diets to apparent satiation (twice a day, at 08:00 and 18:00 h) for 12 weeks. Uneaten feed was collected 30 min after feeding and reweighed to determine feed intake. Fish growth performance was measured every 3 weeks. Feeding was stopped 24 h prior to weighing or blood sampling to minimize stress on fish.
2.1.3. Sample collection
At the end of the feeding trial, all the fish in each tank were bulk-weighed and counted for calculation of growth parameters and survival. Blood samples were collected from individual fish, and each sample was analyzed separately. Three fish per tank (nine fish
9
per dietary treatment) were randomly captured, anesthetized with 2-phenoxyethanol solution (200 ppm) and blood samples were taken from the caudal vein with heparinized syringes for determination of hematocrit, hemoglobin and respiratory burst activity. Then plasma samples were separated by centrifugation at 5000 × g for 10 min and stored at −70°C for determination of immunoglobulin (Ig) level and blood biochemical parameters including glucose, total protein, total cholesterol and triglyceride levels.
Another set of blood samples was taken from the caudal vein of three fish per tank (nine fish per treatment) using non-heparinized syringes and allowed to clot at room temperature for 30 min. Then the serum was separated by centrifugation for 10 min at 5000 × g and stored at −70°C for analysis of innate immune parameters including lysozyme, superoxide dismutase (SOD), myeloperoxidase (MPO) and antiprotease activities.
2.1.4. Analytical methods
Hematocrit was determined by microhematocrit technique (Brown, 1980). Hemoglobin, total protein, triglyceride, glucose and total cholesterol concentrations were determined by using an automated blood analyzer (SLIM, SEAC Inc., Florence, Italy).
Analysis of moisture and ash contents of diets and whole-body samples were performed by the standard procedures (AOAC, 1995). Crude protein was measured by using an automatic Kjeltec Analyzer Unit 2300 (FossTecator, Höganäs, Sweden) and crude lipid was determined using the Soxhlet method with extraction in diethyl ether (Soxhlet Extraction System C-SH6, Korea).
10
measured using the NBT (nitro-blue-tetrazolium) assay described by Anderson and Siwicki (1995). Briefly, blood and NBT (0.2%) (Sigma, St. Louis, MO, USA) were mixed in equal proportion (1:1) and incubated for 30 min at room temperature. Then, 50 µL was removed and dispensed into glass tubes. One milliliter of dimethylformamide (Sigma) was added and centrifuged at 2000 × g for 5 min. Finally, the optical density of the supernatant was measured at 540 nm using a spectrophotometer (Genesys 10UV, Rochester, NY, USA). Dimethylformamide was used as the blank.
A turbidimetric assay was used to determine serum lysozyme levels using the method described by Hultmark et al. (1980) with slight modifications. Briefly, Micrococcus luteus (0.75 mg mL-1) was suspended in sodium phosphate buffer (pH 6.4, 0.1 M), 200 µL of suspension was placed in each well of a 96-well plate, and 20 µL of serum was added. The reduction in absorbance of samples was determined at 570 nm in a microplate reader after room temperature incubation for 0 and 30 min (UVM 340, Biochrom, Cambridge, UK). Hen egg white lysozyme (Sigma) was used for the standard curve. Values are expressed as µg mL-1.
Serum MPO activity was measured according to Quade and Roth (1997). Briefly, 20 µL of serum was diluted with Hanks Balanced Salt Solution (HBSS, Sigma) without Ca2+ and Mg2+ in 96-well plates. Then, 35 µL of 3,3’,5,5’-tetramethylbenzidine hydrochloride (TMB, 20 mM) (Sigma) and H2O2 (5 mM) was added. The color change reaction was
stopped after 2 min by adding 35 µL of 4 M sulfuric acid. Finally, optical density was read at 450 nm in a microplate reader.
SOD activity was measured by the percentage reaction inhibition rate of enzyme with WST-1 (water soluble tetrazolium dye) substrate and xanthine oxidase using a SOD Assay Kit (Sigma, 19160) according to the manufacturer's instructions. Each endpoint assay was monitored by absorbance at 450 nm (the absorbance wavelength for the colored product
11
of the WST-1 reaction with superoxide) after 20 min of reaction time at 37°C. Percent inhibition was normalized by mg protein and presented as SOD activity units.
Serum antiprotease activity was measured according to the method described by Ellis (1990) with slight modifications (Magnadóttir et al., 1999). Briefly, 20 µL of serum was incubated with 20 μL of standard trypsin solution (Type II-S, from porcine pancreas, 5 mg mL-1, Sigma) for 10 min at 22°C. Then, 200 μL of phosphate buffer (0.1 M, pH 7.0) and 250 μL azocasein (2%) (Sigma) were added and incubated for 1 h at 22°C. Five hundred microliters of 10% trichloro acetic acid was added and further incubated for 30 min at 22°C. The mixture was centrifuged at 6000 × g for 5 min, and 100 μL of the supernatant was transferred to the wells of a 96 well flat bottomed microplate containing 100 μL of 1 N NaOH. Optical density was read at 430 nm. Buffer replaced the serum for the 100% positive control, and buffer replaced both serum and trypsin for the negative control. The trypsin inhibition percentage was calculated using the following equation:
Trypsin inhibition (%) = (A1 – A2/A1) × 100
Where A1 = control trypsin activity (without serum) and A2 = trypsin activity remaining after
adding serum.
Plasma Ig level was determined according to the method described by Siwicki and Anderson (1993). Briefly, plasma total protein content was measured using a micro protein determination method (C-690; Sigma), the immunoglobulin was precipitated out of the plasma with 12% solution of polyethylene glycol (Sigma). The total immunoglobulin was determined from the difference in the total plasma protein before and after precipitation of the plasma immunoglobulin.
12 2.1.5. Digestibility test
For estimation of apparent digestibility coefficient (ADC) of the experimental diets, chromic oxide (Cr2O3) (Sigma-Aldrich, St. Louis, USA) was included in the diets as an inert
indicator at a concentration of 1.0%. All dry ingredients were thoroughly mixed and extruded through a meat chopper machine (SMC-12, Kuposlice, Busan, Korea) in 5 mm diameter after addition of squid liver oil, soybean oil and 20~30% double distilled water. The prepared pellets were freeze-dried at −40°C for 24 h and maintained in a freezer at −20°C until used.
The digestibility trial was conducted in four fiberglass fecal collection tanks of 300 L capacity, designed according to Cho et al. (1982). New sets of olive flounder with mean body weight of 50 g were stocked into each tank at a density of 40 fish per tank and each group of fish was fed one of the test diets. The tanks were supplied with cartridge-filtered seawater at a flow rate of 1 L min-1 and aeration to maintain enough dissolved oxygen. The digestibility trial consisted of three periods of 10 days. In each 10-day period, the fish were allowed to become acclimatized to the feed for the first three days and feces were collected over the next 7 days. Then, diets were randomly changed between tanks and the procedure repeated for two more times, giving a total of three fecal samples for each diet. All feces collected from each tank in each period were pooled and frozen at −20ºC for analysis. After feeding, the tanks and the settling columns were thoroughly cleaned to eliminate all feed waste and fecal residues. Chromium oxide content of diet and feces samples was analyzed by the method described by Divakaran et al. (2002). The apparent digestibility coefficient for protein of the experimental diets was calculated through the following formula:
13
ADC = 1 – ((Cr2O3 in feed / Cr2O3 in feces) × (Nutrient content of feces / Nutrient
content of feed)).
2.1.6. Bacterial challenge
At the end of the feeding trial, 15 fish from each tank (45 fish per treatment) were randomly captured and subjected to a bacterial challenge. Edwardsiella tarda (ATCC 15947, Korea Collection for Type Cultures) was used as the pathogenic agent (provided by the Marine Microbiology Laboratory of Jeju National University). The bacterium, originally isolated from diseased olive flounder, was cultured in 10 ml BHI broth (Difco, Detroit, MI, USA) with 1.5% NaCl and incubated with shaking for 24 h at 37 °C. Bacterial growth was measured at an optical density of 700 nm followed by plate counting in BHI-NaCl. The isolated bacteria were identified using the API 20E commercial identification kit (bioMérieux, Marcy l'Etoile, France). The fish were injected intraperitoneally with E. tarda suspension containing 1×10⁵ CFU mL-1. The bacterium concentration was determined by plate counting on BHI agar. After injection, the fish were distributed into 12 plastic tanks of 65 L capacity and their mortality was monitored and recorded for 21 days.
14 2.1.7. Statistical analysis
All diets were assigned by a completely randomized design. Data were analyzed by one-way analysis of variance (ANOVA) in SPSS version 12.0 (SPSS Inc., Chicago, IL, USA). When ANOVA identified differences among groups, the differences in mean values were compared using Tukey’s HSD test at the 5% level of significance (P<0.05). Data are presented as mean ± SD. Percentage data were arcsine transformed before analysis.
15
3.1. RESULTS
3.1.1. Growth performance
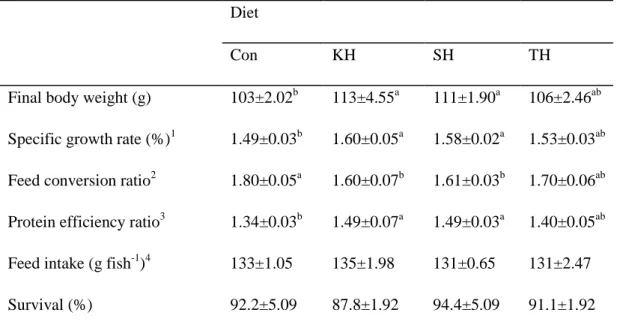
All the experimental diets were readily accepted by the juvenile red seabreams at the start of the feeding trial and they fed aggressively during the 12 weeks of the feeding trial. After 12 weeks of feeding trial, growth performance and feed utilization of the fish groups fed the KH and SH diets were significantly improved compared to those of fish fed the Con diet. Survival rate varied from 87 to 94% without significant differences among dietary treatments. No significant difference was observed in feed intake among the fish groups (Table 1-3).
16
Table 1-3. Growth performance and feed utilization of red seabream (initial body weight, 29.0 ± 0.1 g) fed the four experimental diets for 12 weeks.
Diet
Con KH SH TH
Final body weight (g) 103±2.02b 113±4.55a 111±1.90a 106±2.46ab Specific growth rate (%)1 1.49±0.03b 1.60±0.05a 1.58±0.02a 1.53±0.03ab Feed conversion ratio2 1.80±0.05a 1.60±0.07b 1.61±0.03b 1.70±0.06ab Protein efficiency ratio3 1.34±0.03b 1.49±0.07a 1.49±0.03a 1.40±0.05ab Feed intake (g fish-1)4 133±1.05 135±1.98 131±0.65 131±2.47 Survival (%) 92.2±5.09 87.8±1.92 94.4±5.09 91.1±1.92
Values are mean of triplicate groups and presented as mean ± S.D. Values with different superscripts in the same row are significantly different (P<0.05). The lack of superscript letter indicates no significant differences among treatments.
1
Specific growth rate (%) = [(loge final body weight - loge initial body weight)/days] × 100 2
Feed conversion ratio = dry feed fed /wet weight gain
3
Protein efficiency ratio = wet weight gain /total protein given
4
17 3.1.2. Whole body composition
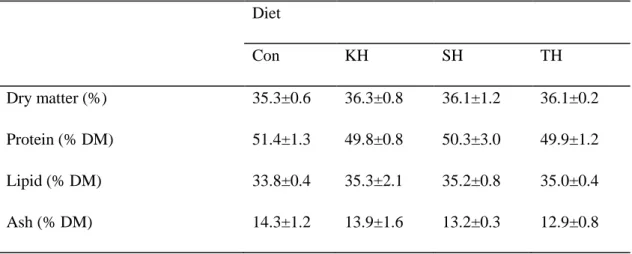
Whole body composition of red seabream after 12 weeks of feeding trial was not affected by dietary treatment (Table 1-4). However, slightly lower moisture and higher lipid contents were recorded in fish fed diets containing the tested hydrolysate. There seemed to be a trend of slightly higher protein and ash contents observed in fish fed the control diet.
Table 1-4. Whole-body composition of red seabream fed the four experimental diets for 12 weeks. Diet Con KH SH TH Dry matter (%) 35.3±0.6 36.3±0.8 36.1±1.2 36.1±0.2 Protein (% DM) 51.4±1.3 49.8±0.8 50.3±3.0 49.9±1.2 Lipid (% DM) 33.8±0.4 35.3±2.1 35.2±0.8 35.0±0.4 Ash (% DM) 14.3±1.2 13.9±1.6 13.2±0.3 12.9±0.8
Values are mean of triplicate groups and presented as mean ± S.D. The lack of superscript letter indicates no significant differences among treatments.
18 3.1.3. Hematological parameters
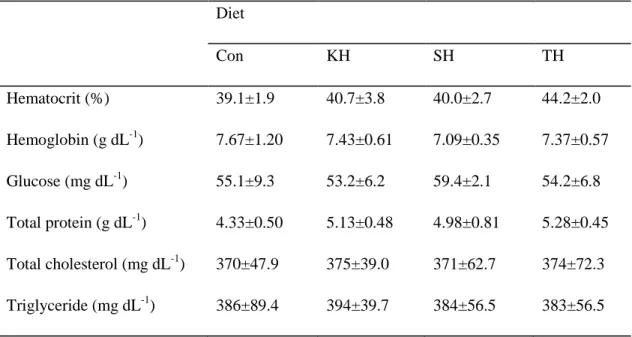
After 12 weeks of feeding trial, hematological parameters of red seabream were not significantly influenced by dietary treatments (Table 1-5). However, numerically higher hematocrit and total protein levels were found in fish fed the diets containing the tested hydrolysates.
Table 1-5. Hematological parameters of red seabream fed the four experimental diets for 12 weeks. Diet Con KH SH TH Hematocrit (%) 39.1±1.9 40.7±3.8 40.0±2.7 44.2±2.0 Hemoglobin (g dL-1) 7.67±1.20 7.43±0.61 7.09±0.35 7.37±0.57 Glucose (mg dL-1) 55.1±9.3 53.2±6.2 59.4±2.1 54.2±6.8 Total protein (g dL-1) 4.33±0.50 5.13±0.48 4.98±0.81 5.28±0.45 Total cholesterol (mg dL-1) 370±47.9 375±39.0 371±62.7 374±72.3 Triglyceride (mg dL-1) 386±89.4 394±39.7 384±56.5 383±56.5
Values are mean of triplicate groups and presented as mean ± S.D. The lack of superscript letter indicates no significant differences among treatments.
19 3.1.4. Non-specific immunity parameters
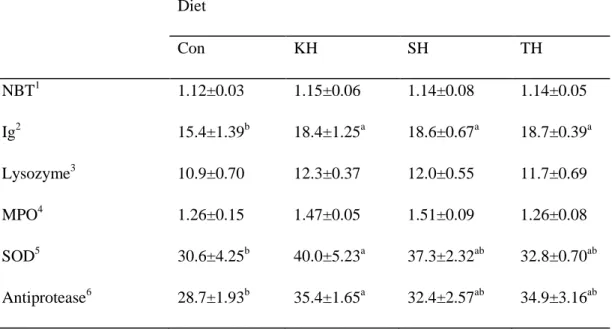
Non-specific immune responses of red seabream after 12 weeks of feeding trial including nitro blue tetrazolium (NBT), immunoglobulin, lysozyme, myeloperoxidase (MPO), superoxide dismutase (SOD) and antiprotease activities are provided in Table 1-6. Dietary inclusion of the protein hydrolysates resulted in significantly higher Ig level compared to the Con diet. Significantly higher SOD and antiprotease activities were found in fish fed the KH diet than in fish fed the Con diet. Although, numerically higher lysozyme, MPO and respiratory burst activities (NBT) were detected in fish fed diets containing the hydrolysates, the differences were not significant.
20
Table 1-6. Non-specific immune parameters of red seabream fed the four experimental diets for 12 weeks. Diet Con KH SH TH NBT1 1.12±0.03 1.15±0.06 1.14±0.08 1.14±0.05 Ig2 15.4±1.39b 18.4±1.25a 18.6±0.67a 18.7±0.39a Lysozyme3 10.9±0.70 12.3±0.37 12.0±0.55 11.7±0.69 MPO4 1.26±0.15 1.47±0.05 1.51±0.09 1.26±0.08 SOD5 30.6±4.25b 40.0±5.23a 37.3±2.32ab 32.8±0.70ab Antiprotease6 28.7±1.93b 35.4±1.65a 32.4±2.57ab 34.9±3.16ab
Values are mean of triplicate groups and presented as mean ± SD. Values in the same row having different superscript letters are significantly different (P<0.05). The lack of superscript letter indicates no significant differences among treatments.
1
Nitro blue tetrazolium activity (absorbance)
2
Immunoglobulin (mg mL-1)
3
Lysozyme activity (µg mL-1)
4
Myeloperoxidase level (absorbance)
5
Superoxide dismutase (% inhibition)
6
21 3.1.5. Apparent digestibility coefficient
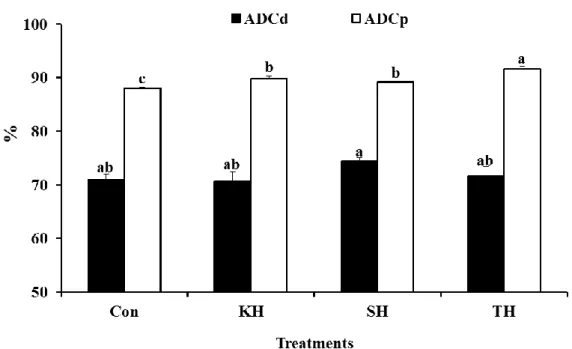
Incorporation of the tested hydrolysates in diets significantly enhanced apparent digestibility coefficient of protein and the highest value was obtained in fish fed the TH diet followed by the KH diet. Fish fed the SH diet showed remarkably higher apparent digestibility coefficient of dry matter than the others. However no significance was revealed (Fig. 1-1).
Figure 1-1. Apparent digestibility coefficient of dry matter (ADCd) and apparent digestibility coefficient of protein (ADCp) of fish fed the four experimental diets.
22 3.1.6. Challenge test
During the E.tarda challenge test, the first dramatic mortality was observed on the third day after injection where the fish fed the Con and SH diets showed lower disease resistance compared to those fed the other experimental diets (Fig.1-2). At the end of the challenge test the control group had the lowest survival rate (17.8%) and significantly differed from those of fish fed the KH and TH diets. Also, fish fed the SH diet exhibited numerically higher disease resistance than the control group but the difference was not significant.
Figure 1-2. Survival rate of red seabream fed the four experimental diets after
challenge with Edwardsiella tarda.
23
4.1. DISCUSSION
In the present study dietary supplementation of KH and SH resulted in significant improvements in growth performance and feed utilization of red seabream. The positive effects of low molecular weight compounds in protein hydrolysates on fish growth and feed utilization have been well documented (Aksnes et al., 2006b; Zheng et al., 2012a). The protein hydrolysates used in this study comprise mainly small peptides with molecular weight below 5000 Da (Table 1). These results are in agreement with previous studies in which the inclusion of protein hydrolysates possessing low molecular weight peptides showed beneficial effects on growth performance and feed efficiency in fish. Refstie et al. (2004) obtained faster growth rate of Atlantic salmon when 10-15% of fish meal was replaced by fish protein hydrolysate. Also, Zheng et al. (2012a) reported that ultra-filtered fish protein hydrolysate at dietary inclusion level of 3.7% can enhance growth and feed utilization of juvenile Japanese flounder. In contrast, Oliva-Teles et al. (1999) showed that partial replacement of fish meal with fish protein hydrolysate did not improve growth and feed utilization of juvenile turbot. The variations in the results of hydrolysate administration can be attributed to the changes in protein hydrolysate material, enzyme source and hydrolysis conditions (Klompong et al., 2009). Furthermore, several studies pointed out that dietary inclusion of enzymatic protein hydrolysate at a moderate level promotes growth performance and feed utilization of fish, while lower or higher levels can cause negative effects (Hevrøy et al., 2005; Espe et al., 1999). The results of this study may indicate that the inclusion level of the protein hydrolysates was moderate and their nutritional values were better than those of fish meal leading to better performance of red seabream.
24
Improvement of diet palatability by protein hydrolysate supplementation has been suggested as one of the growth promoting effects of protein hydrolysates (Refstie et al., 2004; Hevrøy et al., 2005). In a study by Kolkovski et al. (2000), coating of a commercial diet with liquid krill hydrolysate resulted in a significant improvement in ingestion rates of diet in yellow perch (P. flavescens) and lake whitefish (C. clupeaformis). In the present study, the fish were fed to apparent satiation and the results showed no significant effect of the hydrolysates on fish feed intake. Similar results were reported by Aksnes et al. (2006 a, b) on Atlantic cod and rainbow trout. This may indicate that improved performance of fish in this study was not related to the diet palatability. Such enhancement in fish growth by the hydrolysates was probably due to the fast assimilation nature of the hydrolysates leading to a fast passing and absorption of nutrients through intestinal membrane (Aksnes et al., 2006a; Zheng et al., 2012a). The significant improvement in ADC of protein by the hydrolysate supplementation in the current study may support the general claim regarding to better absorbance of protein hydrolysates. This finding is in line with the results obtained by Zheng et al. (2012a) on Japanese flounder. However, Oliva-Teles et al. (1999) could not find any significant effect of dietary inclusion of fish protein hydrolysate on ADC of dietary protein for turbot.
In the current study, whole-body composition of red seabream was not significantly affected by hydrolysate incorporation. Similarly, Oliva-Teles et al. (1999) did not find any significant differences in whole-body proximate composition of turbot fed diets containing fish protein hydrolysate. Zheng et al. (2012b) examined the supplemental effects of ultra-filtered fish protein hydrolysate at two different levels as well as non-ultraultra-filtered hydrolysate on body composition of turbot. Their results showed significant increase in whole-body protein content when the fish were fed high concentration of the ultrafiltered protein hydrolysate compared to those fed fish meal based diet. The differences in the effects
25
of protein hydrolysates on fish whole-body composition can be due to the different sources of hydrolysates and their inclusion levels as well as the fish species under study.
Hematological parameters are used as valuable biological indicators indicating physiological stress response as well as the general health condition of fish (Rey Vázquez and Guerrero, 2007; Siwicki et al., 1994). In this study, all the measured blood parameters ranged within normal reported ranges for juvenile red seabream (Ji et al., 2007; Abdul Kader et al., 2011), and no significant differences were found among dietary treatments. These results show that the fish were in a good nutritional and environmental condition in this study and the tested hydrolysates had no adverse effects on health condition of juvenile red seabream.
Several previous studies have reported the biological functions of protein hydrolysates by means of their bioactive peptides (Gildberg et al., 1996; BØgwald et al., 1996; Harnedy and FitzGerald, 2012). There have been increasing concerns on immune-stimulating and antibacterial properties of protein hydrolysates in aquaculture. Fish immune system can be trigged by protein hydrolysate supplementation (Kotzamanis et al., 2007; Zheng et al., 2012b). Peptides with molecular weight from 500 to 3000 Da from fish protein hydrolysates have been reported to stimulate the activity of fish macrophages (Bogwald et al., 1996). However, there were varying degrees of success in previous studies due to the variation of bioactive peptide profiles of hydrolyzed protein depending on raw material, enzyme source and hydrolysis conditions (Klompong et al., 2009). Feeding Atlantic halibut with peptide-enriched live feed stimulated production of lysozyme and complements (Hermannsdottir et al., 2009). Similarly, Liang et al. (2006) found that supplementation of 15% fish protein hydrolysate in Japanese sea bass diet could enhance the activities of lysozyme and complement. Tang et al. (2008) also demonstrated that inclusion of fish protein hydrolysate could increase lysozyme activity, serum complement and immunoglobulin M of
26
the large yellow croaker. However, no positive effect of several fish protein hydrolysates was found on the immune system of coho salmon and turbot (Murray et al., 2003; Zheng et al., 2012b). In the current study, effects of the selected protein hydrolysates were examined on humoral parameters of non-specific immune response. The results showed significant increase of plasma Ig level in fish fed diets containing the hydrolysates. Significantly higher SOD and antiprotease activities were found in fish fed the KH diet.
The activation of non-specific immunity by immunostimulants is associated with increased protection against infectious disease (Sakai, 1999). The in vitro immunostimulatory effects of protein hydrolysates may also be effective in controlling disease-related loss among farmed fish (Murray et al., 2003). In this study, supplemental effects of the protein hydrolysates were examined in vivo by injection of E. tarda to the fish. This bacterium is the causative agent of Edwardsiellosis in a wide range of commercially important fish species including red seabream (Zhang et al., 2012). Occurrence of antibiotic resistant strains of E. tarda in fish was reported (Aoki and Takahashi, 1987; Aoki et al., 1989). Therefore, prophylactic against E. tarda by the inclusion of immunostimulants in diets becomes more practical to implement in a fish farm. In the current study, fish fed the control and SH diets showed high mortality after a few days of bacterial challenge, while the groups fed the KH and TH supplemented diets showed significantly higher disease resistance. Such enhancement in fish disease resistance can be partially due to the facilitated non-specific immune responses particularly in KH treated fish where significantly higher SOD and antiprotease activities as well as Ig level were obtained.
In conclusion, the findings in this study show that growth performance, feed utilization, and protein digestibility can be improved in red seabream juveniles by the dietary supplementation of krill hydrolysate concentrate or shrimp hydrolysate powder at moderate inclusion levels. Fish innate immunity and disease resistance can also be positively affected
27
by the tested protein hydrolysates particularly krill hydrolysate concentrate. Further studies are needed to verify the optimum supplementation level of each protein hydrolysate in the fish or other fish species.
28
Experiment II
Growth performance, feed utilization, innate immunity and disease
resistance of juvenile olive flounder (Paralichthys olivaceus) fed diets
29
2.2. MATERIALS AND METHODS
2.2.1. Experimental diets
Four experimental diets were formulated to be isonitrogenous (45% crude protein) and isocaloric (20.0MJ kg-1). A basal fish meal based diet was regarded as a control and three other experimental diets were prepared by partial replacement of fish meal with KH, SH or TH (designated as Con, KH, SH and TH, respectively) (Table 2-1). Then, the mixed dough was extruded through a meat chopper machine (SMC-12, Kuposlice, Busan, Korea) in 3 mm diameter, freeze-dried at −40°C for 24 h and stored at −20 °C until use.
30
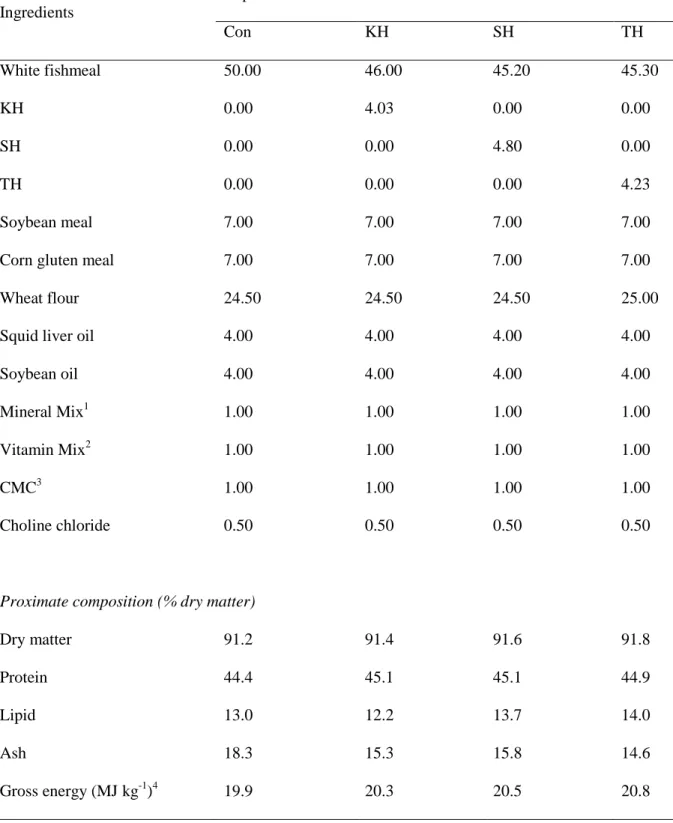
Table 2-1. Dietary formulation and proximate composition of the four experimental diets for olive flounder (% dry matter).
Ingredients Experimental diets Con KH SH TH White fishmeal 50.00 46.00 45.20 45.30 KH 0.00 4.03 0.00 0.00 SH 0.00 0.00 4.80 0.00 TH 0.00 0.00 0.00 4.23 Soybean meal 7.00 7.00 7.00 7.00 Corn gluten meal 7.00 7.00 7.00 7.00 Wheat flour 24.50 24.50 24.50 25.00 Squid liver oil 4.00 4.00 4.00 4.00 Soybean oil 4.00 4.00 4.00 4.00 Mineral Mix1 1.00 1.00 1.00 1.00 Vitamin Mix2 1.00 1.00 1.00 1.00
CMC3 1.00 1.00 1.00 1.00
Choline chloride 0.50 0.50 0.50 0.50
Proximate composition (% dry matter)
Dry matter 91.2 91.4 91.6 91.8 Protein 44.4 45.1 45.1 44.9 Lipid 13.0 12.2 13.7 14.0 Ash Gross energy (MJ kg-1)4 18.3 19.9 15.3 20.3 15.8 20.5 14.6 20.8
31
1
Mineral premix (g kg-1 of mixture): MgSO4.7H2O, 80.0; NaH2PO4.2H2O, 370.0; KCl, 130.0;
Ferric citrate, 40.0; ZnSO4.7H2O, 20.0; Ca-lactate, 356.5; CuCl, 0.2; AlCl3. 6H2O, 0.15;
Na2Se2O3, 0.01; MnSO4.H2O, 2.0; CoCl2.6H2O, 1.0. 2
Vitamin premix (g kg-1 of mixture):L-ascorbic acid, 121.2; DL- tocopheryl acetate, 18.8; thiamin hydrochloride, 2.7; riboflavin, 9.1; pyridoxine hydrochloride, 1.8; niacin, 36.4; Ca-D
-pantothenate, 12.7; myo-inositol, 181.8; D-biotin, 0.27; folic acid, 0.68; p-aminobezoic acid,
18.2; menadione, 1.8; retinyl acetate, 0.73; cholecalficerol, 0.003; cyanocobalamin, 0.003.
3
Carboxymethyl Cellulose
4
Gross energy of experimental diets was calculated according to gross energy values 5.64 kcal g-1 crude protein, 4.11 kcal g-1 carbohydrate, and 9.44 kcal g-1 crude fat, respectively (NRC, 1993 ).
32 2.2.2. Fish and feeding trial
Juvenile olive flounders were transported from a private hatchery to the Marine and Environmental Research Institute, Jeju National University, Jeju, Korea. The health status of the fish was checked upon arrival and the fish were immediately treated with 100 mg L-1 formalin for 20 min. The fish were fed a commercial diet for 2 weeks to be acclimated to the experimental conditions and facilities. At the end of the acclimation period, the fish (initial mean body weight, 45.5 ± 0.6 g) were randomly distributed into 12 polyvinyl circular tanks of 150L capacity at a density of 25 fish per tank and supplied with filtered seawater at a flow rate of 3 L min-1 and aeration to maintain enough dissolved oxygen. A photoperiod of 12h light and 12h dark was used. The water temperature during the feeding trial ranged from 21 to 27 °C according to the seasonal change. Triplicate groups of fish were fed one of the experimental diets to apparent satiation (twice a day, at 08:00 and 18:00 h) for 5 weeks. Uneaten feed was collected 30 min after feeding and reweighed to determine feed intake. Fish growth performance was measured every 2 weeks. Feeding was stopped 24 h prior to weighing or blood sampling to minimize stress on fish.
2.2.3. Sample collection
At the end of the feeding trial, all the fish in each tank were bulk-weighed and counted for calculation of growth parameters and survival. Blood samples were collected from individual fish, and each sample was analyzed separately. Three fish per tank (nine fish
33
per dietary treatment) were randomly captured, anesthetized with 2-phenoxyethanol solution (200 ppm) and blood samples were taken from the caudal vein with heparinized syringes for determination of respiratory burst activity. Then plasma samples were separated by centrifugation at 5000 × g for 10 min and stored at −70°C for determination of immunoglobulin (Ig) level, lysozyme, superoxide dismutase (SOD) and myeloperoxidase (MPO).
2.2.4. Bacterial challenge
At the end of the feeding trial, 10 fish from each tank (30 fish per treatment) were randomly selected and subjected to a bacterial challenge. Streptococcus iniae (ATCC 29178, Korea Collection for Type Cultures) was used as the pathogenic agent (provided by the Marine Microbiology Laboratory of Jeju National University). The bacterium, originally isolated from diseased olive flounder, was cultured in 10 ml BHI broth (Difco, Detroit, MI, USA) with 1.5% NaCl and incubated with shaking for 24 h at 37 °C. Bacterial growth was measured at an optical density of 700 nm followed by plate counting in BHI-NaCl. The isolated bacteria were identified using the API 20 STREP commercial identification kit (bioMérieux, Marcy l'Etoile, France). The fish were injected intraperitoneally with S.iniae suspension containing 1×10⁷ CFU mL-1. The bacterium concentration was determined by plate counting on BHI agar. After injection, the fish were distributed into 12 plastic tanks of 65 L capacity and their mortality was monitored and recorded for 22 days.
34
3.2. RESULTS
3.2.1. Growth performance
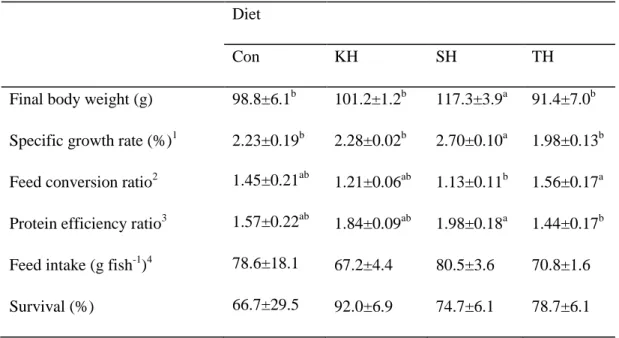
Growth performance and feed utilization of olive flounder after 5 weeks of the feeding trial are provided in Table 2-2. The group of fish fed the SH diet showed significantly higher growth performance than the other experimental groups. The highest protein efficiency ratio and the lowest feed conversion ratio were observed in the group fed the SH diet and significant difference from the group fish fed the TH diet. Feed intake results varied from 67.2 to 80.5 g/fish without significant difference among dietary treatments. Interestingly, remarkably higher survival rates were observed in the groups fed the KH diet than the other groups fed the other diets including the control diet, even though it was not significant (Table 2-2).
35
Table 2-2. Growth performance and feed utilization of olive flounder (initial body weight, 45.5 ± 0.6 g) fed the four experimental diets for 5 weeks.
Diet
Con KH SH TH
Final body weight (g) 98.8±6.1b 101.2±1.2b 117.3±3.9a 91.4±7.0b Specific growth rate (%)1 2.23±0.19b 2.28±0.02b 2.70±0.10a 1.98±0.13b Feed conversion ratio2 1.45±0.21ab 1.21±0.06ab 1.13±0.11b 1.56±0.17a Protein efficiency ratio3 1.57±0.22ab 1.84±0.09ab 1.98±0.18a 1.44±0.17b Feed intake (g fish-1)4 78.6±18.1 67.2±4.4 80.5±3.6 70.8±1.6 Survival (%) 66.7±29.5 92.0±6.9 74.7±6.1 78.7±6.1
Values are mean of triplicate groups and presented as mean ± S.D. Values with different superscripts in the same row are significantly different (P<0.05). The lack of superscript letter indicates no significant differences among treatments.
1
Specific growth rate (%) = [(loge final body weight - loge initial body weight)/days] × 100 2
Feed conversion ratio = dry feed fed /wet weight gain
3
Protein efficiency ratio = wet weight gain /total protein given
4
36 3.2.2. Whole body composition
Significantly higher whole-body protein contents were observed in fish groups fed the diets containing the tested hydrolysates compared to fish fed the control diet. Whole-body dry matter content exhibited significantly higher in fish fed the SH diet. Whole-Whole-body lipid content was significantly decreased in fish fed the TH diet; however, ash content was not significantly influenced by dietary treatments (Table 2-3).
Table 2-3. Whole-body composition of olive flounder fed the four experimental diets for 5 weeks. Diet Con KH SH TH Dry matter (%) 24.8±0.5b 25.6±0.7ab 26.2±0.2a 25.2±0.3ab Protein (% DM) 66.6±2.2b 72.4±0.9a 71.8±0.8a 71.9±1.0a Lipid (% DM) 17.2±0.2a 15.6±0.3b 16.1±0.7ab 14.0±0.6c Ash (% DM) 14.6±4.0 13.4±0.6 13.0±0.5 14.8±0.3
Values are mean of triplicate groups and presented as mean ± S.D. Values with different superscripts in the same row are significantly different (P<0.05). The lack of superscript letter indicates no significant differences among treatments.
37 3.2.3. Non-specific immunity parameters
Analysis of the innate immune responses of olive flounder after five weeks of feeding trial was showed in Table 2-4. The results revealed significant increase in total immunoglobulin level in fish fed the KH diet compare to the control diet. Also, significantly higher MPO and SOD activities were found in fish fed the SH diet. However, NBT and lysozyme activities were not significantly different among the groups.
38
Table 2-4. Non-specific immune parameters of olive flounder fed the four experimental diets for 5 weeks. Diet Con KH SH TH NBT1 (absorbance) 1.05±0.08 1.04±0.07 1.07±0.03 1.02±0.07 Ig2 (mg mL-1) 8.8±3.6b 16.7±3.9a 12.5±2.2ab 14.6±2.4ab Lysozyme3 (µg mL-1) 21.1±3.0 24.3±3.9 23.0±4.7 23.3±10.3 MPO4 (absorbance) 1.70±0.16b 2.21±0.31ab 2.43±0.13a 2.02±0.41ab SOD5 (% inhibition) 56.2±2.2b 60.1±1.5ab 74.7±9.8a 71.4±8.1ab
Values are mean of triplicate groups and presented as mean ± SD. Values in the same row having different superscript letters are significantly different (P<0.05). The lack of superscript letter indicates no significant differences among treatments.
1
Nitro blue tetrazolium activity
2 Immunoglobulin 3 Lysozyme activity 4 Myeloperoxidase level 5 Superoxide dismutase
39 3.2.4. Challenge test
The result of challenge test against S. iniae is shown in Fig 2-1. The first mortality was observed on the second day after the bacterial injection. Dramatic mortality revealed in the control fish group on the sixth day of the challenge. After 22 days of challenge test, the survival was significantly higher in fish fed KH and TH diets compared to that of fish fed the control diet. Numerically higher survival showed in the fish fed the SH diet compare to that of fish groups fed the control diet, however difference was not statically significant.
Figure 2-1. Survival rate of olive flounder fed the four experimental diets after challenge with Streptococcus iniae.
40
4.2. DISCUSSION
Although the experiment was stopped at fifth weeks of the feeding trial due to the natural epidemic disease outbreak, the growth performance and feed utilization of olive flounder were influenced by dietary supplementation of the protein hydrolysates. The observed results showed significantly higher growth performance and feed utilization in fish groups fed the SH diet. Similar results were achieved by Zheng et al. (2012a) with the same species where the best growth and feed efficiency were obtained with ultrafiltered fraction of the fish hydrolysate. They reported that the presence of some small molecular weight compounds in fish protein hydrolysate might be essential for maximum growth performance and feed utilization in olive flounder. In the current study, feed intake of olive flounder was not affected by dietary treatments. The result was in accordance with previous study in the same fish species reported by Zheng et al. (2012a). Similar results were obtained in Atlantic cod and red seabream (Aksnes et al., 2006a; Bui et al., 2014). These authors concluded that the higher growth performance and feed utilization responses may relate to low molecular weight compounds which easy to assimilate and quickly cross the intestine membrane leading to an improved feed efficiency and a faster growth.
Whole-body composition of fish was significantly affected by the three different types of the protein hydrolysates. Significant difference in whole-body protein contents was reported for the same species by Zheng et al. (2012a). These authors found that dietary inclusion of higher dose of ultrafiltered fraction of fish hydrolysate was able to effectively increase the whole-body protein whereas lower dose of ultrafiltered fraction failed to increase it. Similar results were reported by the same authors for juvenile turbot (Scophthalmus maximus L.) in a similar study (Zheng et al. 2012b). However, we did not
41
find any significant difference in whole-body composition of red seabream in our previous study with the same protein hydrolysates (Bui et al., 2013). Also, Aksnes et al. (2006b) did not find any significance in whole-body composition of rainbow trout fed diets containing fish protein hydrolysates. The results show that the effects of protein hydrolysates on whole body compositions may relate to several factors including the fish species under study.
Disease outbreak occurred during the feeding trial time leading to low fish survival. Although no significant difference revealed, remarkably higher survival rates were found in fish groups fed diets containing the tested hydrolysates. This phenomenon may relate to the enhancement of non-specific immune responses found in this study. The innate immune parameters revealed significant increase in immunoglobulin level in fish fed the KH diet. MPO and SOD activities were significantly elevated in fish offered the SH diet. There were several reports about biologically active peptides with immuno-stimulating and antibacterial properties being produced during the hydrolysing procedure (Bogwald et al., 1996; Gildberg et al., 1996; Harnedy and FitzGerald, 2012; Chalamaiah et al., 2012). These authors believed that the immunostimulatory effects of protein hydrolysates in fish may suggest them as potential dietary ingredients for increasing disease resistance of farmed fish. Saikai (1999) also reported that there is correlation between the activation of immunity parameters and the increasing protection against infectious disease. In the current study, the same trend for survival rate during feeding trial time was found in the challenge test against S. iniae where significantly higher disease resistance against S. iniae exhibited in the fish groups offered the KH and TH diets.
In conclusion, growth performance and feed utilization of juvenile olive flounder were improved by the supplementation of shrimp hydrolysate powder. Whole-body compositions, non-specific immune response and disease resistance were positively affected by the tested hydrolysates, particularly krill hydrolysate concentrate and shrimp hydrolysate
42
powder. Further studies with longer feeding time are needed to be conducted to verify the beneficial effects and optimum level supplementation of each protein hydrolysate in the fish and other fish species.
43
5. REFERENCES
Abdul Kader, Md., Koshio, S., Ishikawa, M., Yokoyama, S., Bulbul, M., Honda, Y., Mamauag, R.E., Laining, A., 2011. Growth, nutrient utilization, oxidative condition, and element composition of juvenile red sea bream Pagrus major fed with fermented soybean meal and scallop by-product blend as fishmeal replacement. Fisheries Science 77, 119-128.
Aksnes, A., Hope, B., Høstmark, ø., Albrektsen, S., 2006a. Inclusion of size fractionated fish hydrolysate in high plant protein diets for Atlantic cod, Gadus morhua. Aquaculture 261, 1102-1110.
Aksnes, A., Hope, B., JÖ nsson, E., BjÖ rnsson, B.T., Albrektsen, S., 2006b. Size-fractionated fish hydrolysate as feed ingredient for rainbow trout (Oncorhynchus mykiss) fed high plant protein diets. I: Growth, growth regulation and feed utilization. Aquaculture 261, 305-317.
Anderson, D.P., Siwicki, A.K., 1995. Basic haematology and serology for fish health programs. In: Shariff, M., Arthur, J.R., Subasinghe, R.P. (Eds.), Diseases in Asian aquaculture II. Asian Fisheries Society, Manila: Philippines fish health section. pp. 185-202.
AOAC (Association of Official Analytical Chemists), 1995. Official Methods of Analysis. 16thedn. Association of Official Analytical Chemists, Arlington, Virginia, USA. Aoki, T., Takahashi, A., 1987. Class D tetracycline resistance determinants of R plasmids
from the fish pathogens Aeromonas hydrophila, Edwardsiella tarda, and Pasteurella piscicida. Antimicrobial agents and chemotherapy 31, 1278-1280.
44
Aoki, T., Kitao, T., Fukudome, M., 1989. Chemotherapy against infection with multiple drug resistance strains of Edwardsiella tarda in cultured eels. Fish Pathology 24, 161-168. BØgwald, J., Dalmo, R.A., Leifson, R.M., Stenbern, E., GildBerg, A., 1996. The stimulatory
effect of a muscle protein hydrolysate from Atlantic cod, Gadus morhua L. on Atlantic salmon, Salmo salar L., head kidney leucocytes. Fish & shellfish Immunology 6, 3-16.
Brown, B.A., 1980. Routine hematology procedures. In: Brown, B.A. (Eds.), Hematology, principles and procedures, Lea and Febiger, Philadelphia, Pennsylvania, USA, pp. 71-112.
Bui, H.T.D., Khosravi, S., Fournier, V., Herault, M., Lee, K. J., 2014. Growth performance, feed utilization, innate immunity, digestibility and disease resistance of juvenile red seabream (Pagrus major) fed diets supplemented with protein hydrolysates. Aquaculture 418-419, 11-16.
Cahu, C.L., Zambonino Infante, J.L., Quazuguel, P., Le Gall, M.M., 1999. Protein hydrolysate vs. fish meal in compound diets for 10-day old sea bass Dicentrarchus labrax larvae. Aquaculture 171, 109-119.
Chalamaiah, M., Dinesh kumar, B., Hemalatha, R., Jyothirmayi, T., 2012. Fish protein hydrolysates: Proximate composition, amino acid composition, antioxidant activities and applications: A review. Food Chemistry 135, 3020-3038.
Cho, C.Y., Slinger, S.J., Bayley, H.S., 1982. Bioenergetics of salmonid fishes: energy intake, expenditure and productivity. Comparative Biochemistry and Physiology 73B, 25-41. Divakaran, S., Obaldo, L.G., Forster, I.P., 2002. Note on the methods for determination of
chromic oxide in shrimp feeds. Journal of Agricultural and Food Chemistry 50, 464-467.
45
Ellis, A.E., 1990. Serum antiprotease in fish. In: Stolen, J.S., Fletcher, T.C., Anderson, D.P., Roberson, W.B., Van muiswinker, W.B. (Eds.), Techniques in Fish Immunology. SOS Publication, Fair Haven, U.S.A. pp. 95-99.
Espe, M., Sveier, H., Høgøy, I., Lied, E., 1999. Nutrient absorption and growth of Atlantic salmon (Salmo salar L.) fed fish protein concentrate. Aquaculture 174, 119 -137. FAO, 2010. Fisheries and aquaculture department, Fishery information, Data and statistics
Unit. [Internet document] URL Available at
www.fao.org/fi/statist/FISOFT/FISHPLUS.asp (accessed December 2010).
Foh, M.B.K., Kamara, M.T., Amadou, I., Foh, B.M., Wenshui, X., 2011. Chemical and physicochemical properties of tilapia (Oreochromis niloticus) fish protein hydrolysate and concentrate. International Journal of Biological Chemistry 5, 21-36. Gildberg, A., 1993. Enzymic processing of marine raw materials. Process Biochemistry 28,
1-15.
Gildberg, A., Bøgwald, J., Johansen, A., Stenverg E., 1996. Isolation of acid peptide fractions from a fish protein hydrolysate with strong stimulatory effect on Atlantic salmon (Salmo salar) head kidney leucocytes. Comparative Biochemistry and Physiology 114B, 97-101.
Gildberg, A., Stenberg, E., 2001. A new process for advanced utilisation of shrimp waste. Process Biochemistry 36, 809-812.
Guérard, F., Dufossé, L., De La Broise, D., Binet, A., 2001. Enzymatic hydrolysis of proteins from yellowfin tuna (Thunnus albacares) wastes using Alcalase. Journal of Molecular Catalysis B: Enzymatic 11, 1051-1059.
Hardy, R.W., 1991. Fish hydrolysates: production and use in aquaculture feeds. In: Akiyama, D.M., Tan, R.K.H. (Eds.), Proceeding of the Aquaculture Feed Processing and Nutrition Workshop. American Soybean Association, Singapore, pp. 109-115.
46
Harnedy, P.A., FitzGerald, R.J., 2012. Bioactive peptides from marine processing waste and shellfish: A review. Journal of functional foods 4, 6-24.
Hermannsdottir, R., Johannsdottir, J., Smaradottir, H., Sigurgisladottir, S., Gudmundsdottir, B.K., Bjornsdottir, R., 2009. Analysis of effects induced by a pollock protein hydrolysate on early development, innate immunity and the bacterial community structure of first feeding of Atlantic halibut (Hippoglossus hippoglossus L.) larvae. Fish & Shellfish Immunology 27, 595-602.
Heu, M.S., Kim, J.S., Shahidi, F., 2003. Components and nutritional quality of shrimp processing by-products. Food Chemistry 82, 235-242.
Hevrøy, E.M., Espe, M., Waagbø, R., Sandnes, K., Ruud, M., Hemre, G.I., 2005. Nutrient utilization in Atlantic salmon (Salmo salar L.) fed increased levels of fish protein hydrolysate during a period of fast growth. Aquaculture nutrition 11, 301-313. Hultmark, D., Steiner, H., Rasmuson, T., Boman, H.G., 1980. Insect immunity: purification
and properties of three inducible bactericidal proteins from hemolymph of immunized pupae of Hyalophoracecropia. European Journal of Biochemistry 106, 7-16.
INFOFISH (1991) Shrimp Waste Utilization, INFOFISH, technical handbook series 4, kuala lampur, Malayasia.
Ji, S.C., Takaoka, O., Jeong, G.S., Lee, S.W., Ishimaru, K., Seoka, M., Takii, K., 2007. Dietary medicinal herbs improve growth and some non-specific immunity of red sea bream Pagrus major. Fishery science 73, 63-69.