CT
팬텀 영상에서 관전압
,
관전류 변화에 따른 선량비교
문일봉1· 곽종길2,3· 류영환4· 성호진5· 구은회6· 동경래1,*1광주보건대학교 방사선과, 2동신대학교 보건의료학과, 3KS 병원 종합건진센터,
4서울의료원 영상의학과, 5전남대학교병원 영상의학과, 6청주대학교 방사선학과
Dose Comparison according to the Tube voltage,
the Tube Current Change in CT image
Il-Bong Moon
1, Jong-Gil Kwak
2,3, Young-Hwan Ryu
4, Ho-Jin Sung
5,
Eun-Hoe Goo
6and Kyung-Rae Dong
1,*
1Department of Radiological Technology, Gwangju Health University, 73, Bungmun-daero, 419 Beon-gil, Gwangsan-gu, Gwangju 62271, Republic of Korea
2Department of Public Health and Medicine, Dongshin University Graduate School, 185, Geonjae-ro, Naju-si, Jeollanam-do 58245, Republic of Korea
3Comprehensive medical examination center, KS Hospital, 220, Wangbeodeul-ro, Gwangsan-gu, Gwangju 62248, Republic of Korea
4Department of Radiology, Seoul Medical Center, 156, Sinnae-ro, Jungnang-gu, Seoul 02053, Republic of Korea
5Department of Radiology, Chonnam National University Hospital, 42, Jebong-ro, Dong-gu, Gwangju 61469, Republic of Korea
6Department of Radiological Science, Cheongju University, 298, Daeseong-ro, Cheongwon-gu, Cheongju-si, Chungcheongbuk-do 28503, Republic of Korea
Abstract - Recently, as the phenomenon of radiation exposure gain high medical interest, an effort to reduce the dose of radioactivity resulted in the development of Auto Exposure Control Mode(AEC). In the study above, a test for efficiency and reliability of AEC, has been researched through the application of Rondo phantom and SIEMENS CT equipment used in C univeristy to ACE care KV and Care dose 4D. CTDIvol which Indicators of average radiation dose scan volume in units, The total dose values DLP, The Effective mAs which value weighted according to each organ are measured to compare comparison by part when the tube current and tube voltage are manual(Fixed), when only the tube current are automatic(Care dose 4D), when the tube current and tube voltage are all automatical. The values of DLP has decreased in case of Neck, in care dose 4D 26.98%, Mixed 32.32%, in case of Chest, in care dose 4D 4.21%, Mixed 4.56% than Fixed. And the values has decreased equally in case of Abdomen, care dose 4D 45.23%, Mixed 45.23% than Fixed. When only the tube current are automatic, dose reduction is warranted, but when the tube current and tube voltage are all automatical, dose was slightly lower than what we expected.
Key words : AEC, CTDIvol, DLP, Effective mAs
─ 277 ─ Technical Paper
* Corresponding author: Kyung-Rae Dong, Tel. +82-62-958-7668, Fax. +82-62-958-7669, E-mail. krdong@hanmail.net
서 론
100세 시대라고 불리는 만큼 현대의학은 많이 발전하였 고 건강에 대한 관심은 높아지고 있다. 건강이 우리에게 빼 놓을 수 없는 중요한 요소가 됨에 따라 건강검진 및 병변 진단에 쓰이는 CT 검사의 사용빈도는 증가하고 있는 추세 이다(Kim et al. 2013). 그러나 이러한 진단영역 전산화 단층촬영장치(Computed tomography; CT)의 의료피폭에 의해 유도된 발암이 있을 수 있다는 보고와 몇 년 전 원전 사고로 인한 방사능 유출 에 대해 보고된 내용들로 인해 일반인들의 방사선에 대한 불안감과 거부감이 커지고 의료 피폭에 대한 신뢰성을 의 심하게 되었다. 우리나라는 방사선에 대한 두려움과 공포만 있을 뿐 이에 대한 경각심이 적어 과다한 의료 방사선 피폭 이 이루어진다는 지적이 나오고 있는 상황이다. 최근 CT장 비는 시간단축과 더 넓은 범위를 검사할 수 있다는 장점으 로 임상에서 사용횟수가 증가하고 있지만, 검사를 통한 피 폭선량이 상당히 높은 수준이라 병원에서 환자에 대한 체계 적인 선량관리가 민감한 사항으로 다뤄지고 있다(Moon et al. 2017). 이러한 동향에 맞추어 선량감소를 위한 노력으로 환자의 크기, 모양을 고려해 방사선량을 자동적으로 조절할수 있는 자동노출제어장치(Auto Exposure Control mode;
AEC)가 등장하였는데 관전류를 제어하는 방법(Automatic
tube current modulation; ATCM)과 관전압을 제어하는 방법 (Automatic tube voltage selection; ATVS)이 있다. 수동노출
방법은 한번 설정한 관전류, 관전압으로 변화 없이 일정한
조건으로 정해진 범위를 검사하는 반면 자동노출제어장치 를 사용하면 인체의 굵기 등을 센서로 감지하여 그에 맞춘 조건으로 X선을 조사할 수 있다(Bischoff et al. 2009; Lee et
al. 2014; Ha et al. 2015; Moon et al. 2016). 이의 일환으로
저 관전압 방법이 대두되고 있으며, 일반적으로 방사선 선
량은 일정한 관전류를 유지한다면 관전압의 제곱에 비례하 므로 적절한 관전압의 조절이 환자의 피폭선량에 중요한 인
자이다(Abada et al. 2006; Hausleiter 2010). 하지만 저 관전 압일수록 피폭선량은 줄어듦과 동시에 노이즈의 증가라는 치명적인 약점을 가지고 있기 때문에 적절한 관전압의 사용 이 요구된다. 이에 본 연구는 ATVS, ATCM 사용을 통해 환 자가 받게 되는 선량 값이 수동설정으로 촬영했을 때 선량 에 어떠한 차이점이 있는지 알아보고자 하였다.
재료 및 방법
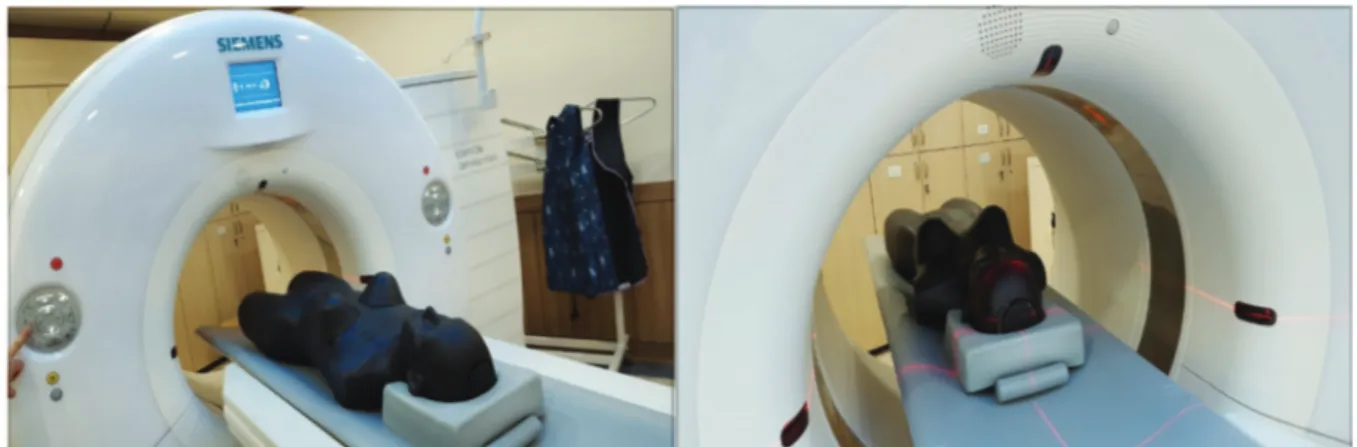
1. 검사방법 CT 장비는 광주에 위치한 일개 종합병원에서 사용되고 있는 S사의 Somatom Definition Flash(Germany), 인체 모 형인 Rando phantom(Art-20x fluke biomedical, USA)을 SIEMENS의 CARE kV, Care dose 4D를 이용하여 각 부위 별(Neck, Chest, Abdomen) 관전압, 관전류 자동 조절기법의 사용 유무에 따른 선량 변화를 조사하였다(Fig. 1).2. 검사조건
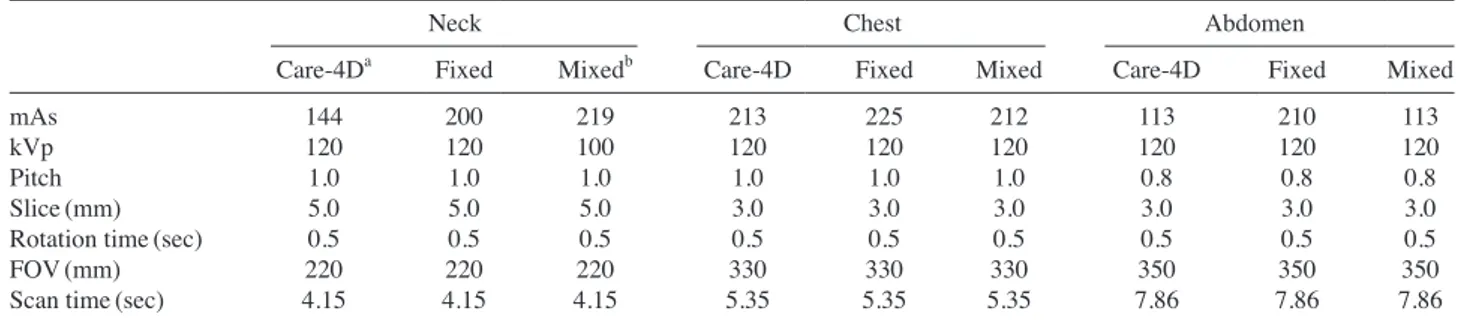
기본 조사 조건은 Neck의 care dose 4D 경우 mAs 144, kVp 120, Fixed의 경우 mAs 200, kVp 120, Mixed의 경 우 mAs 219, kVp 100이며 Pitch는 1.0, Slice는 5.0mm, Rotation time은 0.5 sec FOV는 220mm, Scan time은 4.15 sec로 동일하게 하였다. Chest의 care dose 4D 경우 mAs 213kVp 120, Fixed의 경우 mAs 220kVp 120 Mixed의 경 우 mAs 212, kVp120이며 Pitch는 1.0, Slice는 3.0mm, Rotation time은 0.5 sec FOV는 330mm, Scan time은 5.35 sec로 동일하게 하였고 Abdomen의 care dose 4D 경우 mAs 113, kVp 120, Fixed의 경우 mAs 210, kVp 120 Mixed의 경우 mAs 113, kVp 120이며 Pitch는 0.8, Slice는 3.0mm, Rotation time은 0.5 sec FOV는 350 mm Scan time은 7.86 sec으로 동일하게 하였다(Table 1).
3. 측정방법 관전류 자동 조절기법의 사용 유무에 따라 단위 스캔 부 피 내의 평균 방사선량을 나타내는 지표 CTDIvol 값과 피 사체에 조사된 모든 영상에 대한 총 선량 값 DLP(Dose length product), 각각의 장기들에 피폭된 방사선량에 가중 치가 적용된 값인 유효선량(Effective dose)을 측정하였다. CTDIvol은 조직의 평균 조사선량을 측정할 수 있도록 하 지만, DLP는 일련의 스캔에 대한 조사선량을 측정할 수 있도록 한다. 방사선에 노출된 체적의 길이(스캔 길이)와 CTDIvol을 알 수 있다면, 아래와 같은 공식을 이용해 DLP 를 계산할 수 있다(Eq. 1).
DLP=CTDIvol*Scan length (1)
Effective dose는 mSv로 나타내며 방사선에 의한 확률적
인 위험요소를 나타내고 DLP와 컴퓨터 시뮬레이션이나 실
제 측정에서 얻어진 가중치(Conversion Factor, f)를 곱함으 로써 예측할 수 있다. European Commission에 보고된 가중 치 값은 아래와 같다(Table 2)(Heyer et al. 2007).
결 과
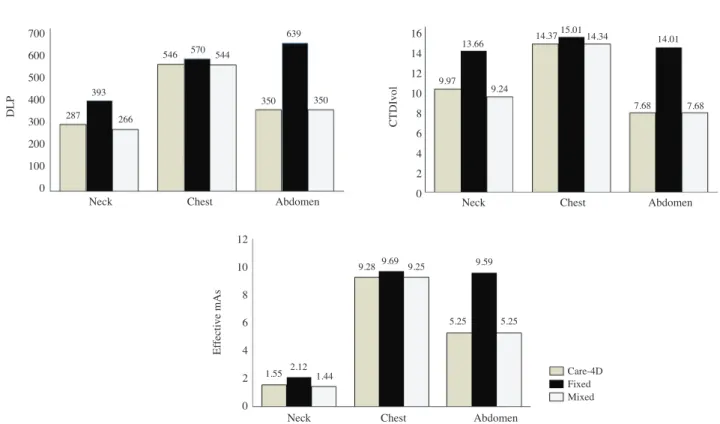
각 장비별로 모두 관전류 자동조절기법을 사용하였 을 때 단위 스캔 부피 내의 평균 방사선량을 나타내는 지 표 CTDVol 값은 Care dose 4D, Fixed, Mixed 순으로 Neck 9.97, 13.66, 9.24가 나왔고, Chest는 14.37, 15.01, 14.34, Abdomen은 7.68, 14.01, 7.68이 나왔다. 피사체에 조사된 모든 영상에 대한 총 선량 값 DLP(Dose length product)는 Care dose 4D, Fixed, Mixed 순으로 Neck 287, 393, 266이 나왔고 Chest는 546, 570, 544, Abdomen은 350, 639, 350 이 나왔다. 유효선량(Effective mAs)은 E=DLP * f의 공식 으로 Neck은 f값 0.0054, Chest 0.017, Abdomen은 0.015를 대입하여 계산하였고 그 결과 Neck은 Care dose 4D, Fixed, Mixed 순으로 각각 1.55, 2.12, 1.44가 나왔고, Chest는 각 각 9.28, 9.69, 9.25, Abdomen은 5.25, 9.59, 5.25의 값이 나
왔다. 각 조사방법으로 선량감소를 비교해봤을 때 DLP
(dose length product)는 fixed를 기준으로 Neck의 경우 care dose 4D가 26.98%, Mixed가 32.32% 감소하였고, Chest의 경우 care dose 4D가 4.21%, Mixed가 4.56% 감소하였고, Abdomen의 경우 care dose 4D와 Mixed가 45.23%로 동일 하게 감소되었다(Tables 3, 4)(Fig. 2).
고 찰
방사선 검사 및 치료 등 방사선 사용량이 증가함에 따 라 피폭선량의 위험성이 대두되고 있다. 이에 발맞추어 환 자의 피폭선량을 줄이는 것에 초점을 맞춘 소프트웨어적인 측면의 발전이 이루어졌다. 그 결과 최근 CT에는 모두 관 전류 자동조절기법, 관전압자동조절기법 시스템이 개발되 었으며, 이것은 저 피폭량으로 보다 정확한 영상정보를 얻 는 데 있어 기본 요구조건이 되었다. 관전류 자동기법이 선 량이 미치는 영향을 다룬 Moon의 CT 검사 시 관전류 자동 조절기법이 선량에 미치는 영향 연구에 따르면(Moon et al. 2016) 관전류 자동 조절기법을 사용했을 때 단위 스캔 부 피 내의 평균 방사선량을 나타내는 지표 CTDIVol 피사체 에 조사된 모든 영상의 대한 총 선량 값 DLP가 S사의 경 우 Neck 3.3%, Chest 25.5%, Abdomen 16% 감소, 유효선량 은 S사의 경우 Neck 47.5%, Chest 47.5, Abdomen 26.8%로감소되었다고 하였다. 또한 이에 따라 자동노출제어장치를
사용하면 수동노출장치를 사용했을 때보다 환자피폭을 감 소시키는 것을 알 수 있었으며 영상 품질에 영향을 끼칠 거
Table 1. Comparison of CT Parameters by CT Scanner
Neck Chest Abdomen
Care-4Da Fixed Mixedb Care-4D Fixed Mixed Care-4D Fixed Mixed
mAs 144 200 219 213 225 212 113 210 113
kVp 120 120 100 120 120 120 120 120 120
Pitch 1.0 1.0 1.0 1.0 1.0 1.0 0.8 0.8 0.8
Slice(mm) 5.0 5.0 5.0 3.0 3.0 3.0 3.0 3.0 3.0
Rotation time(sec) 0.5 0.5 0.5 0.5 0.5 0.5 0.5 0.5 0.5
FOV(mm) 220 220 220 330 330 330 350 350 350
Scan time(sec) 4.15 4.15 4.15 5.35 5.35 5.35 7.86 7.86 7.86
aCare dose 4D(mA dose modulation), bMixed : Care kV+Care dose 4D
Table 2. Effective Dose of European Commission Guideline(E= DLP * f)
Region of body Conversion factor. f(mSv)
Head 0.0023
Neck 0.0054
Chest 0.017
Abdomen 0.015
라는 예상과 달리 영상의 잡음이 증가하거나 감소하는 등 의 변화는 보이지 않았고 영상 품질은 그대로 유지한 채 선
량만 감소되었으므로 ACE 기법은 영상품질의 우수함을 유
지하면서 불필요한 피폭선량을 감소하는 데 매우 유용하며 환자에게 있어 건강의 질을 높이고 방사선 피폭에 대한 불 안감을 줄여줄 것이라고 하였다(Shin et al. 2007; Seo 2008; SIEMENS 2009; Yoo et al. 2010; Kim and Seoung 2012; Lee et al. 2014; Moon et al. 2016). 본 연구에서는 S사의 CT 검사 시 동일한 조건 하에 Rando phantom과 최신 CT 장비 를 이용하여 관전압과 관전류의 자동노출조절방법과 수동 노출조절방법을 사용했을 때 각 부위별 피폭선량과 영상 의 차이를 관찰하고 임상에서의 유용성을 평가하였으며 한 번 고정된 값을 바꿀 수 없어 모든 두께에 같은 량이 조사 되는 수동조절기법에 비해 두께에 따라 자동으로 다른 선 량을 조절해주는 자동조절기법에서의 피폭선량이 더 낮을 것이라는 예상을 하며 실험을 시작하였고 연구결과 DLP의 값은 Fixed를 기준으로 했을 때 Neck의 경우 care dose 4D 가 26.98%, Mixed가 32.32% 감소하였고, Chest의 경우 care dose 4D가 4.21%, Mixed가 4.56% 감소하였고, Abdomen의 경우 care dose 4D와 Mixed가 45.23%로 동일하게 감소되 었다. 그러나 관전류 자동조절기법(Care dose 4D)만 사용했 을 때와 관전류, 관전압을 모두 자동으로 조절해주는 자동 조절기법을 사용했을 때의 차이는 예상보다 미미하였고 수 동조절기구 이용보다 자동 조절 기구를 이용 시 더 낮은 선
량을 나타내는 것을 확인할 수 있었다.
Table 4. DLP reduction rate of Care-4D, Fixed and Mixed
depend-ing on the region
DLP reduction ratio Neck Chest Abdomen
Fixed & Care dose 26.98 4.21 45.23
Fixed & Mixed 32.32 4.56 45.23
Table 3. Comparison of Radiation by examination
Neck Chest Abdomen
Care-4Da Fixed Mixedb Care-4D Fixed Mixed Care-4D Fixed Mixed
CTDIvol 9.97 13.66 9.24 14.37 15.01 14.34 7.68 14.01 7.68
DLP 287 393 266 546 570 544 350 639 350
Effective mAs 1.55 2.12 1.44 9.28 9.69 9.25 5.25 9.59 5.25
aCare dose 4D(mA dose modulation), bMixed : Care kV+Care dose 4D
Fig. 2. Comparison of DLP, CTDIvol and Effective mAs by examination.
700 600 500 400 300 200 100 0
Neck Chest Abdomen
Care-4D Fixed Mixed
Neck Chest Abdomen
Neck Chest Abdomen
16 14 12 10 8 6 4 2 0 12 10 8 6 4 2 0 DLP Ef fective mAs CTDIvol 287 9.97 1.55 393 13.66 14.37 15.01 14.34 7.68 14.01 7.68 2.12 266 9.24 1.44 546 9.28 570 9.69 544 9.25 350 5.25 639 9.59 350 5.25
결 론
본 연구에서는 수동조절장치와 관전류 자동장치 그리고 관전압 관전류 자동장치에 따라 부위별로 CTDIvol, DLP, mSv를 팬텀으로 실험해 알아보고자 했다. 관전류 자동조절 기구인 Care dose 4D로 Neck 관찰 시 CTDIVol 9.97, DLP 287, EmAs 1.55의 수치가 나왔으며 fixed로 Care dose 4D 로 Neck 관찰 시 CTDIVol 13.66, DLP 393, EmAs 2.12가 나왔다. Mixed(care kV +care dose 4D)로 Neck 관찰 시 CTDIVol 9.24, DLP 266, EmAs 1.44의 결과가 나왔다. 관전 류 자동조절만 사용했을 경우 선행연구결과에서 나왔듯이 확실한 차이로 선량이 감소하였다. 그러나 관전류를 자동으 로 조절하였을 때 현저한 차이가 난 만큼 관전압도 자동으 로 조절하게 되면 더 많은 차이가 날 것이라고 예상한 것에 비해 관전류, 관전압을 둘 다 자동으로 조절했을 때의 선량 감소율은 비교적 미미한 차이를 나타내었다.
사 사
This work was supported by the Nuclear Safety Research Program through the Korea Radiation Safety Foundation (KORSAFe) and the Nuclear Safety and Security Commis-sion(NSSC), Republic of Korea(Grant No. 1305033).
참 고 문 헌
Abada HT, Larchez C, Daoud B, Sigal-Cinqualbre A and Paul JF. 2006. MDCT of the coronary arteries: feasibility of low-dose CT with ECG-pulsed tube current modulation to reduce radiation dose. Am. J. Roentgenol. 186(6):387-390. Bischoff B, Hein F, Meyer T, Hadamitzky M, Martinoff S,
Schomig A and Hausleiter J. 2009. Impact of a reduced tube voltage on CT angiography and radiation dose: results of the PROTECTION I study. JACC Cardiovasc. Imaging 2(8):940-946.
Ha SM, Jung SH, Chang HJ, Park EA and Shim HJ. 2015. Effects of Iterative Reconstruction Algorithm, Automatic Exposure Control on Image Quality, and Radiation Dose: Phantom Experiments with Coronary CT Angiography Protocols. Prog. Med. Phys. 26(1):28-35.
Hausleiter J, Martinoff S, Hadamitzky M, Martuscelli E, Pschierer I, Feuchtner GM, Catalan-Sanz P, Czermak B, Meyer TS, Hein F, Bischoff B, Kuse M, Schömig A and
Achenbach S. 2010. Image quality and radiation exposure with a low tube voltage protocol for coronary CT angiog-raphy results of the PROTECTION II Trial. JACC
Cardio-vasc. Imaging 3(11):1113-1123.
Heyer CM, Mohr PS, Lemburg SP, Peters SA and Nicolas V. 2007. Image quality and radiation exposure at pulmonary CT angiography with 100- or 120-kVp protocol: prospec-tive randomized study. Radiology 245(2):577-583.
Huh JY, Bhum HN, Jung JB, Kim CG and Sun JB. 2008. A Study on the Reduction of Radiation Dose When Examin-ing Coronary Artery through CT Tube Current Modulation Employing 64VCT. J. Korea Soc. Comput. Tomogr.
Tech-nol. 10(1):41-45.
Kim HJ, Moon IB, Han JB, Choi NG and Jang SJ. 2013. Eval-uation of Radiation Dose and Image Quality Between Manual and Automatic Exposure Control Mode According to Body Mass Index in Cardiac CT. J. Korea Cont. Assoc. 13(4):291-299.
Kim YO and Seoung YH. 2012. A Study on Various Automat-ic Exposure Control System in Multi-Detector Computed Tomography by Using Human Phantom. J. Korea Acad.
Indus. Cooper. Soc. 13(4):1714-1720.
Lee HJ, Kim HS, Lim KB, Kang SH and Lim JS. 2014. The study on functions of Automatic and semi-Automatic in Automatic Tube Voltage Selection software. J. Korea Soc.
Comput. Tomogr. Technol. 16(2):139-150.
Moon IB, Dong KR and Kim KC. 2016. The Impact of the AEC Mode of Tube Current on the Dose at CT Scans. J.
Radia. Ind. 10(2):49-54.
Moon IB, Dong KR, Kim MH, Choi SH, Kweon DC and Goo EH. 2017. Measurement of the Noise according to the Slice Thickness in MDCT. J. Radia. Ind. 11(3):151-155.
Seo JY. 2008. A study of appropriate expose condition in Chest CT for Care Dose 4D. J. Korea Soc. Comput. Tomogr.
Technol. 10(1):123-128.
Shin SB, Shin SK, Lee DK and Kim MC. 2007. The choice op-timal X-ray exposure factors in pediatric body CT. J. Korea
Soc. Comput. Tomogr. Technol. 9(1):55-61.
SIEMENS. 2009. Dose Information - CT Essentials.
Yoo HJ, Cheong SM and Suh DS. 2010. Radiation Do se and Image Quality in Neck An giography : Comparison of Dual Source Computed T omography and Multi-detector Com-puted Tomography. J. Korea Soc. Comput. Tomogr.
Tech-nol. 12(2):27-32.
Received: 5 November 2017 Revised: 23 November 2017 Revision accepted: 16 December 2017