공학석사 학위논문
증기 폭발에 의한 원자로 하부 헤드의
건전성에 관한 연구
Structural Analysis for the Lower Head of Nuclear Reactor
under In-Vessel Vapor Explosion Loads
지도교수
윤상국
2011 년 2 월
한국해양대학교 대학원
냉동공조공학과 석상군
Content
Abstract ... i
List of Tables ... iii
List of Figures ... iv
1. Introduction ... 1
1.1 The reason to cause failure of reactor vessel ... 1
1.2 Two kinds of failures of reactor vessel ... 1
1.2.1 Alpha-mode containment failure ... 1
1.2.2 Lower head failure ... 1
2. Analysis procedure of lower head failure ... 3
2.1 Introduction ... 3
2.2 Safety assessment process ... 3
2.3 Analysis of in-vessel explosion ... 4
2.4 Analysis method using ANSYS program ... 5
2.4.1 Static analysis of ANSYS ... 6
2.4.2 Transient analysis of ANSYS ... 7
2.5 Failure criteria ... 17
2.5.1 Design criteria ... 17
2.5.2 Structural failure criteria ... 17
2.5.3 Boiling failure criteria ... 18
3.1 Structural analysis of 2-D modeling lower head ... 20
3.1.1 Stress analysis under design condition ... 20
3.1.2 Transient dynamic analysis of explosion load ... 22
3.1.3 Results of simplified 2-D model structural analysis ... 22
3.1.3.1 Stress analysis results under design condition ... 22
3.1.3.2 Transient dynamic analysis of explosion load results ... 23
3.2 Structural analysis of 3-D model lower head ... 41
3.2.1 Stress analysis under design condition ... 41
3.2.2 Transient dynamic analysis of explosion load ... 41
3.2.3 Results of 3-D modeling structural analysis ... 41
3.2.3.1 Stress analysis results under design condition ... 41
3.2.3.2 Transient dynamic analysis of explosion load results ... 42
3.3 Thermal Analysis ... 55
3.3.1 Introduction ... 55
3.3.3 Thermal analysis results ... 56
3.4 Thermo-mechanical analysis for 2-D modeling ... 58
3.4.1 Thermo-mechanical analysis under design condition ... 58
3.4.2 Thermo-mechanical analysis under transient dynamic of explosion load ... 58
3.4.3 Results of thermo-mechanical analysis ... 59
3.4.3.1 Thermo-mechanical analysis results under design condition ... 59
3.4.3.2 Thermo-mechanical analysis results under transient dynamic of explosion load ... 59
4. Conclusion and Future Work ... 73
Structural Analysis for the Lower Head of Nuclear Reactor under
In-Vessel Vapor Explosion Loads
Xi Shangjun
Department of Refrigeration Engineering, Graduate College,
Korea Maritime University
Abstract
The objective of this paper is to assess the lower head of nuclear reactor under the
in-vessel vapor explosion load. Firstly, the calculated explosion pressure loads are applied
on the lower head inner wall for 2-D model and 3-D model, respectively, to calculate the
equivalent strain and membrane stress intensity; secondly, both calculated explosion
pressure loads and thermal loads are imposed on the 2-D model of the lower head to
calculate the equivalent stain, membrane stress intensity, and total mechanical and thermal
strain. Then, the calculated strain and stress results are compared with the reference
standard values of failure criteria to determine the failure probability of the lower head. All
the stain and stress calculations are performed by ANSYS 11.0 Program.
The structure analysis results show that the lower head failure does not exist under the
pressure value up to 118.5 MPa in vessel explosion.
The thermo-mechanical results show that the lower head failure under the pressure
List of Tables
Table 1 Loading data for 2-D model structural analysis under design condition
Table 2 Mechanical properties of material at 260℃ for 2-D model structural analysis
Table 3 Loading data for 2-D model structural analysis under transient explosion
Table 4 Summary of 2-D modeling structural analysis results
Table 5 Summary results of 3-D modeling structural analysis
Table 6 Loading data for thermal analysis
Table 7 Material mechanical proprieties of thermal analysis
Table 8 Loading data for thermo-mechanical analysis under design condition
Table 9 Loading data for thermo-mechanical analysis under transient explosion
List of Figures
Fig. 1 Safety Analysis process of lower headFig. 2 Schematic of reactor vessel
Fig. 4 Top view of lower head
Fig. 5 Schematic of pipe
Fig. 6 Simplified 2-D model of lower head for structural analysis
Fig. 7 Finite element simplified 2-D model of lower head for structural analysis
Fig. 8 3-D Model of lower head for structural analysis
Fig. 9 Finite element 3-D model of lower head for structural analysis
Fig. 10 Simplified 2-D model of lower head for thermal analysis
Fig. 11 Finite element simplified 2-D model of lower head for thermal analysis
Fig. 12 ANSYS element description used in mechanical analysis
Fig. 13 ANSYS element description used in thermo-mechanical analysis
Fig. 14 The result appropriate for quantifying the thermal failure criteria
Fig. 15 Time history of explosion pressure in case of starting explosion at the bottom of head
Fig. 16 Time history of explosion pressure in case of starting explosion at the top of Head
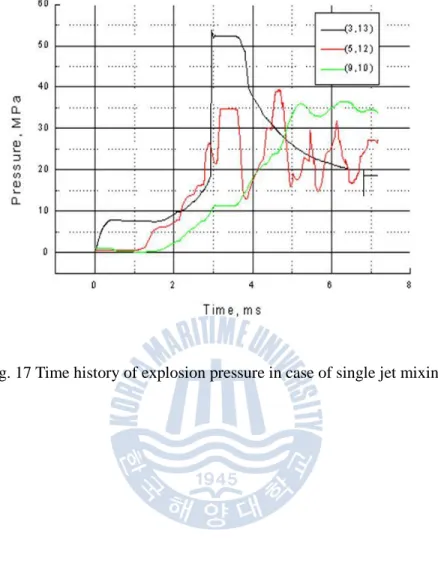
Fig. 17 Time history of explosion pressure in case of single jet mixing
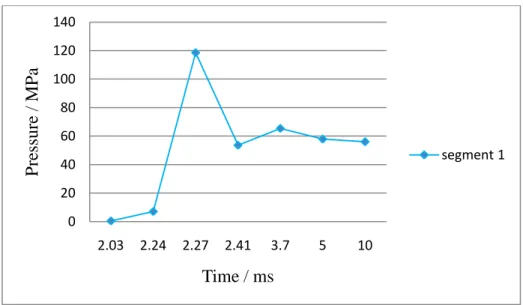
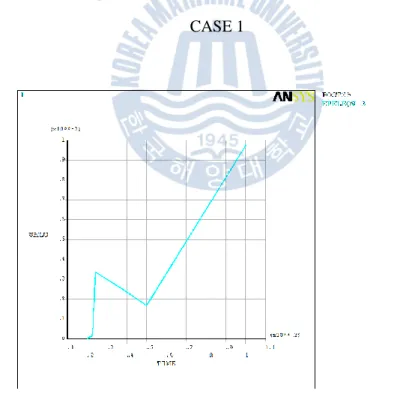
Fig. 18 Input time history of explosion pressure applied uniformly on the whole inside of the head (CASE 1)
Fig. 19 Pressure loaded locations of lower head for CASE 1
Fig. 20 Input time history of explosion pressure applied on 6 segments of inside of the head (CASE 2)
Fig. 21 Pressure loaded locations of lower head for CASE 2
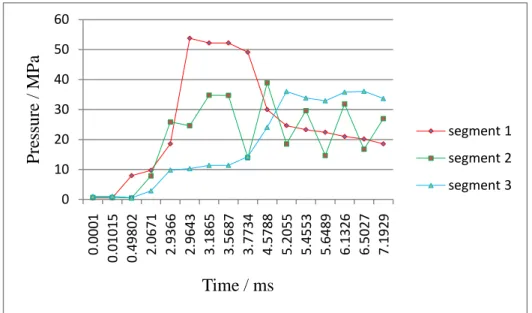
Fig. 22 Input time history of explosion pressure applied uniformly in case of single jet mixing (CASE 3).
Fig. 23 Pressure loaded locations of lower head for CASE 3
Fig. 24 Stress intensity distribution of 2-D model structural analysis under design condition
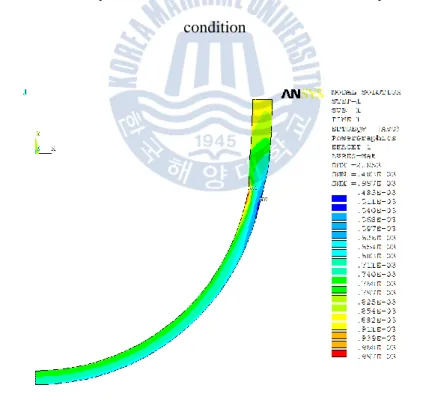
Fig. 25 Equivalent strain distribution of 2-D model structural analysis under design condition
Fig. 26 Path 1 of 2-D model structural analysis under design condition
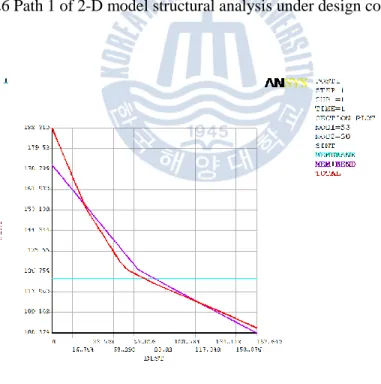
Fig. 27 Membrane and membrane plus bending stress along Path 1 of 2-D model structural analysis under design condition
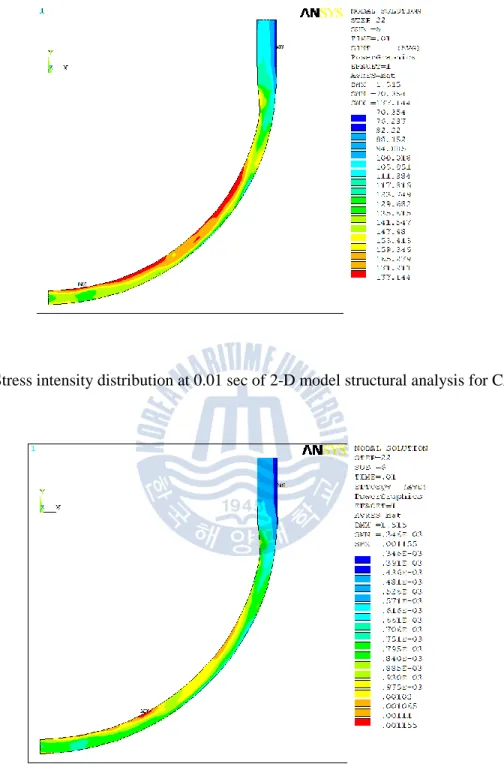
Fig. 28 Stress intensity distribution at 0.01 sec of 2-D model structural analysis for CASE 1
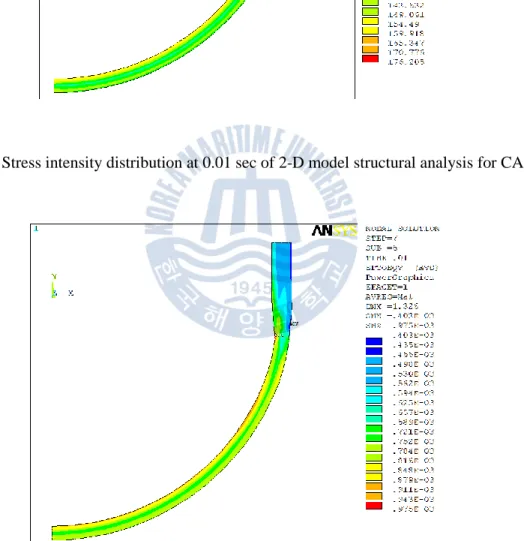
Fig. 29 Equivalent strain distribution at 0.01 sec of 2-D model structural analysis for CASE 1
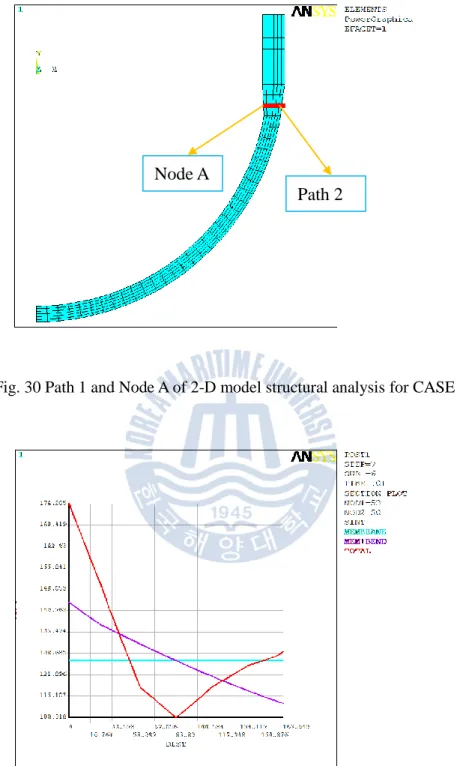
Fig. 30 Path 1 and Node A of 2-D model structural analysis for CASE 1
Fig. 31 Membrane and membrane plus bending stress at 0.01 sec along Path 2 of 2-D model structural analysis fro CASE 1
Fig. 32 Time history of equivalent stress at Node A of 2-D model structural analysis for CASE 1
Fig. 33 Time history of equivalent strain at Node A of 2-D model structural analysis for CASE 1
Fig. 35 Equivalent strain distribution at 0.01 sec of 2-D model structural analysis for CASE 2
Fig. 36 Path 1 and Node A of 2-D model structural analysis for CASE 2
Fig. 37 Membrane and membrane plus bending stress at 0.01 sec along Path 3 of 2-D model structural analysis for CASE 2
Fig. 38 Time history of equivalent stress at Node B of 2-D model structural analysis for CASE 2
Fig. 39 Time history of equivalent strain at Node B of 2-D model structural analysis for CASE 2
Fig. 40 Stress intensity distribution at 0.0072 sec of 2-D model structural analysis for CASE 3
Fig. 41 Equivalent strain distribution at 0.0072 sec of 2-D model structural analysis for CASE 3
Fig. 42 Path 1 and Node A of 2-D model structural analysis for CASE 3
Fig. 43 Membrane and membrane plus bending stress at 0.0072 sec along Path 4 of 2-D model structural analysis for CASE 3
Fig. 44 Time history of equivalent stress at Node C of 2-D model structural analysis for CASE 3
Fig. 45 Time history of equivalent strain at Node C of 2-D model structural analysis for CASE 3
Fig. 46 Stress intensity distribution of 3-D model structural analysis under design Condition
Fig. 47 Equivalent strain distribution of 3-D model structural analysis under design Condition
structural analysis under design condition
Fig. 50 Stress intensity distribution at 0.01 sec of 3-D model structural analysis for CASE 1
Fig. 51 Equivalent strain at 0.01 sec of 3-D model structural analysis for CASE 1
Fig. 52 Path 1 and Node A of 3-D model structural analysis for CASE 1
Fig. 53 Membrane and membrane plus bending stress at 0.01 sec along Path 6 of 3-D model structural analysis for CASE 1
Fig. 54 Time history of equivalent stress at Node D of 3-D model structural analysis for CASE 1
Fig. 55 Time history of equivalent strain at Node D of 3-D model structural analysis for CASE 1
Fig. 56 Stress intensity distribution at 0.01 sec of 3-D model structural analysis for CASE 2
Fig. 57 Equivalent strain distribution at 0.01 sec of 3-D model structural analysis for CASE 2
Fig. 58 Path 1 and Node A of 3-D model structural analysis for CASE 2
Fig. 59 Membrane and membrane plus bending stress at 0.01 sec along Path 1 of 3-D model structural analysis for CASE 2
Fig. 60 Time history of equivalent stress at Node A of 3-D model structural analysis for CASE 2
Fig. 61 Time history of equivalent strain at Node A of 3-D model structural analysis for CASE 2
Fig. 62 Stress intensity distribution at 0.0072 sec of 3-D model structural analysis for CASE 3
Fig. 64 Path 1 and Node A of 3-D model structural analysis for CASE 3
Fig. 65 Membrane and membrane plus bending stress at 0.0072 sec along Path 8 of 3-D model structural analysis for CASE 3
Fig. 66 Time history of equivalent strain at Node F of 3-D model structural analysis for CASE 3
Fig. 67 Time history of equivalent strain at Node F of 3-D model structural analysis for CASE 3
Fig. 68 Temperature distribution of 2-D model of lower head
Fig. 69 Thermal flux distribution of 2-D model of lower head
Fig. 70 Stress intensity distribution of 2-D model thermo-mechanical analysis under design condition
Fig. 71 Total strain distribution of 2-D model thermo-mechanical analysis under design condition
Fig. 72 Path 1 of 2-D model thermo-mechanical analysis under design condition
Fig. 73 Membrane and membrane plus bending stress along Path 9 of 2-D model thermo-mechanical analysis under design condition
Fig. 74 Stress intensity distribution at 0.01 sec of 2-D model thermo-mechanical analysis for CASE 1
Fig. 75 Total strain distribution at 0.01 sec of 2-D model thermo-mechanical analysis for CASE 1
Fig. 76 Path 1 and Node A of 2-D model thermo-mechanical analysis for CASE 1
Fig. 77 Membrane and membrane plus bending stress at 0.01 sec along Path 10 of 2-D model thermo-mechanical analysis for CASE 1
Fig. 78 Time history of equivalent stress at Node G of 2-D model thermo-mechanical analysis for CASE 1
Fig. 79 Time history of equivalent strain at Node G of 2-D model thermo-mechanical analysis for CASE 1
Fig. 80 Stress intensity distribution at 0.01 sec of 2-D model thermo-mechanical analysis for CASE 2
Fig. 81 Total strain distribution at 0.01 sec of 2-D model thermo-mechanical analysis under CASE 2
Fig. 82 Path 1 and Node A of 2-D model thermo-mechanical analysis for CASE 2
Fig. 83 Membrane and membrane plus bending stress at 0.01 sec along Path 11 of 2-D model thermo-mechanical analysis for CASE 2
Fig. 84 Time history of equivalent stress at Node H of 2-D model thermo-mechanical analysis for CASE 2
Fig. 85 Time history of equivalent strain at Node H of 2-D model thermo-mechanical analysis for CASE 2
Fig. 86 Stress intensity distribution at 0.0072 sec of 2-D model thermo-mechanical analysis for CASE 3
Fig. 87 Total strain distribution at 0.0072 sec of 2-D model thermo-mechanical analysis for CASE 3
Fig. 88 Path 1 and Node A of 2-D model thermo-mechanical analysis for CASE 3
Fig. 89 Membrane and membrane plus bending stress at 0.0072 sec along Path 12 of 2-D model thermo-mechanical analysis for CASE 3
Fig.90 Time history of equivalent stress at Node I of 2-D model thermo-mechanical analysis for CASE 3
Fig. 91 Time history of equivalent strain at Node I of 2-D model thermo-mechanical analysis for CASE 3
1. Introduction
1.1 The reason to cause failure of reactor vessel
In the light water reactors, if complete and prolonged failure of normal and emergency
coolant flow occurs, fission product decay heat could cause melting of the reactor fuel. If
the molten fuel mass accumulates it may relocate into reactor lower plenum and if the
lower head fails it may eventually be brought into the fuel-coolant interactions (FCI) arises
as the core melt relocates into water pool in-vessel as well as ex-vessel and also, as a
consequence of implementing accident management strategies involving water addition to
a degraded or molten core[1].
In general, the FCI process involves transfer of heat from the molten fuel to the
surrounding coolant in a time scale ranging from milliseconds range can lead to energetic
vapor explosions which, if enough energetic, may challenge reactor vessel and
containment integrity thereby posing a radiological risk to the environment.
1.2 Two kinds of failures of reactor vessel
1.2.1 Alpha-mode containment failure
If the amount of melt involved in a vapor explosion inside the reactor vessel is large
enough and the resulting energy conversion of the melt heat to mechanical energy is
sufficiently large, the explosion may fail the reactor upper head, throwing it upward,
hitting the containment ceiling, consequently posing a potential risk of releasing failure (α-mode failure). For years reactor safety analysts have studied the probability of the α-mode containment failure and have reached a tentative consensus on that the α-mode
1.2.2 Lower head failure
The in-vessel retention (IVR) strategy, employed in advanced light water reactors
(ALWR) with passive design features, is based upon external cooling of the reactor heat
from the vessel wall thereby assuring its integrity from a combined thermo-mechanical
static loading imparted by the hot core debris inside. To assure the success of the IVR
strategy, the potential for an early failure of the lower head from in-vessel vapor explosions
must be ruled out. Also, one notes that in event the lower head fails, the resulting event
may create an opportunity for the wide spectrum of ex-vessel severe accident phenomena
including direct containment heating and ex-vessel FCI.
This new accident management strategy of in-vessel retention in advanced light water
reactors has directed the risk potential of in-vessel vapor explosions from the α-mode
containment failure to the reactor lower head failure.
The objective of the present study is to perform a safety assessment of the reactor lower
head integrity of nuclear reactor under the potential in-vessel vapor explosion loads. The
initial conditions of melt relocation into the lower plenum were provided by the bounding
2. Analysis procedure of lower head failure
2.1 Introduction
The paper is to develop a methodology for assessing likelihood of lower head failure
under millisecond-duration pressure pulses with peaks in the kilobar range. It is very
important to characterize and understand the dynamics due to axisymmetrically distributed
highly transient loads to strain hardening effects on material constitutive behavior.
2.2 Safety assessment process
The process of the safety assessment of the reactor vessel lower head integrity under
in-vessel vapor explosion is shown in Fig. 1.
obtain the pressure load and thermal load. The structural analysis process is: using the
calculated explosion pressure imposed on the lower head inner wall, strain and stress
calculation were performed using ANSYS program, and then comparing the calculated
value with the allowable failure criteria value to determine the failure probability of the
lower head. The thermal analysis process is: using the calculated explosion temperature
imposed on the lower head inner wall and the convection boundary condition imposed on
the lower head out wall, temperature distribution and heat flux performed using ANSYS
program, then comparing the calculate heat flux value with the allowable boiling failure
criteria value to determine the boiling failure probability. The thermo-structural analysis
process is: using the calculated explosion pressure and the thermal analysis result applied
on the lower head inner wall, total strain (total mechanical and thermal strain ) and stress
were also performed by ANSYS program, then comparing the calculated value with the
allowable failure criteria value to determine the failure probability of the lower head.
2.3 Analysis of in-vessel explosion
To assess the integrity of reactor vessel under in-vessel vapor explosion, the calculation
of pressure produced by vapor explosion is essential firstly.
The purpose of in-vessel vapor explosion analysis is to provide dynamic pressure
impulses imposed on the inner wall of lower head for the strain analysis. In order to
provide a conservative results, two groups of calculations were performed; (1) under the
assumption of uniform premixure throughout the lower plenum, explosion calculations
were performed with the variation of trigger position and magnitude, and fuel and vapor
volume fractions within the range of physically realistic bounds. (2) a single jet melt enters
melt entry.
The calculation of equation pressure were performed using TRACER-Ⅱ code by
professor Bang[1]. Time histories of explosion pressure when explosion starts at the
bottom and top of the lower head in Fig. 15 and Fig. 16 respectively, a time history of
explosion in case if single jet mixing is shown in Fig. 17. In this paper, the calculation
results are used directly.
2.4 Analysis method using ANSYS program
In the paper, two analysis methods are used: static analysis method and transient
analysis method. For static method, design pressure 17.24 MPa is used to analyse, and for
the transient method, three cases explosion dynamic pressure are used anlyse. For
modeling, two models are used to analysis the possibility of lower head failure, one is
simplified 2-D modeling, the another is 3-D modeling. The schematic view of the lower
plenum of nuclear reactor is shown in Fig. 2, the lower plenum is occupied by lower
support structure and in-core instrumentation guide tubes. Fig. 3 is the front view of lower
head, Fig. 4 is the top view of lower head, Fig. 5 is the schematic of support pipe.
In this study, it is assumed that the lower plenum is empty, hemispherical only for the
simplified 2-D modeling, and only the support pipe is considered for the 3-D modeling.
The geometric modeling of the lower head is performed by ANSYS 11.0, for structural
analysis, using PLANE 42 solid element and SOLID 185 element (Fig. 12) to model the
2-D modeling head and 3-D modeling head respectively, as shown in from Fig. 6 to Fig. 9;
for 2- D modeling thermal analysis, using thermal PLANE 55 element (Fig. 13) to model
the lower head, as shown in Fig. 10 and Fig. 11; for 2-D thermo-mechanical analysis, using
PLANE 42 solid element to model the lower head, as shown in Fig. 6 and Fig. 7.
transient pressure for the 2-D modeling; secondly, apply the static pressure and transient
pressure for the 3-D modeling; thirdly, apply the temperature for the 2-D modeling, at last,
apply the thermal result from the thirdly process and the static pressure and transient
pressure for the 2-D modeling.
Comparing the ANSYS calculated results with the failure criteria to confirm whether the
possibility of lower head failure occurs or not under vapor explosion load and thermal
load.
2.4.1 Static analysis of ANSYS
The static analysis solution method is valid for all degrees of freedom (DOFs). Inertial
and damping effects are ignored, except for static acceleration fields.
The overall equilibrium equations
a rK u F F (2-1) where:
K total stiffness matrix
1 N e m K
{u} = nodal displacement vector
N = number of elements
[Ke] = element stiffness matrix
{Fr} = reaction load vector
{Fa}, the total applied load vector, is defined by:
1 N a nd ac th pr e e m F F F F F
(2-2) where nd{Fac} = - [M] {ac} = acceleration load vector
[ M ] = total mass matrix =
1 N e m M
[Me] = element mass matrix (described in Derivation of Structural Matrices)
{ac} = total acceleration vector (defined in Acceleration Effect)
{Fe th
}= element thermal load vector (described in Derivation of Structural Matrices)
{Fepr}= element pressure load vector (described in Derivation of Structural Matrices)
1 N a nd e m Q Q Q
(2-3)2.4.2 Transient analysis of ANSYS
The transient analysis solution method used depends on the DOFs involved. Structural,
acoustic, and other second order systems (that is, the systems are second order in time) are
solved using one method and the thermal, magnetic, electrical and other first order systems
are solved using another. Each method is described subsequently. If the analysis contains
both first and second order DOFs (e.g. structural and magnetic), then each DOF is solved
using the appropriate method. For matrix coupling between first and second order effects
such as for piezoelectric analysis, a combined procedure is used. The transient dynamic
equilibrium equation of interest is as follows for a
linear structure:
aM u C u K u F
(2-4)
where:
[M] = structural mass matrix
[C] = structural damping matrix
u
= nodal acceleration vector
u
= nodal velocity vector
u
= nodal displacement vector
aF = applied load vector
There are two methods in the ANSYS program which can be employed for the solution
of the linear: the forward difference time integration method and the Newmark time
integration method. The forward difference method is used for explicit transient analyses
and is described in the LS-DYNA Theoretical Manual.
Fig. 3 Front view of lower head
Fig. 6 Simplified 2-D model of lower head for structural analysis
Fig. 8 3-D Model of lower head for structural analysis
Fig. 10 Simplified 2-D model of lower head for thermal analysis
( a ) Structural PANE 42 geometry in ANSYS
( b ) Structural SOLID 185 geometry in ANSYS
( c ) Thermal PLANE 55 geometry in ANSYS
( d ) Structure PLANE 42 geometry in ANSYS
2.5 Failure criteria
2.5.1 Design criteria
The design criteria are based on ASME Boiler & Pressure Vessel Design Code
Section Ⅲ NB-3200[2]. A detailed stress analysis of all major structural components shall
be prepared in sufficient detail to show that each of the stress limitations of NB-3220 and
NB-3230 is satisfied when the component is subjected to loading of NB-3110.
The allowable value of general primary membrane stress intensity is Sm at the design
temperature. The primary membrane plus primary bending stress intensity is derived from
the highest value across the thickness of a section of the general or local primary
membrane stress plus primary bending stress produced by design pressure and other
specified design mechanical loads, but excluding all secondary and peak stresses. For solid
rectangular sections, the allowable value of this intensity is 1.5Sm[1].
2.5.2 Structural failure criteria
Failure criteria used by Bohl and Butler[3] as well as by Berman et al.[4] were
phenomenologically based on continuum mechanics. Each criterion based on failure on
equivalent plastic strain , which is defined in terms of the principal plastic strains by
(2-5)
According to Bohl and Butler, failure should occur at -12% equivalent plastic strain.
Berman et al. on the other hand, placed this criterion at -18%.
According to criterion of Ghosh, which is metallurgically based in rupture, failure
occurs when p
2
2
2 1 2 2 3 3 1 2 3 p
Where is the maximum principle plastic strain and if the failure plastic strain obtained
from
(2-7)
Where and are defined as
(2-8)
The failure obtained using this criterion were at the same location but somewhat delayed
in relation to those obtained using the 12% or 18% criterion discussed previously.
Here, choose 11% as the criteria.
2.5.3 Boiling failure criteria
Nucleate boiling heat transfer coefficients are so high that any flux level, up the CHF,
can be accommodated with only a few tens of degrees in wall superheat ( temperature
above the coolant saturation temperature ). Nominally, therefore, in nucleate boiling the
outer surface of the lower head is at 100℃ ( note that he vessel wall will cool from the
inside during depressurization of the reactor coolant system, so that nucleate boiling will
occur without any delay when the lower head comes in contact with cavity water on the
outside ). This is very significant for the structural stability of the lower head.
The most limiting failure mechanism of the lower head is the boiling crisis. It occurs
when the heat flux through it exceeds the critical heat flux at the same location, and it
results in sudden transition of the flow regime from nucleate to film boiling. Film boiling
is characterized by considerably lower heat transfer coefficients, and as a consequence the
surface temperature rises to considerably higher values in order to accommodate the
2 0.5 2 1 1.2 126.1 1 1.2 1 pg
1.5 2.5 2.5 1.5
1 2
surface temperature must rise to about 1200℃ in saturated water. At such temperature
the steel loses essentially all of its strength, and it becomes susceptible to creep, and
structural instability, even and the modest mechanical loads of interest to this problem.
So, in boiling heat transfer problems, must control the heat flux seriously, according to
the experiment results conducted by T.G. Theofanous and C. Liu et al.[6], Fig. 17 is the result appropriate for quantifying the thermal failure criteria, if the heat flux don’t exceed the values in the Fig. 17, the boiling crisis will not occur.
Fig. 14 The result appropriate for quantifying the thermal failure criteria
2.5.4 Thermal failure criteria
Vessel failure can be initiated either by plastic instability or creep mechanisms. When
the membrane stress exceeds the material strength (which reduces significantly with
through the complete wall thickness then creep deformation can occur even at low
pressure[8].
For plastic deformation, the membrane stress and the membrane plus bending stress
from the highest value across the thickness of a section of the general or local primary
membrane stress plus primary bending stress produced by design pressure and other
specified design mechanical loads, but excluding all secondary and peak stresses. For solid
rectangular sections, the allowable value of the intensity is 1.5 Sm.
For creep deformation criteria, according to experiment, if the total strain (total
3. Structural analysis procedure and results
In this paper, using the ANSYS program to perform the analysis procedure, including
the 2-D modeling and 3-D modeling structural analysis, 2-D modeling thermal analysis
and thermo-structural analysis.
3.1 Structural analysis of 2-D modeling lower head
For this analysis, there are two situations: static analysis and transient analysis, both
using the calculated explosion pressure imposed on the lower head inner wall, strain and
stress calculation were performed using ANSYS program, and then comparing the
calculated value with the allowable failure criteria value to determine the failure
probability of the lower head.
3.1.1 Stress analysis under design condition
The design condition pressure of 17.24 MPa is applied for the inner side of the head.
Material of the lower head is SA508 class 3 steel
Table 1 Loading data for 2-D model structural analysis under design condition
Loadings Data
Pressure load 17.24 MPa
Table 2 Mechanical properties of material at 260℃ for 2-D model structural analysis
( GPa ) ( Kg / m3 ) ( MPa )
Value 172.2 0.312 8110 422
3.1.2 Transient dynamic analysis of explosion load
Time histories of explosion pressure when explosion starts at the bottom and top of the
lower head are shown in Fig. 15 and Fig. 16, respectively. A time history of explosion in
case of single jet mixing is shown in Fig.17. But these are too complex to take input data
of ANSYS. Simplified input data are shown in from Fig.18, Fig.20 and Fig. 22.
For CASE 1, explosion pressure applies uniformly on the whole inside of the lower
head. For CASE 2, the inside surface of the head is divided by 7 segments, and various
history of explosion pressure applied on the each segments. For CASE 3, the inside surface
of the head is divided by 3 segments, and various history of explosion pressure applies on
the each segments.
Table 3 Loading data for 2-D model structural analysis under transient explosion
Loadings Data
Pressure load As shown in Fig. 18, Fig. 20 and Fig. 22
3.1.3 Results of simplified 2-D model structural analysis
There are two situations: results under design condition and transient dynamic explosion load.
3.1.3.1 Stress analysis results under design condition
across the wall thickness of a section is shown in Fig 27, the maximum membrane stress
intensity is 123.83 MPa, which is less than the allowable value of 204 MPa; the maximum
membrane plus bending stress intensity is 171.61 MPa, which is less than the allowable
value of 306 MPa. The equivalent strain distribution is shown in Fig.25, the maximum
equivalent strain is 0.0997% and is much less than the allowable value of 11%.
3.1.3.2 Transient dynamic analysis of explosion load results
For CASE 1, at the last step 0.01 sec, the stress intensity distribution and equivalent
strain distribution are shown in Fig. 28 and Fig. 29, respectively, the maximum equivalent
strain is 0.0975%, which much less than the allowable value 11%. The membrane stress
and membrane plus bending stress along path 2 is plotted in Fig. 30, the maximum
membrane stress is 126.99 MPa and is less than the allowable value 204 MPa; the
maximum membrane plus bending stress is 145.66 MPa and is less than the allowable
value 306 MPa. Time history of equivalent strain and stress at node A are shown in Fig. 32
and Fig. 33, respectively, both the value increase with time, but the value is very small.
For Case 2, at the last step 0.01 sec, the stress intensity distribution and equivalent strain
distribution are plotted in Fig. 34 and Fig. 35, respectively, the maximum equivalent strain
is 0.1155% and is less than the allowable value 11%. The membrane stress and membrane
plus bending stress along path 3 is plotted in Fig. 37, the maximum membrane stress is
140.05 MPa, which is less than the allowable value 204 MPa; the maximum membrane
plus bending stress is 168.06 MPa, which is less than the allowable value 306 MPa. Time
history of equivalent strain and stress at node B are shown in Fig. 38 and Fig. 39,
respectively, the equivalent strain and stress increase with time, but the value is very small.
For Case 3, at the last step at the last step 7.1929e-3 sec, the stress intensity distribution
stress and membrane plus bending stress along path 4 is plotted in Fig. 43, the maximum
membrane stress is 36.21 MPa and is less than the allowable value 204 MPa; the
maximum plus bending stress is 51.38 MPa and is also much less than the allowable value
306 MPa. Time history of equivalent strain and stress at node C are shown in Fig. 44 and
Fig. 45, respectively, the equivalent strain and stress increase with time, but the value is
very small.
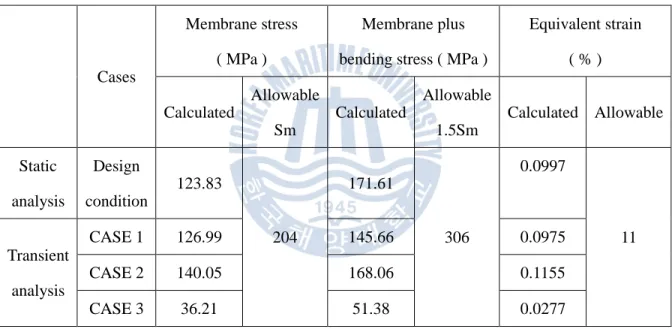
Table 4 Summary of 2-D modeling structural analysis results
Cases
Membrane stress
( MPa )
Membrane plus
bending stress ( MPa )
Equivalent strain ( % ) Calculated Allowable Sm Calculated Allowable 1.5Sm Calculated Allowable Static analysis Design condition 123.83 204 171.61 306 0.0997 11 Transient analysis CASE 1 126.99 145.66 0.0975 CASE 2 140.05 168.06 0.1155 CASE 3 36.21 51.38 0.0277
Fig. 15 Time history of explosion pressure in case of starting explosion at the bottom of the
head
Fig. 16 Time history of explosion pressure in case of starting explosion at the top of the
Fig. 18 Input time history of explosion pressure applied on 7 segments of inside of the
head (CASE 1)
Fig. 19 Pressure loaded locations of lower head for CASE 1 0 20 40 60 80 100 120 140 2.03 2.24 2.27 2.41 3.7 5 10
P
re
ssure
/ MP
a
Time / ms
segment 1Fig. 20 Input time history of explosion pressure applied on 7 segments of inside of the head (CASE 2) 0 20 40 60 80 100 120 140 0.01 0.34 0.4 3 0.49 0.76 0.85 0.94 1.2 2 1.27 1.38 1.62 1.66 1.75 1.97 2 2.03 2.24 2.27 2.41 3.7 5 10
P
re
ssure
/ MP
a
Time / ms
segment 1 segment 2 segment 3 segment 4 segment 5 segment 6 segment 7Fig. 22 Input time history of explosion pressure applied uniformly in case of single jet mixing (CASE 3).
Fig. 23 Pressure loaded locations of lower head for CASE 3 0 10 20 30 40 50 60 0.0 00 1 0.0101 5 0.4980 2 2.0671 2.9366 2.9643 3.1865 3.5687 3.7734 4.5788 5.2055 5.4553 5.6489 6.1326 6.5027 7.1929
P
re
ssure
/ MP
a
Time / ms
segment 1 segment 2 segment 3Fig. 24 Stress intensity distribution of 2-D model structural analysis under design
condition
Fig. 25 Equivalent strain distribution of 2-D model structural analysis under design
Fig. 26 Path 1 of 2-D model structural analysis under design condition
Fig. 27 Membrane and membrane plus bending stress along Path 1 of 2-D model structural
analysis under design condition
Fig. 28 Stress intensity distribution at 0.01 sec of 2-D model structural analysis for CASE1
Fig. 29 Equivalent strain distribution at 0.01 sec of 2-D model structural analysis for
Fig. 30 Path 1 and Node A of 2-D model structural analysis for CASE 1
Fig. 31 Membrane and membrane plus bending stress at 0.01 sec along Path 2 of 2-D
model structural analysis for CASE 1
Path 2
Node A
Fig. 32 Time history of equivalent stress at Node A of 2-D model structural analysis for
CASE 1
Fig. 33 Time history of equivalent strain at Node A of 2-D model structural analysis for
Fig. 34 Stress intensity distribution at 0.01 sec of 2-D model structural analysis for CASE2
Fig. 35 Equivalent strain distribution at 0.01 sec of 2-D model structural analysis for
Fig. 36 Path 1 and Node A of 2-D model structural analysis for CASE 2
Fig. 37 Membrane and membrane plus bending stress at 0.01 sec along Path 3 of 2-D
model structural analysis for CASE 2
Path 3
Node B
Fig. 38 Time history of equivalent stress at Node B of 2-D model structural analysis for
CASE 2
Fig. 39 Time history of equivalent strain at Node B of 2-D model structural analysis for
Fig. 40 Stress intensity distribution at 0.0072 sec of 2-D model structural analysis for
CASE 3
Fig. 41 Equivalent strain distribution at 0.0072 sec of 2-D model structural analysis for
Fig. 42 Path 1 and Node A of 2-D model structural analysis for CASE 3
Fig. 43 Membrane and membrane plus bending stress at 0.0072 sec along Path 4 of 2-D
model structural analysis for CASE 3
Node C
Fig. 44 Time history of equivalent stress at Node C of 2-D model structural analysis for
CASE 3
Fig. 45 Time history of equivalent strain at Node C of 2-D model structural analysis for
3.2 Structural analysis of 3-D model lower head
For 3-D model analysis, all the loading pressure values and material properties are as
same as 2-D situation, the only different thing is that the pressure applies not only on the
inside surface of lower head but also on the top surface and side surface of three pipes.
3.2.1 Stress analysis under design condition
The pressure of design condition is 17.24 MPa, which is applied on the inner side of the
head, the side surfaces and top surface of 3 pipes.
3.2.2 Transient dynamic analysis of explosion load
Three CASES transient dynamic pressures apply on the inner side of the head, ide
surfaces and top surface of 3 pipes. The pressure values are shown in Fig. 18, Fig. 20 and
Fig. 22, respectively.
3.2.3 Results of 3-D modeling structural analysis
There are two situations: results under design condition and transient dynamic explosion
loads.
3.2.3.1 Stress analysis results under design condition
A contour plot of the stress intensity is shown in Fig. 46, the maximum stress intensity is
235.79 MPa at connection between the lower head and the second pipe. A plot of sections
tresses across the wall thickness of a section is shown in Fig 49, the maximum membrane
maximum membrane plus bending stress intensity is 203.58 MPa, which is less than the
allowable value of 306 MPa. The equivalent strain distribution is shown in Fig.47, the
maximum equivalent strain is 0.3223% and is much less than the allowable value of 11%.
3.2.3.2 Transient dynamic analysis of explosion load results
For CASE 1, at the last step 0.01 sec, the stress intensity distribution and equivalent
strain distribution are shown in Fig. 50 and Fig. 51, respectively, the maximum equivalent
strain is 0.3084%, which much less than the allowable value 11%. The membrane stress
and membrane plus bending stress along path 6 is plotted in Fig. 50, the maximum
membrane stress is 189.63 MPa and is less than the allowable value 204 MPa; the
maximum membrane plus bending stress is 237.07 MPa and is less than the allowable
value 306 MPa. Time history of equivalent strain and stress at node D are shown in Fig. 54
and Fig. 52, respectively, both the value increase with time, but the value is very small.
For CASE 2, at the last step 0.01 sec, the stress intensity distribution and equivalent
strain distribution are plotted in Fig. 56 and Fig. 57, respectively, the maximum equivalent
strain is 0.3853% and is less than the allowable value 11%. The membrane stress and
membrane plus bending stress along path 7 is plotted in Fig. 59, the maximum membrane
stress is 199.07 MPa, which is less than the allowable value 204 MPa; the maximum
membrane plus bending stress is 225.52 MPa, which is less than the allowable value 306
MPa. Time history of equivalent strain and stress at node E are shown in Fig. 60 and Fig.
61, respectively, the equivalent strain and stress increase with time, but the value is very
small.
For CASE 3, at the last step at the last step 7.1929e-3 sec, the stress intensity
distribution and equivalent strain are shown in Fig. 62 and Fig. 63, respectively, the
membrane stress and membrane plus bending stress along path 8 is plotted in Fig. 65, the
maximum membrane stress is 46.91 MPa and is less than the allowable value 204 MPa; the
maximum plus bending stress is 111.67 MPa and is also much less than the allowable value
306 MPa. Time history of equivalent strain and stress at node F are shown in Fig. 66 and
Fig. 67, respectively, the equivalent strain and stress increase with time, but the value is
very small.
Table 5 Summary results of 3-D modeling structural analysis
Cases
Membrane stress
( MPa )
Membrane plus
bending stress ( MPa )
Equivalent strain ( % ) Calculated Allowable Sm Calculated Allowable 1.5Sm Calculated Allowable Static analysis Design condition 176.23 204 203.58 306 0.3223 11 Transient analysis CASE 1 189.63 237.07 0.3084 CASE 2 199.07 225.52 0.3853 CASE 3 46.91 111.67 0.1352
Fig. 46 Stress intensity distribution of 3-D model structural analysis under design condition
Fig. 47 Equivalent strain distribution of 3-D model structural analysis under design
Fig. 48 Path 1 of 3-D model structural analysis under design condition
Fig. 49 Membrane and membrane plus bending stress along Path 5 of 3-D model structural
analysis under design condition
Fig. 50 Stress intensity distribution at 0.01 sec of 3-D model structural analysis
for CASE 1
Fig. 52 Path 1 and Node A of 3-D model structural analysis for CASE 1
Fig. 53 Membrane and membrane plus bending stress at 0.01 sec along Path 6 of 3-D
model structural analysis for CASE 1
Node D
Path 6
Fig. 54 Time history of equivalent stress at Node D of 3-D model structural analysis
for CASE 1
Fig. 55 Time history of equivalent strain at Node D of 3-D model structural analysis
Fig. 56 Stress intensity distribution at 0.01 sec of 3-D model structural analysis
for CASE 2
Fig. 57 Equivalent strain distribution at 0.01 sec of 3-D model structural analysis
Fig. 58 Path 1 and Node A of 3-D model structural analysis for CASE 2
Fig. 59 Membrane and membrane plus bending stress at 0.01 sec along Path 1 of 3-D
model structural analysis for CASE 2
Node E
Fig. 60 Time history of equivalent stress at Node A of 3-D model structural analysis for
CASE 2
Fig. 61 Time history of equivalent strain at Node A of 3-D model structural analysis
Fig. 62 Stress intensity distribution at 0.0072 sec of 3-D model structural analysis for
CASE 3
Fig. 63 Equivalent strain distribution at 0.0072 sec of 3-D model structural analysis for
Fig. 64 Path 1 and Node A of 3-D model structural analysis for CASE 3
Fig. 65 Membrane and membrane plus bending stress at 0.0072 sec along Path 8 of 3-D
model structural analysis for CASE 3
Node F
Fig. 66 Time history of equivalent strain at Node F of 3-D model structural analysis for
CASE 3
Fig. 67 Time history of equivalent strain at Node F of 3-D model structural analysis for
3.3 Thermal Analysis
The thermal analysis process is: using the calculated explosion temperature imposed on
the lower head inside wall and the convection boundary condition imposed on the lower
head outside wall, temperature distribution and heat flux calculation are performed by
ANSYS program, then comparing the calculated heat flux value with the allowable boiling
failure criteria heat flux value to determine the boiling failure.
3.3.1 Introduction
According to the experiment results[6], the vessel wall experiences the temperature field
maintained by the convection varying from 400℃ to 700℃ along the polar angle.
The lower head is quenched down to saturation water at 100℃ and 0.1Mpa .
3.3.2 Loading data
Table 6 Loading data for thermal analysis
Inside Surface Segment 1 2 3 4 5 6 7 Temperature (℃) 400 460 520 580 640 700 260 Outside Surface Temperature: 100℃
Table 7 Material mechanical proprieties of thermal analysis Properties Temperature (℃ ) 100 260 400 460 520 580 640 700 Young’s modulus (GPa) 187 177.2 167 162 156 149.4 142.2 133 Poisson’s ratio 0.308 0.312 0.312 0.314 0.317 0.320 0.323 0.326 Thermal expansion coefficient ×10-6(m /m/ ℃ ) 6.72 7.3 7.7 7.9 8.05 8.15 8.3 8.4 Thermal conduction ( W / m. ℃ ) 40.6 39.3 36.8 35.55 34.5 33.1 31.8 29.1 Yield Strength ( MPa ) 453 422 397 373 336 336 336 336 Density (kg / m3 ) 8110 8110 8110 8110 8110 8110 8110 8110
3.3.3 Thermal analysis results
The temperature distribution of lower head is shown in Fig. 68. The heat flux
distribution is shown in Fig. 69, the maximum heat flux is 167.67 kW/ m2, which is less
Fig. 68 Temperature distribution of 2-D model of lower head
3.4 Thermo-mechanical analysis for 2-D modeling
For this process, both the calculated explosion pressure and the thermal analysis result
are applied on the lower head inner wall, total strain (total mechanical and thermal strain )
and stress calculation are performed by ANSYS program, then compare the calculated
value with the allowable failure criteria value to determine the failure of the lower head.
3.4.1 Thermo-mechanical analysis under design condition
The pressure of design condition is 17.24 MPa, which is applied on the inner side of the
head.
Table 8 Loading data for thermo-mechanical analysis under design condition
Loadings Data
Thermal load Temperature from heat transfer analysis as shown in Fig. 68
Pressure load 17.24 ( MPa )
Reference temperature 30℃
The material mechanical properties for the thermo-mechanical analysis are as same as
the thermal analysis values, which are listed in Table 7.
3.4.2 Thermo-mechanical analysis under transient dynamic of explosion load
The pressure application situation of thermo-mechanical analysis is as same as the
Table 9 Loading data for thermo-mechanical analysis under transient explosion
Loadings Data
Thermal load Temperature from heat transfer analysis as shown in Fig. 68
Pressure load As shown in Fig.18, Fig.20 and Fig.22
Reference temperature 30℃
3.4.3 Results of thermo-mechanical analysis
There are two situations: results under design condition and transient dynamic explosion load.
3.4.3.1 Thermo-mechanical analysis results under design condition
A contour plot of the stress intensity is shown in Fig. 70, the maximum stress intensity is
233.39 MPa. A plot of sections tresses across the wall thickness of a section is shown in
Fig 73, the maximum membrane stress intensity is 131.51 MPa, which is less than the
allowable value of 197 MPa; the maximum membrane plus bending stress intensity is
292.11 MPa, which is less than the allowable value of 295.5 MPa. The total strain
distribution is shown in Fig. 71, the maximum value is 0.8083%, which is less than the
allowable value 6%.
3.4.3.2 Thermo-mechanical analysis results under transient dynamic of explosion load
For CASE 1, at the last step 0.01 sec, the stress intensity distribution and total strain
distribution are shown in Fig. 74 and Fig. 75, respectively, the maximum value is 1.2603%,
which is less than the allowable value 6%. The membrane stress and membrane plus
MPa and is less than the allowable value 197 MPa; the maximum membrane plus bending
stress is 208.50 MPa and is less than the allowable value 295.5 MPa. Time history of
equivalent strain and stress at node G are shown in Fig. 78 and Fig. 79 respectively, both
the value increase with time, but the value is very small.
For CASE 2, at the last step 0.01 sec, the stress intensity distribution and Total strain
distribution are plotted in Fig. 80 and Fig. 81 respectively, the maximum value is 1.3237%,
which is less than the allowable value 6%. The membrane stress and membrane plus
bending stress along path 11 is plotted in Fig. 83, the maximum membrane stress is 190.09
MPa, which is less than the allowable value 197 MPa; the maximum membrane plus
bending stress is 214.93 psi, which is less than the allowable value 295.5 MPa. Time
history of equivalent strain and stress at node H are shown in Fig. 84 and Fig. 85
respectively, the equivalent strain and stress increase with time, but the value is very small.
For CASE 3, at the last step at the last step 7.1929e-3 sec, the stress intensity
distribution and total strain are shown in Fig. 86 and Fig. 87 respectively, the maximum
value is 1.308%, which is less than the allowable value 6%. The membrane stress and
membrane plus bending stress along path 12 is plotted in Fig. 89, the maximum membrane
stress is 78.60 MPa and is less than the allowable value 197 MPa; the maximum plus
bending stress is 161.76 MPa and is also much less than the allowable value 295.5 MPa.
Time history of equivalent strain and stress at node I are shown in Fig. 90 and Fig. 91,
Table 10 Summary results of thermo-mechanical analysis CASES Membrane stress (MPa ) Membrane plus bending stress ( MPa ) Total strain ( % ) Calculated Allowable Sm Calculated Allowable 1.5Sm Calculated Allowable Static analysis Design condition 131.51 197 292.11 295.5 0.8083 6 Transient analysis CASE1 166.33 208.50 1.2603 CASE 2 190.09 214.93 1.3237 CASE 3 78.60 161.76 1.308
Fig. 70 Stress intensity distribution of 2-D model thermo-mechanical analysis under design
condition
Fig. 71 Total strain distribution of 2-D model thermo-mechanical analysis under design
Fig. 72 Path 1 of 2-D model thermo-mechanical analysis under design condition
Fig. 73 Membrane and membrane plus bending stress along Path 9 of 2-D model
thermo-mechanical analysis under design condition
Fig. 74 Stress intensity distribution at 0.01 sec of 2-D model thermo-mechanical analysis
for CASE 1
Fig. 75 Total strain distribution at 0.01 sec of 2-D model thermo-mechanical analysis for
Fig. 76 Path 1 and Node A of 2-D model thermo-mechanical analysis for CASE 1
Fig. 77 Membrane and membrane plus bending stress at 0.01 sec along Path 10 of 2-D
model thermo-mechanical analysis for CASE 1
Path 10
Node G
Fig. 78 Time history of equivalent stress at Node G of 2-D model thermo-mechanical
analysis for CASE 1
Fig. 79 Time history of equivalent strain at Node G of 2-D model thermo-mechanical
Fig. 80 Stress intensity distribution at 0.01 sec of 2-D model thermo-mechanical analysis
for CASE 2
Fig. 81 Total strain distribution at 0.01 sec of 2-D model thermo-mechanical analysis for
Fig. 82 Path 1 and Node A of 2-D model thermo-mechanical analysis for CASE 2
Fig. 83 Membrane and membrane plus bending stress at 0.01 sec along Path 11 of 2-D
model thermo-mechanical analysis for CASE 2
Node H
Path 11
Fig. 84 Time history of equivalent stress at Node H of 2-D model thermo-mechanical
analysis for CASE 2
Fig. 85 Time history of equivalent strain at Node H of 2-D model thermo-mechanical
Fig. 86 Stress intensity distribution at 0.0072 sec of 2-D model thermo-mechanical
analysis for CASE 3
Fig. 87 Total strain distribution at 0.0072 sec of 2-D model thermo-mechanical analysis for
Fig. 88 Path 1 and Node A of 2-D model thermo-mechanical analysis for CASE 3
Fig. 89 Membrane and membrane plus bending stress at 0.0072 sec along Path 12 of 2-D
model thermo-mechanical analysis for CASE 3
Fig.90 Time history of equivalent stress at Node I of 2-D model thermo-mechanical
analysis for CASE 3
Fig. 91 Time history of equivalent strain at Node I of 2-D model thermo-mechanical
4. Conclusion and Future Work
A safety assessment of the nuclear reactor lower head under in-vessel vapor explosion
loads has been performed, two analysis methods are used: structural analysis and
thermo-mechanical analysis. Firstly, the calculated explosion pressure loads are imposed
on the lower head inner wall, strain calculations and membrane stress intensity are
calculated by using ANSYS 11.0 program; secondly, both the calculated explosion pressure
loads and the thermal loads are imposed on the modeling of the lower head, total strain and
membrane stress intensity are calculated by using ANSYS 11.0 program. And then, the
calculated strain and stress results are compared with the reference standard values of
failure criteria to determine the failure of the lower head
The thermal analysis supplies the temperature distribution of the lower head, it must be
analysed before the thermo-mechanical analysis, because the thermo-mechanical analysis
is based on the thermal analysis.
Structural analysis results used the calculated pressure loads on the lower head inner
wall show that the vapor explosion-induced lower head failure is physically unreasonable
under the pressure value up to 118.5 MPa.
Thermo-mechanical analysis results used both pressure loads and thermal loads on the
modeling of the lower head show shat the vapor explosion-induced lower head failure also
does not exist under the pressure value up to 118.5 MPa and the temperature value up to
700℃.
The thermal analysis results used the temperature convection loads on the lower head
show that the boiling crisis does not exist under present situation.
In this paper, it’s only considered the static thermal condition, however, the heat transfer
accurate analysis result, the transient thermal situation must be considered, which just as
the time historical explosion pressure load.
For the thermo-structural analysis, the 2-D modeling of lower head is only considered
instead of considering the 3-D modeling, in order to calculate the detail structural and
welding condition just as the structural analysis, the 3-D modeling thermo-structural
analysis is the future work to complete, and then a more accurate and comprehensive result
References
[1] 박광연, 조종래, 박익규, 최병욱, 김기용, 이경중, 1998, Technical report:
Research & Development on Next Generation Reactor, Safety Assessment of In-Vessel
Vapor Explosion Loads in Next Generation Reactor, 49-54.
[2] ASME Boiler & Pressure Vessel Design Code Section Ⅲ, ASME, 1995
[3] W.R. Bohr and T.A. Butler, “Comments on Proposed Research Contributing to the Relation of Residual Steam Explosion Issues,” Letter Report in “A Review of Current Understanding of the Potential for Containment Failure Arising from In-vessel Steam Explosion,” NUREG-1116, U.S Nuclear Regulatory Commission, Feb. 1985.
[4] M. Berman, D.V. Swenson and A.J. Eickett, “An Uncertainty Study of PWR Steam Explosions,” SAND83-1438, NUREG/CR-3369, Sandia National Laboratories, May 1984.
[5] A.K. Ghosh, Metall. Trans., 7A, 523, 1976.
[6] T.G. Theofanous, C. Liu, S. Additon, S. Angelini, O. Kymalainen, T. Salmassi, 1997, “In-Vessel coolability and retention of a core melt”, Nuclear Engineering and Design, 7-10.
[7] B.R. Sehgal, A. Theerthan, A. Giri, A. Karbojian, H.G, Willschutz, O. Kymalainen, S. Vandroux, J.M. Bonnet and so on, 2003, “Assessment of reactor vessel integrity (ARVI), Nuclear Engineering and Design, 25-29.
[8] Vincent Koundy, Cataldo Caroli, Laetitia Nicolas, Philippe Matheron, Jean-Marie Gentzbittel, Michel Coret, 2008, “Study of tearing behavior of a PWR reactor pressure vessel lower head under severe accident loadings”, Nuclear Engineering and Design, 1-5.
under severe accident loading using improved shells of revolution theory”, Nuclear
Engineering and Design, 2400-2406
[10] T.L. Schulz, 2006, “Westinghouse AP1000 advanced passive plant”, Nuclear
Engineering and Design, 1547-1553.
[11] R. Krieg, B. Dolensky, B. Goller, G. Hailfinger, T. Jordan, G. Messemer, N. Prothmann, E. Stratmanns, 2003, “Load carrying capacity of a reactor vessel head under molten core slug impact”, “Final report including recent experimental findings”, Nuclear Engineering and Design, 241-243
[12] T.G. Theofanous, W.W. Yuen, S. Angelini, J.J. Sienicki, K. Freeman, X. Chen, T. Salmassi, 1999, “Lower head integrity under steam explosion loads”, Nuclear Engineering and Design, 7-12
[13] T.G. Theofanous, J.P. Tu, A.T. Dinh, T.N. Dinh, 2002, “The boiling crisis phenomenon
Part Ⅰ: nucleation and nucleate boiling heat transfer”, Experimental Thermal and