저작자표시-비영리-변경금지 2.0 대한민국 이용자는 아래의 조건을 따르는 경우에 한하여 자유롭게 l 이 저작물을 복제, 배포, 전송, 전시, 공연 및 방송할 수 있습니다. 다음과 같은 조건을 따라야 합니다: l 귀하는, 이 저작물의 재이용이나 배포의 경우, 이 저작물에 적용된 이용허락조건 을 명확하게 나타내어야 합니다. l 저작권자로부터 별도의 허가를 받으면 이러한 조건들은 적용되지 않습니다. 저작권법에 따른 이용자의 권리는 위의 내용에 의하여 영향을 받지 않습니다. 이것은 이용허락규약(Legal Code)을 이해하기 쉽게 요약한 것입니다. Disclaimer 저작자표시. 귀하는 원저작자를 표시하여야 합니다. 비영리. 귀하는 이 저작물을 영리 목적으로 이용할 수 없습니다. 변경금지. 귀하는 이 저작물을 개작, 변형 또는 가공할 수 없습니다.
The Suppressive Mechanisms of TIM3
on T Cell Cytokine Production and
The Anti-Tumor Effect of
TIM3-Pathway Inhibition
by
Mi Jin Lee
Major in Medical Sciences
Department of Medical Sciences
The Graduate School, Ajou University
The Suppressive Mechanisms of TIM3
on T Cell Cytokine Production and
The Anti-Tumor Effect of
TIM3-Pathway Inhibition
by
Mi Jin Lee
A Dissertation Submitted to The Graduate School of Ajou
University in Partial Fulfillment of the Requirements for
the Degree of Ph.D. in Medical Sciences
Supervised by
Sun Park, Ph.D. M.D.
Major in Medical Sciences
Department of Medical Sciences
The Graduate School, Ajou University
This certifies that the dissertation
of Mi Jin Lee is approved.
SUPERVISORY COMMITTEE
The Graduate School, Ajou University
December, 23rd, 2010
Ho-Joon Shin
Sun Park
Kyongmin Kim
Young-Joon Chwae
Jeon-Soo Shin
i -ABSTRACT-
The Suppressive Mechanisms of TIM3 on T Cell Cytokine
Production and The Anti-Tumor Effect of
TIM3-Pathway Inhibition
T cell immunoglobulin- and mucin-domain-containing molecule-3 (TIM3) has been shown to be expressed on Th1 cells and negatively regulates these cell functions. TIM3 has been implicated in the Th1-driven pathogenesis of autoimmune disease and the viral infection. However, molecular mechanisms of TIM3 inhibiting Th1 cells and the efficacy of tumor vaccine expressing Tim3 blocker have not been well studied. In this study, I investigated the molecular mechanisms underlying down-regulation of cytokine production by human TIM3 expression in T cells and the effect of expression of Tim3-hIg, mouse Tim3 pathway blocker, on tumor growth in mice. First, reduced expression of IL-2 and IFN-γ was demonstrated in both primary CD4+ T cells with high level of TIM3 expression and Jurkat T cells-over expressing TIM3. TIM3-over expression reduced the activities of NFAT and AP-1, important transcription factors of IL-2 expression. The expression of c-Jun and dephosphorylation of NFAT were suppressed by TIM3 expression. The 7 a.a from E261 to I267 of TIM3 cytoplasmic tail was critical for down-regulation of
cytokine production. The 54 a.a from E261 to P301 was involved in suppression of AP-1
activity and 34 a.a from E268 to P301 in suppression of NFAT activity.
On the other hands, I examined the effect of expression of mouse Tim3 pathway blocker, Tim3-hIg. The tumor growth in mice injected with Lewis lung carcinoma (3LL) cells was
ii
suppressed and the frequencies of CD4+CD25+Foxp3+ T cells were reduced. Furthermore,
injection of Tim3 pathway inhibitor expressing cells significantly enhanced the efficacy of a prophylactic tumor vaccine and marginally enhanced the efficacy of a therapeutic tumor vaccine. However, when given in combination with 5-fluorouracil, a chemotherapeutic agent, therapeutic tumor vaccine capable of Tim3 pathway inhibition had no additional anti-tumor effect. These data demonstrate that TIM3 inhibits Th1-mediated cytokine production through the suppression of AP-1 and NFAT activity and Tim3 pathway inhibitor enhances the efficacy of tumor vaccination and derives anti-tumor immunity.
Key words: TIM3, Th1 activation, IL-2, IFN-γ, c-Jun, NFAT, Tim3 inhibition, Tregs, Tumor vaccine therapy
iii
TABLE OF CONTENTS
ABSTRACT ··· ⅰ TABLE OF CONTENTS ··· ⅲ LIST OF FIGURES ··· ⅵ Ⅰ. INTRODUCTION ··· 1A. TIM3 and its ligand ··· 2
B. The role of TIM3 in Th1 driven immune response ··· 4
C. The cytopalsmic tail of TIM3 and co-inhibitory receptors in T cell activation ··· 7
D. The effect of function of co-inhibitory receptors on antitumor immune response ··· 10
E. Tumor-specific regulatory T cells in antitumor immunity ··· 11
F. Purposes of this research ··· 13
Ⅱ. MATERIALS AND METHODS ··· 14
A. Cells and cell stimulation ··· 14
B. Mice ··· 14
C. RNA isolation and cDNA synthesis ··· 15
D. Construction of plasmids for Tim3-hIg fusion protein expression ··· 15
E. Construction of plasmids for flag tagging TIM3 protein ··· 16
iv
G. Transfection of plasmids ··· 19
H. Preparation of enriched mouse and human CD4+ T cells ··· 19
I. Flow cytometric analysis ··· 20
J. SDS-PAGE and Western blotting ··· 21
K. Real-time reverse-transcription (RT)-PCR ··· 21
L. Luciferase assay ··· 22
M. ELISA ··· 23
Ⅲ. RESULTS ··· 24
A. IL-2 transcription is reduced in T cells expressing TIM3 ··· 24
B. Transcriptional activities of AP-1 and NFAT are reduced in TIM3-over expressing Jurkat T cells ··· 30
C. TIM3 expression attenuates the induction of c-Jun in stimulated T cells but not of c-Fos ··· 32
D. TIM3 expression affects the phosphorylation status of NFAT in stimulated T cells ··· 35
E. TIM3 cytoplasmic tail is essential for its inhibitory activity on the expression of IL-2 and IFN-γ ··· 37
F. C-terminal region of TIM3 is essential for suppression of transcriptional activity of AP-1 and NFAT··· 43
G. Tim3-hIg expressed in tumor cells inhibits in vivo tumor growth ··· 45
v
I. The frequencies of CD4+CD25+Foxp3+ regulatory T cells
in mice injected with Tim3-hIg expressing tumor cells ··· 50
J. Tim3-hIg expression marginally enhances the efficacy of the therapeutic tumor vaccine but not of the chemotherapy ··· 52
Ⅳ. DISCUSSION ··· 54
Ⅴ. CONCLUSION ··· 60
REFERENCES ··· 61
vi
LIST OF FIGURES
Fig. 1. IL-2 transcription is reduced in primary CD4+ T cells expressing TIM3 ··· 26
Fig. 2. IL-2 and IFN-γ transcription is reduced in Jurkat T cells expressing TIM3 ···· 28 Fig. 3. Transcriptional activities of AP-1 and NFAT are decreased in
TIM3-over expressing Jurkat T cells ··· 31 Fig. 4. TIM3 expression attenuates the expression of c-Jun but not of c-Fos ··· 33 Fig. 5. TIM3 expression affects dephosphorylation of NFAT ··· 36 Fig. 6. The expression of TIM3 cytoplasmic tail deletional mutant
in stable cell lines ··· 39 Fig. 7. C-terminal region of TIM3 is required for suppression of the expression
of IL-2 and IFN-γ ··· 41 Fig. 8. C-terminal region of TIM3 is essential for regulatory activity of AP-1 and
NFAT transcriptional activity ··· 44 Fig. 9. Tim3-hIg inhibits in vivo tumor growth ··· 46 Fig. 10. Tim3-hIg increases the efficacy of prophylactic tumor vaccine ··· 49 Fig. 11. The freguencies of CD4+CD25+Foxp3+ regulatory T cells in mice given
Tim3-hIg expressing tumor cells ··· 51 Fig. 12. Tim3-hIg expression marginally enhances the efficacy of the therapeutic
א
I. INTRODUCTION
Differentiation and the subsequent clonal expansion of T helper precursor cells (Th0) can result into one of two major effector cell types (Th1 and Th2). These cells play an important role in the adoptive immune response, and provide protection against intracellular and extracellular pathogens, such as viruses and helminthes (Mosmann et al., 1989). The extent of T cell activation and differentiation is largely determined by the duration and strength of T cell receptor-mediated stimulation. In addition, several co-stimulatory molecules including the TNF receptor family members (CD154, CD134 and CD137) (Locksley et al., 1998), immunoglobulin superfamily members (CD28, CTLA-4, ICOS and PD-1) (Salomin et al., 2001) and TIM3 family members (Kane, 2010), as well as cytokines such as IL-2 and IL-15 regulate the extent of clonal expansion, deletion and anergy induction.
ב
A. TIM3 and its ligandThe T cell immunoglobulin- and mucin-domain-containing molecule (TIM) proteins represent a previously unidentified group of molecules that act in concert with T cell receptor and co-stimulatory signal to regulate expansion and an effector function of Th1 and Th2 cell. TIM family members are type I membrane gylcoproteins expressed on T cells and containing Immunoglobulin V (IgV)-like domain, highly glycosylated mucin domain transmembrane domain and cytoplasmic domain. The mouse gene family includes 8 members (encoding Tim1, Tim2, Tim3 and Tim4 proteinsand the putative Tim5 to Tim8 proteins), while the human gene family includes 3 members encoding TIM1, TIM3 and TIM4 proteins (Kuchroo et al., 2003).
TIM3 is initially identified as a molecule expressed on Th1 but not Th2 cells in mice. TIM3 protein is not expressed in naïve murine T cells. In contrast, repetitive in vitro re-stimulations in the presence of Th1-skewing conditions (IL-12 and anti-IL-4) lead to TIM3 expression in Th1 cells (Monney et al., 2002; Sanchez-Fueyo et al., 2003). Up-regulation of TIM3 in vivo also requires several rounds of cell division, and is closely associated with IFN-γ production, although all IFN- γ -producing murine T cells are not TIM3 positive (Sabatos et al., 2003; Snchez-Fueyo et al. 2003). Otherwise, the most of activated human CD4+ T cells in Th1-skewing conditions become TIM3+ cells after a few days of
stimulation with anti-CD3/anti-CD28 (Hastings et al., 2009). TIM3 is also expressed by differentiated type 1 CD8+ T cells, Th17, regulatory T cells, monocytes, dendritic cells,
ג
The putative Tim3 ligand is demonstrated on the surface of CD4+CD25- T cells (both
naïve and memory), as well as on regulatory CD4+CD25+ T cells using Tim3-hIg and flow
cytometry,. In addition, Tim3-hIg binds to spleenic CD11c+ and CD11b+ cell populations
(Sabatos et al., 2003; Sanchez-fueyo et al., 2003). Recently galectin-9, a member of the S-type lectins, is identified as a TIM3 ligand by immunoprecipitation of cell surface proteins that binds to Tim3-hIg. Galectin-9-induced intracellular calcium flux, aggregation and death of Th1 cells are TIM3-dependent in vitro, and administration of galectin-9 in vivo resulted in selective loss of IFN-γ-producing cells and suppression of Th1 autoimmunity (Zhu et al., 2005). It appears that galectin-9 triggered activation of TIM3 pathway ensures an effective termination of Th1 driven immunity. One argument to these experiment is the fact that galectin-9 can have pleiotropic effects, through binding to multiple proteins with β-galactoside modifications, such as CD44 (Rabiovich et al., 2009). A recent study suggests the presence of other potential ligands for TIM3 based on the structure of TIM3 (Cao et al., 2007).
4
B. The role of TIM3 in Th1 driven immune response
The function of TIM3 has been demonstrated in a variety of murine models as well as human disease by blockade of Tim3-Tim3 ligand interactions using blocking antibody (Ab) or soluble form of recombinant TIM3 molecules. For example, administration of anti-Tim3 monoclonal Ab can increase the severity of experimental autoimmune encephalomyelitis (EAE) in immunized SJL mice and lead to massive activation and clonal expansion of macrophages (Monney et al., 2002), indicating that Tim3 blockade may interfere with an interaction between Th1 cells and Tim3 ligand-expressing macrophages. In a human disease, T-cell clones isolated from the cerebrospinal fluid of patients with multiple sclerosis (MS) express lower levels of TIM3 and secrete higher levels of IFN-γ compared to normal subject and the result using siRNA to reduce TIM3 expression in human ex vivo CD4+ T cells demonstrated that reduction of T-cell expression of TIM3 resulted in enhanced T-cell proliferation and IFN-γ secretion after T-cell stimulation. Those data indicated that TIM3 functions to inhibit aggressive Th1-mediated auto- and allo-immune responses (Khademi et al., 2004).
TIM3 is involved in peripheral immune tolerance, in which long term survival and tolerance to MHC mismatched allografts are achieved through the administration of donor specific transfusion (DST) plus anti-CD154 (CD40L) co-stimulation blockade, administration of Tim3-hIg abrogates tolerance induction (Sanchez-fueyo et al., 2002 ; Sabatos et al., 2003). This effect suggested to be mediated, at least in part, by the immunosuppressive potency of CD4+CD25+ regulatory T cells, but the exact mechanism
5
by which Tim3 influences T-cell tolerance is not known. Concordantly, in vivo
7administration of galectin-9 leads to not only down-regulation of Th1-mediated immune
responses but also an increase in regulatory T cells in a model of viral-induced immunopathology (Sehrawat et al., 2009). Furthermore, blocking the Tim3 pathway using Tim3-hIg during tolerance induction is sufficient to prevent tolerance and leads to increased proliferation and cytokine production. Moreover, Tim3-deficient mice could not be tolerized by treating with high-dose aqueous antigen (Sabatos et al., 2003).
TIM3 is associated with the phenomenon of immune exhaustion. It is previously described that subset of programmed death-1-expressing nonresponsive T cells were a largely overlapped the population of CD8+ T cells that express TIM3 in individuals with
chronic human immunodeficiency virus (HIV) infection. Expression of TIM3 correlates with disease progression and is associated with a lack of activation potential. Most strikingly, soluble Tim3-hIg or a putative blocking Ab for human TIM3 can partially reverse the activation defect of these cells, and blocking both TIM3 and PD-1 leads to a cooperative or synergistic rescue of T cell activation (Anderson et al., 2007). Upregulation of TIM3 on CD4+ and CD8+ exhausted T cell was also recently reported in patients with
chronic hepatitis C virus infection (Golden-Mason et al., 2009).
Furthermore, in HCV/HIV co-infection, both total and HCV-specific T cells co-express Tim3 and PD-1 in significantly higher frequencies, compared with HCV mono-infection. Co-expression of these two markers on HCV-specific CD8+ T cells positively correlate
with a clinical parameter of liver disease progression and were shown greater frequencies of Tim3/PD-1 co-expression than HIV-specific CD8+ T cells, which may indicate a greater
6
degree of exhaustion in the former. Blocking Tim3 or PD-1 pathways restores both HIV- and HCV-specific CD8+ T-cell expansion in the blood of co-infected individuals (Vali et al.,
2010). It remains to be seen whether a similar role exists for TIM3 in other case of infection or cancer where chronic stimulation may result in T cell exhaustion.
7
C. The cytoplasmic tail of TIM3 and co-inhibitory receptors in T cell activation
An optimal balance between positive and negative signals delivered through co-stimulatory receptors on the surface of T cells is critical for the generation of an effective cellular immune response. T cell activation is controlled finely by co-stimulatory molecules on the surface of APCs and cytokines secreted by activated lymphocytes for the proper duration. After T cell activation, it is restricted by negative signals in order to maintain homeostasis of T cell population sequentially generated in activated T cells. These negative signals depend on the co-inhibitory receptors, for example, cytotoxic T lymphocytes antigen-4 (CTLA-4) and programmed death-1(PD-1). It has been reported that these molecules are up-regulated by TCR signaling and then, inhibit proliferation or cytokine synthesis (Smith-Garvin et al., 2009).
Molecular mechanism for inhibitory effect by CTLA-4 have been revealed CTLA-4 blockade in vivo increases T cell responses to antigenic challenges, exacerbates autoimmune disease (Curiel et al., 2004), and enhances T cell-mediated tumor rejection (Leach et al., 1996). CTLA-4 shares the same ligands, namely 1 (CD80) and B7-2(CD86) between CD28. Because CTLA-4 is not readily detectable on resting T cells and is up-regulated after activation, there has been a prevailing idea that CTLA-4 terminates turn-on of T cell responses, possibly by opposing CD28-mediated co-stimulation by competing for the CD80/CD86 ligand and by actively blocking CD28-induced signals (Krummel et al., 1995). The cross-linking of CTLA-4 in conjunction with anti-CD3/CD28 mAb inhibits cell cycle progression, IL-2 secretion, and T cell proliferation (Fraser et al.,
8
1999) through inhibition of exracellular signal-regulated kinase (ERK) 3/c-Jun N-terminal kinase pathways (Revilla-Calvo et al., 1997) and NF-κB and AP-1 activation (Olsson et al., 1999).
The cytoplasmic tail of CTLA-4 contains two tyrosine residues (Y) at positions 201 and 208 in mice and a proline (P)-rich region. Y201 is contained within a YVKM motif. In
its unphosphorylated form, this motif allows association of CTLA-4 with AP50, the medium-chain subunit of the clathrin adaptor, AP-2. This interaction results in clathrin-dependent endocytosis of 4, therefore limiting 4 surface expression. CTLA-4 might also associate with the serine/threonine protein phosphatase 2A (PP2A)(Bradshaw et al., 1997; Chuang et al., 1997), although the functional consequence of this is not known. After TCR stimulation, CTLA-4 might undergo tyrosine phosphorylation by SRC kinases, inducing surface retention (Miyatake et al., 1998; Chuang et al., 1999; Chikuma et al., 2000). Whether phosphorylationof Y201 requires for CTLA-4 to associate with phosphatidylinositol 3-kinase (PI3K) and SH2-domain containing protein tyrosine phosphatase (SHP-2) remains controversial (Alegre et al., 2001).
Currently, the molecular mechanisms for the inhibitory effect of TIM3 on T cell activation have not been well studied. TIM3 intracellular domain contains six tyrosine residues, including a tyrosine phosphorylation motif RSEENIY (Monney et al., 2002). Phosphorylation of these tyrosine residues might be responsible for potentiating of signal transduction initiated by TIM3 activation. TIM3 appears to signal differently in DC and T cells since ligation of TIM3 with TIM3 mAb resulted in different patterns of phosphorylation in these cell types (Anderson et al., 2007). Otherwise, the intracellular
9
10
D. The effect of function of co-inhibitory receptors on antitumor immune response
It has been observed that a systemic or persistent presence of tumor antigen can impair memory CD8+ T cell function (Freeman et al., 2000; Den Boer et al., 2004). Continuous
triggering of the TCR may lead to an up-regulation of negative regulatory molecules and an accumulation of inhibitory Treg cells. Programmed death-1 (PD-1; also referred to as CD279) on T cells binds to the programmed death ligand-1 (PD-L1; also referred to as CD274 or B7-H1) on antigen presenting cells (Dong et al., 1999; Iwai et al., 2002). PD-1 plays an important role in regulation of adaptive immune responses. CD8+T cells are more sensitive to the regulation of PD-1 signals, as demonstrated by the delayed hepatic deletion of activated CD8+ T cells and increased expansion and survival of CD8+ T cells in PD-L1-deficient mice (Dong et al., 2004; Latchman et al., 2004). Whereas PD-1and PD-L1 engagement results in T cell apoptosis, altered T cell cytokine production, diminished proliferation, and reduced cytotoxicity of effector T cells (Dong et al., 1999; Iwai et al., 2002; Blank et al., 2004), blocking PD-L1 signaling has been shown to improve antitumor immunity and immunotherapy (Strome et al., 2003; Hirano et al., 2005).
Tim3 is detected in CD8+ T cells and its ligand in regulatory T cells, raising possibility
of modulation of the fate of tumor-specific CD8+ T cells through Tim3 and Tim3 ligand
interaction. It is hypothesized that blocking Tim3 signaling may be shown to improve antitumor immunity and immunotherapy.
11
E. Tumor-specific regulatory T cells in antitumor immunity
The regulatory T cells (CD4+CD25+Foxp3+ T cells, Tregs) are naturally present in the
immune system as in a frequency of ~10% of CD4+ T cells and specifically express the
transcription factor Foxp3 (forkhead box P3 transcription factor). Tregs play an essential role in sustaining self-tolerance and immune homeostasis by suppressing a wide variety of physiologically and pathological immune response against self antigens.
Many studies have revealed that Tregs are engaged in the control of antitumor immune responses. The role of Tregs in tumor immunity was first demonstrated by an experiment in which administration of cell-depleting anti-CD25 monoclonal antibody before tumor inoculation suppresses development of syngenic tumors (Onizuka et al., 1999; Shimizu et al., 1999). Several groups have reported that a large number of Tregs are present in tumors and draining lymph nodes of tumor-bearing mice and patients with a poor prognosis (Bromwich et al., 2003; Webster et al, 2006). Importantly, as the numbers of Tregs increase, the ratio of CD8+ T cells to Tregs decreases in tumors, which suggests that Tregs
may impede antitumor T cell function (Chakraborty et al., 1991; Curiel et al., 2004; Cesana et al., 2006). The removal of Tregs is moderately effective in raising immunity against established tumors. The in vivo depletion of CD4+ T cells or administration of
anti-CD25 monoclonal antibody is suggested as a to remove Tregs but to simultaneously preserve antitumor CD8+ effector T cells (Tanaka et al., 2002;Yu et al, 2005). Furthermore,
combination of CTLA-4 blockade and depletion of Tregs results in maximal tumor rejection (Sutmuller et al., 2001). However the impact of Tregs depletion on the recall
12
response of antitumor memory T cells has not been systematically studied, particularly when combined with antitumor immunotherapy.
13 F. Purposes of this research
TIM3 has been shown to suppress Th1 cell function but the molecular mechanisms underlying TIM3-mediated suppression have not been well studied. Furthermore, the effect of blockade of TIM3 pathway in anti-tumor immunity has not been fully investigated. Therefore, I wanted to investigate the molecular mechanisms for inhibition of T cell function by TIM3 and the effect of blocking TIM3 pathway on tumor growth in mice.
14
II. MATERIALS AND METHODS
A. Cell and cell stimulation
The human Jurkat T cell line was cultured in RPMI1640 medium (Gibco BRL, Paisley, Scotland) supplemented with 10% FBS (Gibco BRL, Paisley, Scotland), 100 U/ml penicillin and 100 μg/ml streptomycin (Gibco BRL, Paisley, Scotland) at 37℃ in 5% CO2.
For Jurkat T cell stimulation, PMA (50 ng/ml, Sigma-Aldrich, St Louis, MO, U.S.A) and A23187 (0.5 μM, Sigma-Aldrich, St Louis, MO, U.S.A) were added to the cell suspensions and incubated for the indicating time at 37℃ in 5% CO2.
B. Mice
The C57BL/6 mice, 6 weeks old, were purchased from Deahan biolink (Chungcheongdo, Korea). All animals were kept under standard condition in a 12 h day/night rhythm with free access to food and water and received humane care in accordance with international guidelines and national law.
Study protocols were reviewed and approved by the Animal Care and Use Committee of Ajou University (Suwon, Korea).
15 C. RNA isolation and cDNA synthesis
The total RNA was isolated from the cultured cells using RNAiso (TAKARA Bio, Inc., Shiga, Japan). The cells were lysed using 500 μl of RNAiso and then incubated on room temperature (RT) for 10 min. After addition of 100 ul of chloroform, the cell lysates were incubated on RT and then spin at 13,000 rpm for 15 min at 4℃. The aqueous phase was transferred into the new tube and isopropanol was added into that tube together for total RNA precipitation. After centrifuge, total RNA pellet was washed by adding 500 μl of 75% ethanol, dried and the dissolved in diethyl pyrocarbonate (DEPC)-containing distilled water (DW). The 1.5 μg of total RNA isolated was used to synthesizing cDNA. The total RNA was mixed with 1ul of oligo dT (0.5 μg/ul, IDT, Coralvile, IA, USA), 1 μl of dNTP (each 2.5 mM, TAKARA Bio Inc., Shiga, Japan) and 13.9 μl of DEPC-DW, then incubated at 65℃ for 5 min. After chilling the tube on ice, 4 μl of 5x first stand buffer, 2 μl of 0.1 M DTT and 0.1 μl of reverse-transcriptase (200 u/l, Invitrogen, Carsbade, CA, USA) were added to the tube, then incubated at 42℃ for 1hr. For stopping enzyme activation, the samples were incubated at 72℃ for 15 min.
D. Construction of plasmids for Tim3-hIg fusion protein expression
The Tim3 gene was cloned from splenocytes of a BALB/c mouse. First, splenocytes (106) were stimulated with Concanavalin A (1 μg/ml) for 2 days, and then, total RNA was
16
RNA was subjected to reverse transcription using RNase H- reverse transcriptase (Invitrogen, Carsbade, CA, USA). The cDNA was amplified using Tim3 specific primers (Tim3forward and Tim3reverse). The PCR products were cloned into pCR2.1-TOPO vector (Invitrogen, Carsbade, CA, U.S.A.) and sequenced. Tim3 gene sequences were registered in NCBI database. The gene encoding the extracellular domain of Tim3 was amplified with specific primers [Tim3-forward(NheI): 5’GCTAGCATGTTTTCAGGT CTTACCCTCAACTGTG-3’ and Tim3-reverse(BglII)): 5’AGATCTTCTGATCGTTTCT CCAGAGTCCTTAATTTCATCAG-3’], and the PCR product was inserted into pIRES2-EGFP vector (Clontech Laboratories, Inc, Mountain View, CA, U.S.A.) using the NheI and
BglII site. The gene encoding IgG1 heavy chain CH2CH3 was amplified using
pTOPO-hIgG1 vector (kind gift of Dr. Kwon, Ajou University, Korea) and the specific primers [HIgC-foward(BglII): 5’-GAAGATCTGCACCTGAACTCCTGGGG-3’ and HIgC-reverse(BamHI): 5’-CGGGATCCTCATTTACCCTGCGACAG-3’]. Using the BglII and
EcoRI site, the PCR product was ligated to pIRES2-EGFP downstream of Tim3 gene. The
nucleotide sequences were verified.
E. Construction of plasmids for flag tagging TIM3 protein
The human TIM3 gene was cloned from peripheral blood mononcytes (PBMC). First, PBMC (106) were stimulated with Concanavalin A (1 μg/ml) for 2 days, and then, total
RNA was extracted by RNA-Bee RNA isolation reagent (Tel-Test, Friendswood, TX, U.S.A.).
17
Total RNA was subjected to reverse transcription using RNase H- reverse transcriptase (Invitrogen, Carsbade, CA, U.S.A.). The cDNA was amplified using human TIM3 specific primers [HTIM3F(KpnI): 5’-GGGGTACCGTTAAAACTGTGCCTAACAG-3’, HTIM3R(HindIII): 5’-CCCAAGCTTCAAAAATAAGGTGGTTGG-3’]. The PCR products were cloned into pGEM-T vector (Promega Co., Madison, WI, U.S.A.) and sequenced. To insert TIM3 gene into pIRES2-EGFP vector, The TIM3 gene was amplified with specific primers [TIM3(XhoI): 5’-CCGCTCGAGTACGAAGTGGAATACAGAGCG GAGG-3’and TIM3(XmaI): 5’-TCCCCCCGGGCTATGGCATTGCAAAGCGACAAC-3’] and the PCR product was inserted into pIRES2-EGFP vector (Clontech Laboratories, Inc, Mountain View, CA, U.S.A.) using the XhoI and XmaII site. And for tagging the leader and flag amino acids to TIM3 protein, the sequence of leader and flag was inserted to pIRES2-EGFP upstream of TIM3 gene using NheI and XhoI sites. The nucleotide sequences were verified. The constructed vectors were named as pIRES2-flag/TIM3.
To construct of lentiviral vector, the gene of leader and flag-TIM3 from pIRES2-flag/TIM3 vector was inserted into the NheI and SwaI sites of pCDH-CMV-MCS-EF1-Puro vector. The constructed vectors were named as pDCH-CMV-TIM3.
To construct the expression vector of TIM3 cytoplasmic mutants, mutation of cytoplasmic tail of TIM3 gene of pIRES3-flag/TIM3 was performed by site-direct mutagenesis kit using specific primers (Stratagene, Santa Clara, CA, U.S.A.). The primers are as follows: hTIM3CPMut3F: 5’-GTAGCAGAGGGAATTCGCTCATAAGAAAAC ATCTATACC-3’, hTIM3CPMut4F: 5’-CATCTATACCATTTAAGAGAACGTATATGAA GTGGAGGAG-3’, hTIM3CPMut5F: 5’-GAAGTGGAGGAGCCCAATTAGTATTATTG
18
CTATGTCAGCAG-3’, hTIM3CPMut6F: 5’-CTATGTCAGCAGCAGGCAGTAACCCTC ACAACCTTTGGG-3’, hTIM3CPMut3R: 5’-GGTATAGATGGTTTCTTATGAGCGAA TTCCCTCTGCTAC-3’, hTIM3CPMut4R: 5’-CTCCTCCACTTCATATACGTTCTCTTA AATGGTATAGATG-3’, hTIM3CPMut5R: 5’-CTGCTGACATAGCAATAATACTAATTG GGCTCCTCCACTTC-3’, hTIM3CPMut6R: 5’-CCCAAAGGTTGTGAGGGTTACTGC CTGCTGCTGACATAG-3’. The flag/TIM3 mutant gene was dissected by the NheI and
SmaI sites and inserted into the NheI and SwaI sites of pCDH-CMV-MCS-EF1-Puro
vector. The constructed vectors were named as pDCH-CMV-TIM3ct36 (the expression vector of TIM3 cytoplasmic mutant containing 36 amino acid from K225 to S260), pDCH-CMV-TIM3ct43 (the expression vector of TIM3 cytoplasmic mutant containing 43 amino acid from K225 to I267), pDCH-CMV-TIM3ct54 (the expression vector of TIM3 cytoplasmic mutant containing 54 amino acid from K225 to N278) and
pDCH-CMV-TIM3ct64 (the expression vector of TIM3 cytoplasmic mutant containing 64 amino acid from K225 to Q288).
F. Establishment of stable cells expressing TIM3 protein
For lentivirus production, the packaging cell line, 293TN cells (Invitrogen, Carsbade, CA, U.S.A.) were transfected with using lipectamine2000 (Invitrogen, Carsbade, CA, U.S.A.) with cloned vector, gag-pol expression vector and VSV-G expression vector. The lentiviral supernatants were collected on 48 hr after transfection, and 1ml of supernatants was used to infect Jurkat T cells adjusted to 106 cells/5 ml complete medium supplemented
19
with polybrene (4 μg/ml). After infection one day, the cells were suspended with fresh medium and incubated for one day, and then, treated with puromycin (0.2 μg/ml, Invitrogen, Carsbade, CA, U.S.A.) for cloned cell selection.
G. Transfection of plasmids
In the case of Jurkat T cells, total 106 cells were transfected with 4.5 μg of plasmid and
0.5 μg of pEGFP-N1 vector by microporator (sigma-Aldrich, St Louis, MO, U.S.A.), using a single pulse of 40 ms at 1200 V. The pulsed cells were incubated in 2 ml complete medium before stimulation.
H. Preparation of enriched mouse and human CD4+ T cells
For enrichment of mouse CD4+ T cells, spleen and lymph nodes from mice were
harvested and single cell suspensions were prepared. Lymphocytes were enriched by lympholyteTM (Cedarlane Lab. Ltd., Burlington, NC, U.S.A.) gradient centrifugation at
2,000 rpm for 20 min. For enrichment of human CD4+ T cells, blood was harvested from
donators and peripheral blood cells were enriched by Ficoll-Plaque gradient centrifugation at 300 g for 40 min. CD4+ T cells were enriched by positive selection with the CD4+ T cell
20 I. Flow cytometric analysis
TIM3-over expression on Jurkat T cells were analyzed with the following antibodies by FACSCantoII (Becton Dickinson, San Diego, CA, U.S.A.): anti-human TIM3-PE (R&D Systems, Minneapolis, MN, USA), anti-Flag (Sigma-Aldrich, St Louis, MO, U.S.A.) and secondary antibody, anti-mouse IgG-PE (ebioscience, Inc., San Diego, CA, U.S.A.).
To confirm of purified CD4+ T cell from mouse lymphocytes and human PBMC, the
following antibodies were analyzed: anti-mouse CD4-APC (ebioscience, Inc., San Diego, CA, U.S.A.), anti-human CD4-APC (BD biosciences, Franklin Lakes, NJ, U.S.A.). Stained cells were analyzed by a BD FACSCantoII system (Becton-Dickinson Co. Franklin Lakes, NJ, U.S.A.).
To sorting of TIM3highCD4+ T cell and TIM3lowCD4+ T cell from human CD4+ T cell,
the cells were stained with anti- human CD4-APC and anti-human TIM3-PE. Stained cells were sorted by a BD AriaII system (Becton-Dickinson Co.Franklin Lakes, NJ, U.S.A.).
The frequency of Tregs in mice was analyzed with the following antibodies by FACSCantoII: anti-mouse CD4-APC, anti-mouse CD25-PE, anti-mouse Foxp3-FITC (ebioscience, Inc., San Diego, CA, U.S.A.).
All antibodies were bound at 4℃ for 30 min. After incubation, cells were washed twice in PBS containing 2% BSA. All data were analyzed with FACSDiva software (Becton-Dickinson Co.Franklin Lakes, NJ, U.S.A.) or WinMD2.8.
21 J. SDS-PAGE and Western blotting
Jurkat T cells (3 x 10⁵) were lysed in 80 μl of lysis buffer (50 mM HEPES, 250 mM
NaCl, 1 mM EDTA, 1 mM DTT, 1% Triton X-100) containing protease inhibitor (Calbiochem, La Jolla, CA, U.S.A.). The concentration of protein was measured by Bradford protein assay. The total lysate was mixed with 20 μl of 5x SDS sample buffer, denaturized at 100℃ for 5 min. The 15~100 μg of protein was loaded in each lane.
Proteins were separated by SDS-PAGE and transferred onto Polyvinylidene difluoride (PVDF) membranes. The indicated antibodies used to probe the membranes are as follows: Anti-Flag monoclonal antibody (Sigma-Aldrich, St Louis, MO, U.S.A.), anti-TIM3 polyclonal antibody (R&D Systems, Minneapolis, MN, U.S.A.), anti-c-Jun Ab (Abcam, Cambridge, UK) and anti-NFAT-1 Ab (BD Biosciences, Franklin Lakes, NJ, U.S.A.). The blots were probed with anti-rabbit IgG or anti-mouse IgG Ab linked to horseradish peroxidase and developed by using chemiluminescence. To ensure equal loading, blots were stripped and then reprobed with anti-β-actin Ab or anti-α-tubulin Ab (Cell Signal Tech, Inc., Danvers, MA, U.S.A.).
K. Real-time reverse-transcript (RT)-PCR
The expression of particular gene in Jurkat T cell lines stimulated with PMA (50 ng/ml) and A23187 (0.5 μM) was examined by real-time PCR. This relative quantification was performed using the ABI PRISM 7000 Sequence Detection System (Applied
22
Biosystems, Foster, CA, U.S.A.). SYBR green Ex Taq Premix (TAKARA Bio, Inc., Shiga, Japan) containing primer sets was used in the PCR. The levels of GAPDH mRNA or CD4 mRNA were measured as an internal standard for calibration. The primers are as follows: human IL-2: forward-5’CAACTCCTGTCTTGCATTGCACTAA-3’ and
revese-5’AATGTGAGCATCCTGGTGAGTTTG-3’, human IFN-γ:
forward-5’CTTTAAAGATGACCAGAGCATCCAA-3’ and reverse-5’GGCGACAGTTCAGCCAT CAC-3’, human c-Jun: forward-5’GGGAACAGGTGGCACAGCTTA-3’ and reverse-5’GCAACTGCTGCGTTAGCATGA-3’, human c-Fos: forward-5’GGGAGCTGACTGAT ACACTCCAAG-3’ and revese-5’TGGCAATCTCGGTCTGCAA-3’, human GAPDH: forward-5’AGGGCTGCTTTTAACTCTGGTAAA-3’ and reverse-5’CATATTGGAACAT GTAAACCATGTAGTTG-3’, human CD4: forward-5’ ATGGATGCAGATCCAGAGGTT TC-3’, reverse-5’GGGCTG TTTGTGCAAGGTCA-3’.
L. Luciferase assay
Total 106 Jurkat T cells were transfected with 4.5 μg of NF-κB, NF-AT or AP-1 –
luciferase reporter plasmids and 0.5 μg of pEGFP-N1 vector by microporator (Sigma-Aldrich, St Louis, MO, U.S.A.), using a single pulse of 40 ms at 1200 V. The pulsed cells were incubated in 2 ml complete medium for 36 hr before stimulation. Cells were stimulated with PMA (50 ng/ml) and A24187 (0.5 μM) for 12 hr. After stimulation, the cells were washed with cold PBS, lysed and assayed luciferase activity (Luciferase Assay System Kit; Promega Co., Madison, WI, U.S.A.). Cells were lysated with 130 μl of lysis
23
buffer and 100 μl of cell lysates were used for luciferase activity assay. The percentage of cells expressing GFP protein was measured by FACSCantoII for calibration of transfection efficiency.
M. ELISA
Culture supernatants were collected for 2 or 3 days following T cell stimulation and IL-2 or IFN-γ level was measured in a sandwich enzyme-linked immunosorbent assay (ELISA; R&D systems, Inc., Minneapolis, MN, U.S.A.) following the manufacturer’s recommendations.
24
III. RESULTS
A. IL-2 transcription is reduced in T cells expressing TIM3
Previously, the function of TIM3 has been explored in autoimmune diseases and severe virus-mediated diseases. Those studies showed that TIM3high T cells failed IL-2 or IFN-γ
production (Jones et al., 2008; Hastings et al., 2009). To confirm these results, enriched CD4+ T cells were stimulated with anti-CD3 and CD28 mAb for 1 week and sorted into
TIM3high and TIM3low cell population (Fig. 1A). Each cell population was re-stimulated with PMA and A23187 for 4 hr and the IL-2 expression was assessed by real-time RT-PCR. Consistent with the previous report, TIM3high CD4+ T cells produced lower amount of IL-2
than TIM3low CD4+ T cells (Fig. 1B).
To study molecular mechanisms that TIM3 expression inhibits IL-2 and IFN-γ production upon CD4+ T cell activation, I established Jurkat T cells-over expressing
flag-tagging TIM3 by lentiviral gene delivery method and then examined whether inhibitory effect of TIM3 expression on IL-2 production can be reproduced in these cells. The TIM3 expression in these cells was demonstrated by flow cytometry using antibodies against to flag tag and TIM3 (Fig. 2A). These cells stimulated with PMA and A23187 for 4 hr were analyzed by real-time RT-PCR and found to be significantly reduced compared to parental Jurkat T cells (Jurkat) and control cells infected with empty lentivirus (ConV) (Fig. 2B). Inhibitory effect of TIM3 expression on IL-2 production was further evaluated by measuring the amount of IL-2 secreted into culture supernatant after stimulation these cells
25
with PMA and A23187 for 2 or 3 days (Fig. 2C). Compatible to transcription level, the amount of secreted IL-2 profoundly decreased in Jurkat T cells-over expressing TIM3. The reduction of IFN-γ secretion could not be demonstrated since IFN-γ was not detected in culture supernatant of any cell line by ELISA. These results indicate that this cell line system is appropriate to explore the mechanism for the inhibitory effect of TIM3 expression on IL-2 and IFN- γ production.
26 A
27
Fig. 1. IL-2 transcription is reduced in primary CD4+ T cells expressing TIM3. CD4+ T
cells were purified from human peripheral blood (N=3) and stimulated with anti-CD3 (1 μg/ml) and anti-CD28 (1 μg/ml) monoclonal Ab one week after stimulation. Cells were stained with APC-anti-human CD4 and PE-anti-human TIM3 Ab and sorted into TIM3high
and TIM3low population by flow cytometry (A). After sorting, each cell population was stimulated for 4 hr with PMA (50 ng/ml) and A24187 (0.5 μM). IL-2 transcript level was analyzed by real-time RT-PCR and normalized to CD4 transcript level. Relative IL-2 transcription level of stimulated cells to unstimulated cells is shown.
28 A
B
29
Fig. 2. IL-2 and IFN-γ transcription is reduced in Jurkat T cells expressing TIM3.
TIM3 expression on the cell surface was analyzed in cell lines: parental Jurkat T cells (Jurkat), Jurkat T cells infected with control lentivirus (ConV), and Jurkat T cells infected with lentivirus expressing flag tagged T cells. These cells were labeled with PE-conjugated anti-TIM3 Ab (left) and anti-Flag Ab (right), respectively and then analyzed by flow cytometry (A). Transcription levels of IL-2 (left) and IFN-γ were analyzed in cells stimulated with PMA (50 ng/ml) together with A23187 (0.5 μM) for 4 h by real-time RT-PCR. Transcript level of IL-2 and IFN-γ, respectively, was normalized to GAPDH transcript level. Relative transcript level in stimulated cells to non-stimulated cells in shown. Data is shown as mean ±SD of three independent experiments (B). IL-2 secretion by cells stimulated with PMA (50 ng/ml) together with A23187 (0.5 μM) for 2 or 3 days were analyzed by ELISA. Data is shown as mean ±SD (C).
30
B. Transcriptional activities of AP-1 and NFAT are reduced in TIM3-over expressing jurkat T cells
Upon T cell activation, IL-2 production is promoted via three major pathways; calcium-NFAT pathway, NF-κB pathway and Ras-MAPK-AP-1 pathway. To determine which of these three pathways are affected by TIM3-over expression, luciferase reporter assay was performed. Luciferase activities were increased in cells transfected with plasmid containing DNA element responsive to NFAT, AP-1 and NF-κB, respectively. Notably, NFAT activity was reduced by 30% and AP-1 activity by 80% in TIM3-over expressing Jurkat T cells compare to controls. However, NF-κB activity was similar between TIM3-over expressing Jurkat T cells and control cells (Fig. 3). These results indicate that TIM3 expression affects activation of NFAT and AP-1, but not of NF-κB.
31
Fig. 3. Transcriptional activities of AP-1 and NFAT are decreased in TIM3-over expressing Jurkat T cells. Cells were transfected with the indicated luciferase activity
plasmid together with pEGFP-N1 for normalization of the transfection efficiency. Thirty-six hr after transfection, the cells were stimulated with PMA (50 ng/ml) and A23187 (0.5 μM) for 12 hr. A part of cell was subjected to flow cytometry for the EGFP expression and the rest of cells to the assay for luciferase activity. Basic: pGL3-Basic luciferase control vector, NFAT: NFAT driven luciferase plasmid, AP-1: AP-1 driven luciferase plasmid, κB: NF-κB driven luciferase plasmid. All data are presented as fold induction relative to pGL3-basic transfector without stimulation. Data is shown as mean±SD of three independent experiments.
32
C. TIM3 expression attenuates the induction of c-Jun in stimulated T cells but not of c-Fos
The finding that AP-1 transcriptional activity is suppressed in TIM3-over expressing Jurkat T cells prompted us to investigate the expression of c-Jun and c-Fos protein, components of AP-1, in these cells after stimulation. First, induction of c-Jun and c-Fos mRNAs was analyzed by real-time RT-PCR. The mRNA levels of c-Fos and c-Jun were increased 30 min after stimulation and declined 1h after stimulation in all cells. The transcript level of c-Fos was similar in TIM3-over expressing Jurkat T cells and control Jurkat T cells 30 min after stimulation but significantly higher in TIM3-over expressing Jurkat T cells than control cells 1hr after stimulation. In contrast the mRNA induction of c-Jun was significantly repressed in TIM3-over expressing Jurkat T cells compared to control ConV cells at all time points after stimulation and to Jurkat T cells 30 min after stimulation (Fig. 4A). C-Jun expression was further evaluated by Western blotting. In accordance with transcriptional level of c-Jun, its protein level was increased 1h after stimulation, and less in TIM3-over expressing Jurkat T cells than control cells. These results imply that TIM3 expression represses c-Jun induction, which then leads to reduced AP-1 activating (Fig. 4B).
33 A
34
Fig. 4. TIM3 expression attenuates the expression of c-Jun but not of c-Fos. Cells were
stimulated with PMA (50 ng/ml) and A24187 (0.5 μM) for the indicated time. The mRNAs levels of c-Jun and c-Fos was analyzed by realtime RT- PCR. All data are presented as fold induction according to transcript level of unstimulated cells, respectively (A). The expression of c-Jun protein in cells stimulated with PMA and A23187 for indicated time was analyzed by Western blotting. β-actin expression was used as a loading control (B). Jurkat: parental Jurkat T cells, ConV: Jurkat T cells infected with control lentivirus, TIM3: Jurkat T cells infected with lentivirus expressing TIM3. Data is shown as mean±SD. *, P<0.02 compared with Jurkat. **, P<0.02 compared with ConV.
35
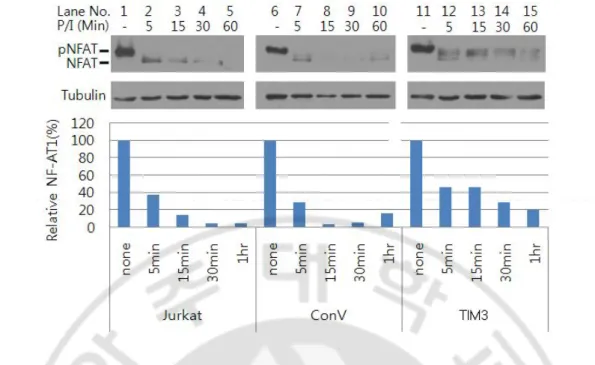
D. TIM3 expression affects the phosphorylation status of NFAT in stimulated T cells
NFAT is a family of highly phosphorylated proteins residing in the cytoplasm of resting cells. When cells are activated, these proteins are dephosphorylated by the calcium/calmodulin-dependent phosphatase calcineurin, translocate to the nucleus, and activate target genes (Kiani et al, 2000; Okamura et al, 2000). To examine whether the defective NFAT transcriptional activity in TIM3-over expressing Jurkat T cells was due to reduced dephosphorylation, the kinetics of NFAT dephosphorylation was analyzed in cytoplasmic fraction of cells stimulated with PMA and A23187 stimulation by Western blotting. A major NFAT band with an apparent molecular weight of 140 kDa was observed in unstimulated cells, indicating that the predominant fraction of NFAT is present in the cytoplasm in a phosphorylated form (Fig. 5 lane 1, 6, 11). After stimulation, smear of bands smaller than NFAT in a phosphorylated form appeared as the band of phosphorylated NFAT disappeared. The amount of dephosphorylated NFAT rapidly increased within 5 min after stimulation, and then decreased in control cells (Fig. 5 lane 2, 7). Whereas, the amount of dephosphorylated NFAT was more slowly decreased and higher in TIM3-over expressing Jurkat T cells than control cells. In addition, compared to control cells in TIM3-over expressing Jurkat T cells (Fig. 5 lane 15), the widening of the dephosphorylated band may reflect the imperfect dephosphorylation of multiple phosphorylation sites on NFAT1 molecule (Tomida et al., 2003). These results indicate that TIM3 expression suppresses NFAT activity by the attenuation of dephosphorylation of NFAT.
36
Fig. 5. TIM3 expression affects dephosphorylation of NFAT. Cells were stimulated with
PMA (50 ng/ml) and A24187 (0.5 μM) for the indicated time and subjected to Western blotting using anti-NFAT1 Ab. α-tubulin expression was used as a loading control. Jurkat: parental Jurkat T cells, ConV: Jurkat T cells infected with control lentivirus, TIM3: Jurkat T cells infected with lentivirus expressing TIM3.
37
E. TIM3 cytoplasmic tail is essential for its inhibitory activity on the expression of IL-2 and IFN-γ
TIM3 molecule has 6 tyrosines of which 5 tyrosines intensively distribute in c-terminal region of the cytoplasmic tail, as it might be responsible for the inhibitory activity of TIM3 (Lee et al., 2009). To identify the important region for the inhibitory activity of TIM3, I generated stable cells expressing TIM3 mutants with deletion in cytoplasm tail (Fig. 6A). The expression of each mutant protein was detected by IP-Western blotting using anti-TIM3 or anti-Flag Ab (Fig. 6B). Two bands were detected in each stable cell lines expression TIM3 mutant; the upper band corresponded to the size of glycosylated form of TIM3 mutant and the lower band to the size of unglycosylated form. These two bands were less clearly detected in Western blotting with anti-Flag Ab due to overlaps of them with Ig heavy chain or light chain. The surface expression of each mutant was demonstrated by flow cytometry using anti-TIM3 Ab. Except TIM3ct64, the expression levels of all mutants were higher than that of wild-type TIM3 (Fig. 6C).
To find the cytoplasmic region of TIM3 important for its inhibitory activity on the cytokine production, the level of IL-2 mRNAs were analyzed in cells expressing mutant TIM3 simulated with PMA and A23187 for 4 hr4. The level of IL-2 mRNA in a cell line expressing TIM3ct36 was similar to control cell lines (Jurkat and ConV), but that respectively was significantly reduced in the cell lines expressing TIM3ct43, ct54 and ct64 (Fig. 7A). Similar results were observed in IFN-γ transcription in these cells (Fig. 7B). IL-2 production was further evaluated by ELISA. The effect of deletion of TIM3
38
cytoplasmic tail compared to controls (Jurkat and ConV) on IL-2 production was significantly suppressed in cells expressing TIM3ct43, 54 and 64, respectively but not in ct36. However, the amount of IL-2 produced by cell lines expressing TIM3ct54 and TIM3ct64, respectively was significantly more than that produced by cell lines expressing TIM3ct43 or wild-type TIM3. Further, IL-2 production in cells expressing TIM3ct64 for 3 days was similar to controls (Jurkat and ConV) (Fig. 7C and D). These data indicate that 7 amino acids from E261 to I267 of c-terminal region of TIM3 are critical for the inhibition of
39 A
B
40
Fig. 6. The expression of TIM3 cytoplasmic tail deletional mutant in stable cell lines. A
diagram of cytoplasmic tail of each TIM3 deletional mutnat (A). The stable cells generated by infection of recombinant lentivirus expressing TIM3 cytoplasmic tail deletional mutant were subjected to immunoprecipitation (IP) using mouse anti-Flag Ab and then to Western blotting (WB) using mouse anti-Flag Ab (Left) or rabbit anti-TIM3 Ab (right). HRP-anti-mouse Ig and anti-rabbit Ig Ab was used as secondary Ab. (B) Surface expression of TIM3 mutant in stable cell lines was analyzed by flow cytometry using PE-anti-TIM3 Ab (C). ConV: Jurkat T cells infected with control lentivirus, TIM3: Jurkat T cells infected with lentivirus expressing wild-type TIM3, TIM3ct36: Jurkat T cells infected with lentivirus expressing cytoplasmic tail deletion mutant containing a.a 36 from K225 to S260, TIM3ct43:
Jurkat T cells infected with lentivirus expressing cytoplasmic tail deletion mutant containing a.a 43 from K225 to I267, TIM3ct54: Jurkat T cells infected with lentivirus expressing
cytoplasmic tail deletion mutant containing a.a 54 from K225 to N278, TIM3ct64: Jurkat T
cells infected with lentivirus expressing cytoplasmic tail deletion mutant containing a.a 64 from K225 to Q288.
41
A
B
C
42
Fig. 7. C-terminal region of TIM3 is required for suppression of the expression of IL-2 and IFN-γ. Cells (106/ml) stimulated for 4hr with PMA (50 ng/ml) and A24187 (0.5 μM) for
4 hr. The transcription levels of IL-2 (A) and IFN-γ (B) were analyzed by real-time RT-PCR. Transcript level of IL-2 and IFN-γ, respectively, was normalized to GAPDH transcript level. Relative transcript level in stimulated cells to non-stimulated cells in shown. IL-2 secretion levels for the indicated time were analyzed by ELISA (C and D). All data are presented as fold induction. Data is shown as mean±SD. *, P<0.05 compared with ConV. **, P<0.005 compared with ct43 and ct54. Jurkat: parental Jurkat T cells, ConV: Jurkat T cells infected with control lentivirus, TIM3: Jurkat T cells infected with lentivirus expressing wild-type TIM3, ct36: Jurkat T cells infected with lentivirus expressing cytoplasmic tail deletion mutant containing a.a 36 from K225 to S260, ct43: Jurkat T cells infected with lentivirus expressing cytoplasmic tail deletion mutant containing a.a 43 from K225 to I267, ct54: Jurkat T
cells infected with lentivirus expressing cytoplasmic tail deletion mutant containing a.a 54 from K225 to N278, ct64: Jurkat T cells infected with lentivirus expressing cytoplasmic tail
43
F. C-terminal region of TIM3 is essential for suppression of transcriptional activity of AP-1 and NFAT
Because TIM3 negatively regulated activities of AP-1 and NFAT, I examined whether the TIM3 c-terminal region required for down-regulation of IL-2 expression is involved in modulation of activities of AP-1 and NFAT. The luciferase reporter plasmid containing the responsive elements to AP-1 or NFAT was transfected into cells expressing mutant TIM3 and the luciferase activity was assessed 12 hr after stimulation with PMA and A23187. AP-1 activity was suppressed in cells expressing TIM3ct43 and TIM3ct54 but not in cells expressing TIM3ct36 and TIM3ct64. On the other hand, NFAT activity was significantly inhibited in cells expressing TIM3ct54 and TIM3ct64 but not in cells expressing TIM3ct36 and TIM3ct43 (Fig. 8). Taken together, these results suggest that c-terminal region of TIM3 is required for inhibition of AP-1 activity and the 11 a.a from E268 to N278 of c-terminal region of TIM3 for inhibition of NFAT activity.
44 A B
Fig. 8. C-terminal region of TIM3 is essential for regulatory activity of AP-1 and NFAT transcriptional activity. Cells were transfected with a luciferase reporter vector containing
responsive element to AP-1 (left) or NFAT (right) and left stimulated with PMA (50 ng/ml) and A23187 (0.5 μM) 36 hr after transfection. Luciferase activity was assessed after 12 hr. pEGFP-N1 (1/10 of the amount of luciferase reporter vector) was co-transfected into cells to normalize the transfection efficiency. EGFP expression was analyzed by flow cytometry. All data are presented as fold induction relative to luciferase activity of unstimulated each cell. Data is shown as mean±SD. *, P<0.005 compared with Jurkat T cells. Jurkat: parental Jurkat T cells, ConV: Jurkat T cells infected with control lentivirus, TIM3: Jurkat T cells infected with lentivirus expressing wild-type TIM3, ct36: Jurkat T cells infected with lentivirus expressing cytoplasmic tail deletion mutant containing a.a 36 from K225 to S260, ct43: Jurkat
T cells infected with lentivirus expressing cytoplasmic tail deletion mutant containing a.a 43 from K225 to I267, ct54: Jurkat T cells infected with lentivirus expressing cytoplasmic tail
deletion mutant containing a.a 54 from K225 to N278, ct64: Jurkat T cells infected with
45
G. Tim3-hIg expressed in tumor cells inhibits in vivo tumor growth
Recent studies revealed that administration of Tim3-hIg protein blocks Tim3 and Tim3 ligand, suggesting the up-regulation of Th1-driven immune response. Th1-driven immune response is involved in cytotoxic T lymphocyte activation in tumor immunity. But the involvement of Tim3 protein in tumor protection has not been well studied. Therefore, I examined whether the inhibition of Tim3 pathway affect tumor suppression. First of all, the stable cell clones secreting Tim3-hIg were established. 3LL cells, Lewis lung cancer cell line, were transfected with eukaryotic Tim3-hIg- or hIg- and bicistronic enhanced green fluorescent protein (EGFP) expression plasmid and then the clones were selected by limiting dilution. The Tim3-hIg or hIg expression was confirmed indirectly as detecting EGFP expression by flow cytometry (Fig. 9A) and mRNA transcripts by RT-PCR method (Fig. 9B).
To assess the blockage effects of Tim3-hIg in in vivo tumor growth, each cell clones were inoculated subcutaneously into the lesion of C57BL/6 mice and then the tumor growth was measured for 3 weeks. The tumor growth rate of clones secreting Tim3-hIg (T1 and T2) was lower than control clones (G1and G2: clone expressing EGFP, H2 and H3: clone secreting hIg) (Fig. 9C). Although, the in vitro cell growth of H2 and H3 was faster than G1 and G2 (Fig. 9D), the tumor growth of H2 and H3 in mice was behind of G1 and G2, which imply that tumor growth was not directly determined by in vitro cell growth rate. Therefore, these results suggest that reduced tumor growth rate of clones T1 and T2 could be due to the expression of Tim3 pathway inhibitor, Tim3-hIg.
46 A
B
47
Fig. 9. Tim3-hIg inhibits in vivo tumor growth. For establishment of 3LL cells secreting
either Tim3-hIg or hIg, 3LL cells were transfected with either pIRES2-Tim3-hIg or pIRES2-hIg plasmid and selected by treatment of neomycin (2 μg/ml). 3LL-derived cell lines were confirmed by GFP expression by flow cytometry. CON: parental 3LL cells; G1 and G2: 3LL cells expressing GFP; H1, H2 and H3: 3LL cells secreting hIg protein; T1, T2: 3LL cells secreting Tim3-hIg (A). Tim3-hIg or hIg transcript was analyzed by RT-PCR. Specific primers for Tim3-hIg and hIg, respectively, were used (B). The mice (4 heads per each cell line) were injected subcutaneously with 5 X 10⁵ of the indicated stable cell lines
in 100 μl of PBS. Every two days after injection, tumor size was measured by caliper gauge (C). The growth rate of each clone was measured by MTT assay in vitro culture system. Total cell number was calculated using standard curve with known cell numbers (D). Data is shown as mean±SD. Representative data from two independent experiments are shown.
48
H. Tim3-hIg increases the efficacy of prophylactic tumor vaccine
I next examined whether prophylactic tumor vaccination with cells expressing Tim3-hIg suppress tumor growth. First, 3LL cells were transfected with plasmid expressing Tim3-hIg or hIg, treated with mitomycin (50 μg/ml) to prevent proliferation with G1 cells. After treatment of mitomycin, cell viability was verified by trypan blue staining and cultivation for 2 days. In capability of mitomycin-treated cells to develop a tumor was also verified. The transfection efficiency was monitored by flow cytometry for detecting EGFP expression (Fig. 10A). The secretion of Tim3-hIg and hIg was demonstrated by IP-WB (Fig. 10B) and then used as prophylactic tumor vaccine.
Ten days after immunization, the mice were challenged with G1 cells and then, tumor growth was measured for 3 weeks. The tumor growth was reduced significantly in the mice immunized with 3LL transfectants secreting Tim3-hIg compared with mice immunized with 3LL transfectants secreting hIg or control mice from 14 days after tumor challenge (p< 0.005, Fig. 10C). These results suggest that Tim3-hIg may enhance the efficacy of prophylacitic tumor vaccine and the blockage of Tim3 and Tim3 ligand may promote antitumor memory response.
49 A B
C
Fig. 10. Tim3-hIg increases the efficacy of prophylactic tumor vaccine. 3LL cells were
transfected with plasmid expressing either Tim3-hIg or hIg together with EGFP. Transfection efficiencies of cells were determined by detection of EGFP using flow cytometry (A). The Tim3-hIg and hIg protein, respectively in culture supernatant of transfected cells were detected by Western blotting using anti-human Ig Ab (B). The mice were vaccinated s.c. with 6 x 10⁵ 3LL cells transfected with plasmid expressing either Tim3-hIg or hIg 36 hr
before vaccination and treated with mitomycin for prevention of proliferation. The mice were inoculated with G1 cells in 100 μl PBS 10 day after vaccination Every two days after injection, tumor size was measured (C). PBS: mice injected with PBS; hIg: mice vaccinated with 3LL cells secreting hIg; Tim3-hIg: mice vaccinated with 3LL cells secreting Tim3-hIg. Data is shown as mean±SD from two independent experiments. *, P <0.002 between hIg and Tim3-hIg.
50
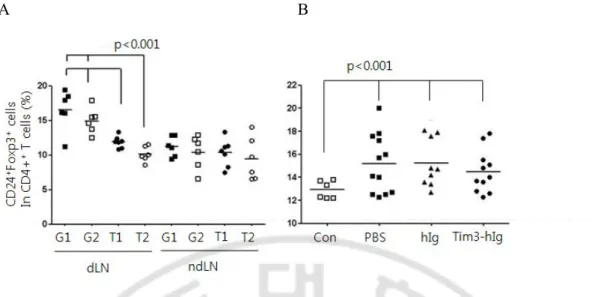
I. The frequencies of CD4+CD25+Foxp3+ regulatory T cells in mice injected with Tim3-hIg expressing tumor cells
The regulatory T cells (Tregs) expressing a CD4+CD25+Foxp3+ phenotype have been
associated with suppression of antitumor immune responses. Several groups have reported that a large number of Tregs are present in tumors and draining lymph nodes of mice as well as in patients with a poor prognosis (Bromwich et al., 2003; Webster et al, 2006). To monitor whether Tregs frequency is affected by the blockage of Tim3 pathway, in tumor-draining lymph nodes of mice, the frequency of Tregs was detected using 3-color flow cytometry. The proportion of Tregs in draining lymph node of mice bearing tumor expressing Tim3-hIg was significantly descended, comparing with G1- or G2-bearing mice 3 weeks after tumor-challenge (Fig. 11A). To determine whether the decreased frequency of Tregs was the result of direct modulation by Tim3-hIg or a reflection of the reduced tumor mass, I analyzed the frequency of Tregs in LNs of mice 10 day after tumor challenge when tumor growth was vaccinated with tumor cells expressing either Tim3-hIg or hIg (Fig. 11B). The draining lymph node of mice vaccinated with Tim3-hIg secreting Tim3-hIg harbored similar level of Tregs compared to control mice vaccinated with 3LL secreting hIg or injected with PBS. However, the frequency of Tregs was significantly increased in mice bearing a tumor compared to the tumor-free normal mice (p < 0.05). These results suggest that Tim3-hIg may reduce the frequency of Tregs indirectly through the inhibition of tumor growth.
51
A B
Fig. 11. The frequencies of CD4+CD25+Foxp3+ regulatory T cells in mice given Tim3-hIg expressing tumor cells. The frequenccies of Tregs were assessed in lymph-node of mice
(23 day) after s.c. injection of the indicated tumor cells. The cells isolated from draining LN (dLN) and non-draining LN (dLNs) were labeled with APC-anti-CD4, PE-anti-CD25 and FITC-anti-Foxp3 antibody and analyzed with flow cytometry. G1, G2: 3LL cells stably expressing GFP protein; T1, T2: 3LL cells stably expressing Tim3-hIg and GFP protein (A). The mice were vaccinated s.c. with PBS only, mitomycin-treated cells secreting either hIg or Tim3-Ig cells. Ten days after the mice were injected s.c. with G1 tumor cells. The lymph-nodes were isolated on 10 day after tumor challenge (B). CON: normal mice; PBS: mice injected with 100 μl of PBS; hIg: mice injected 3LL cells transiently expressing hIg protein; Tim3-hIg: mice injected with 3LL cells transiently expressing Tim3-Ig protein. Each symbol represents each mouse (6-12 heads per group). Data is shown as mean±SD.
52
J. Tim3-hIg expression marginally enhances the efficacy of the therapeutic tumor vaccine but not of the chemotherapy
Prophylactic tumor vaccine expressing Tim3-hIg was shown to be effective to suppression of tumor progression. Therefore I examined whether therapeutic tumor vaccine expressing Tim3-hIg would be an therapeutic modality. Tumor-bearing mice were injected with 3LL cells expressing which were mitomycin-treated and expressing either Tim3-hIg or hIg day 7 and day 16 after tumor challenge. Although tumor progression was similar i mice vaccinated with cells expressing Tim3-hIg or hIg, the tumor size of mice vaccinated with 3LL cells expressing Tim3-hIg was significantly smaller than control mice (p < 0.05 on day 8, 14, 20 and 21, Fig. 12A).
To evaluate whether a therapeutic tumor vaccine expressing Tim3-hIg might enhance the efficacy of chemotherapy, the tumor-bearing mice were administered with 5-FU on day 9 and day 11 after tumor challenge, and then with mitomycin-treated cells expressing Tim3-hIg on day 11 and on day 13. Tumor growth was markedly reduced in mice administered with 5-FU, however, there was no significant difference between mice administered with 5-FU alone and administered subsequently with cells expressing Tum3-hIg in addition on 5-FU. Using this protocol, there was a tendency for decreased tumor growth in mice vaccinated with cells expressing Tim3-hIg compared to control mice, however, the difference in growth was not statistically significant (Fig. 12B). These results suggest that Tim3 pathway inhibition can enhance the efficacy of therapeutic tumor vaccine depending on the administration protocol.
53
A B
Fig. 12. Tim3-hIg expression marginally enhances the efficacy of the therapeutic tumor vaccine but not of the chemotherapy. Mice were injected with G1 tumor cells. For
construction of tumor vaccine, 3LL cells transfected with either pIRES2-Tim3-hIg or pIRES2-hIg and treated with mitomycin (5 μg/ml). Mice with G1 tumors were treated with either Tim3-hIg secreting 3LL-tumor vaccine (Tim3-hIg), hIg (hIg) or left without tumor vaccine on 7 and 16 day (A). Mice with G1 tumors were injected with either 5-FU (70 μg/kg) on 9 and 11 day, or Tim3-hIg secreting 3LL cells (6 x 10⁵) on day 11 and day 13.
Another mice were injected with Tim3-hIg combined with 5-Fu on same date. PBS: mice were not vaccinated, injected only PBS; hIg: mice injected with 3LL cells secreting hIg; Tim3-hIg: mice injected with 3LL cells secreting Tim3-hIg. Every 2 days after injection, tumor size was measured by caliper gauge. Data is shown as mean±SD. *, P <0.002 between PBS and Tim3-Ig. Representative data from two independent experiments are shown.