http://dx.doi.org/10.3988/jcn.2012.8.1.35 J Clin Neurol 2012;8:35-42
Introduction
Mismatch negativity (MMN) is an early auditory event-relat-ed potential (ERP) that is elicitevent-relat-ed when infrequent (“devi-ant”) sounds occur in a sequence of repetitive (“standard”) sounds even in the absence of attention to these sounds.1
MMN is defined as the difference between the response to a stimulus presented as a deviant under one condition, and the response to the same stimulus presented as a standard in a separate measurement. This negative component of the
audi-tory ERP, which usually peaks at 150-250 ms from the change onset, is known to be a component of primitive intel-ligence originating from the auditory cortex.2 MMN is
thoug-ht to be generated by an automatic cortical change-detection process, during which a difference is found between current in-put and the representation of regular aspects of the preceding auditory input.3
ERP analyses conventionally focus on mean amplitude differences under the implicit assumption that from trial to trial, all neuronal activity of interest is evoked by the stimu-lus in a time-locked manner. However, focusing on evoked activity might result in useful information available from si-ngle EEG trials being overlooked.4 Recent studies using
sin-gle-trial analyses have suggested that ERP components can largely be explained by the partial phase resetting of ongoing
Theta Oscillation Related to the Auditory Discrimination Process
in Mismatch Negativity: Oddball versus Control Paradigm
Deokwon Ko,a Soyoung Kwon,a Gwan-Taek Lee,a Chang Hwan Im,b Kyung Hwan Kim,c Ki-Young Junga
aDepartment of Neurology, Korea University Medical Center Anam Hospital, Korea University College of Medicine, Seoul, Korea bDepartment of Biomedical Engineering, Hanyang University, Seoul, Korea
cDepartment of Biomedical Engineering, Yonsei University, Wonju, Korea
Received May 20, 2011 Revised June 29, 2011 Accepted June 29, 2011 Correspondence Ki-Young Jung, MD, PhD Department of Neurology, Korea University Medical Center Anam Hospital, Korea University College of Medicine, 73 Inchon-ro, Seongbuk-gu, Seoul 136-705, Korea Tel +82-2-920-6649 Fax +82-2-925-2472 E-mail [email protected]
Background and PurposezzThe aim of this study was to identify the mechanism underlying the auditory discriminatory process reflected in mismatch negativity (MMN), using time-fre-quency analysis of single-trial event-related potentials (ERPs).
MethodszzTwo auditory tones of different probabilities (oddball paradigm) and the same prob-ability (control paradigm) were used. The average dynamic changes in amplitude were evaluat-ed, and the in-phase consistency of the EEG spectrum at each frequency and time window across trials, event-related spectral perturbations (ERSPs), and inter-trial phase coherence (ITC) were computed.
ResultszzSubtraction of the ERPs of standard stimuli from the ERPs of deviant stimuli re-vealed a clear MMN component in the oddball paradigm. However, no discernible MMN com-ponent was observed in the control paradigm. Statistical tests showed that in the oddball para-digm, deviant tones produced significant increases of theta ERSPs and ITC at around 250 ms as compared with the standard tone, while no significant difference between the two stimuli was observed in the control paradigm.
ConclusionszzOur results confirm that the auditory discriminatory process reflected in MMN is accompanied by phase resetting and power modulation at the theta frequency.
J Clin Neurol 2012;8:35-42 Key Wordszz event-related potential, mismatch negativity, auditory discrimination,
event-related spectral perturbations, inter-trial phase coherence.
Open Access
cc This is an Open Access article distributed under the terms of the
Cre-ative Commons Attribution Non-Commercial License (http://creCre-ative- (http://creative-commons.org/licenses/by-nc/3.0) which permits unrestricted non-com-mercial use, distribution, and reproduction in any medium, provided the ori-ginal work is properly cited.
activity in restricted frequency bands5-8 in addition to the
mo-dulation of amplitude. Thus, investigating certain oscillatory characteristics of ERP components may provide additional information compared with that obtained in averaged ERP analysis.
Fuentemilla et al.9 recently used time-frequency analysis
of single-trial ERPs to demonstrate that MMN is due to a combination of increased theta power and phase resetting for deviant trials. They also found that amplitude modulation and phase-resetting mechanisms depend upon the source lo-cation of the MMN. Hsiao et al.10 revealed in a
magnetoen-cephalography (MEG) study that phase-locked theta oscilla-tion during a passive oddball paradigm is associated with auditory change detection. Thus, these two studies clearly demonstrated that theta oscillation at around 100-250 ms af-ter stimulation might be associated with the auditory discri-mination process reflecting MMN.
However, since both previous studies used the oddball pa-radigm, where stimuli with different physical properties are presented with different probabilities, it is not clear which factor is related to the elicited theta oscillation. To address this issue, we compared power and phase resetting of theta oscillation between an oddball paradigm and a control condi-tion.11,12 Under the latter condition (henceforth referred to as
the control paradigm), the two tones used in the oddball par-adigm were presented with the same probability.
The aims of the present study were to identify theta oscil-lations in response to deviant auditory stimuli reflecting MMN in a passive oddball paradigm and, using a control paradigm, to verify that theta oscillations elicited by the oddball para-digm are not due to physical differences between the stimuli.
Methods
ParticipantsThirteen healthy, right-handed university students (six males, aged 23.31±1.60 years, mean±SD) participated in this study. Each subject gave written informed consent to participate. The experimental protocol was approved by the Institutional Review Board of Korea University Medical Center.
EEG recording
EEGs were recorded using a 32-channel digital EEG device (Grass Neurodata Acquisition System Model 12, Grass Tech-nologies, Quincy, MA, USA) with 27 electrodes that were placed on the scalp according to the international 10-20 sys-tem, with extended coverage of the lower temporal region (F9/10, T9/10, and P9/10). The reference electrode was set to Pz. Electrode impedance was kept below 5 kΩ. The band-pass filter setting was 0.1 to-100 Hz, with a sampling rate of
400 Hz. Two electrooculography channels (placed on the left and right outer canthi) were added to confirm eyeball move-ments and to allow electrooculography artifacts to be remo-ved. The participant sat in a comfortable chair and listened to the presented sounds through earphones.
Stimuli and procedure
Pure tones (90 dB spatial pulse length) were generated using a commercial program (Cool Edit Pro V.2.1, Adobe Systems, San Jose, CA, USA), and the oddball paradigm was designed using Presentation (V.11.0, Neurobehavioral Systems, Alba-ny, NY, USA). Subjects were instructed to read a book and to ignore the auditory stimuli during the task. The oddball paradigm was based on sequences of two tones, each starting on a random basis, either with a 1000-Hz standard (p=0.8; n=960) tone followed by a 1030-Hz deviant (p=0.2; n=240) tone, or vice versa. The tone duration was 100 ms, with rise and fall times of 10 ms, and the inter-stimulus interval was 1000 ms. Each subject received three blocks of an auditory oddball task, containing a mix of 400 tones.
The control paradigm was performed in seven of the sub-jects (aged 23.43±0.79 years, mean±SD) who had complet-ed the oddball paradigms. This experiment was designcomplet-ed to establish that auditory discrimination is not merely generated by physical differences between sounds. The same tones used in the oddball paradigm (1000 and 1030 Hz) were pre-sented randomly, each with a probability of 0.5. In the con-trol paradigm, we assigned the 1000-Hz tone as the standard stimulus and the 1030-Hz tone as the deviant stimulus. Average ERP analysis
EEG data were analyzed using EEGLAB version 6.01b,13
which is an open source toolbox operated in the MATLAB environment (version 7.01, MathWorks, Natick, MA, USA). EEG data were referenced to average references. The band-pass filter was set to 0.5-50 Hz. Epochs were then extracted, with a time window of -200 to +800 ms from stimulus onset. Baselines were corrected by subtracting the root mean square of the prestimulus interval from the whole length of the epoch. All data epochs from each subject were assembled and sub-jected to Infomax independent component analysis, with a bli-nd source separation. A 27×27 unmixing square matrix was identified by independent component analysis, with the re-moval of 1 to 3 independent components that were responsi-ble for eye-blinking.14 Other components were not removed
from the original EEG data sets because of the possibility of unintentionally erasing significant signals. After removing blinking components, the remaining independent compo-nents were back-projected to construct a new EEG data set, which was then used for further analysis. Epochs containing
any artifacts caused by muscle contraction and movement were then deleted.
The ERP data were averaged with the sweep from 200 ms before to 800 ms after stimulus onset. N1 and N2 compo-nents were identified as the largest negative deflections in the time windows 70-140 ms and 170-270 ms following the au-ditory stimuli, respectively. The MMN component was ob-tained by subtracting the ERP response to standard tones from that to deviant tones. The MMN component was thus identified as the most negative peak between 150 and 250 ms following auditory stimuli. The latencies and amplitudes of each ERP component were measured relative to the prestim-ulus baseline period. A scalp mapping of voltage topography was obtained from -25 to +25 ms at the peak of each ERP component.
Event-related spectral perturbation and inter-trial phase coherence
To evaluate average dynamic changes in in-phase consisten-cy and in the amplitude of EEG spectra at each frequenconsisten-cy and time window across trials, we calculated event-related spectral perturbations (ERSPs) and inter-trial phase coher-ences (ITCs) using the EEGLAB package.15,16 ERSPs
mea-sure average dynamic changes in the amplitude of a broad-band EEG frequency spectrum as a function of time relative to an experimental event:13
(1) where, for n trials, Fk(f, t) is the spectral estimate of trial k at frequency f and time t. The ITC is a measure of the consis-tency of the EEG spectral phase at each frequency and laten-cy window across trials:
(2)
To compute these measures, each single-trial ERP time se-ries was transformed to a baseline-normalized spectrographic image using a moving-window average of FFT spectra. The output comprised 32 amplitude estimates, with a frequency bin width of 1.56 Hz (from 1.56 to 50.00 Hz).
Statistical analysis
As the topographic distribution of ERP, ERSP, and ITC ues was maximal at both frontocentral regions, averaged val-ues from the frontocentral electrodes (F3, Fz, F4, C3, Cz, and C4) for each subject were used in the statistical analysis. The amplitude and latency differences of each ERP compo-nent between standard- and deviant-elicited responses were estimated with a nonparametric Wilcoxon signed-rank test.
Results
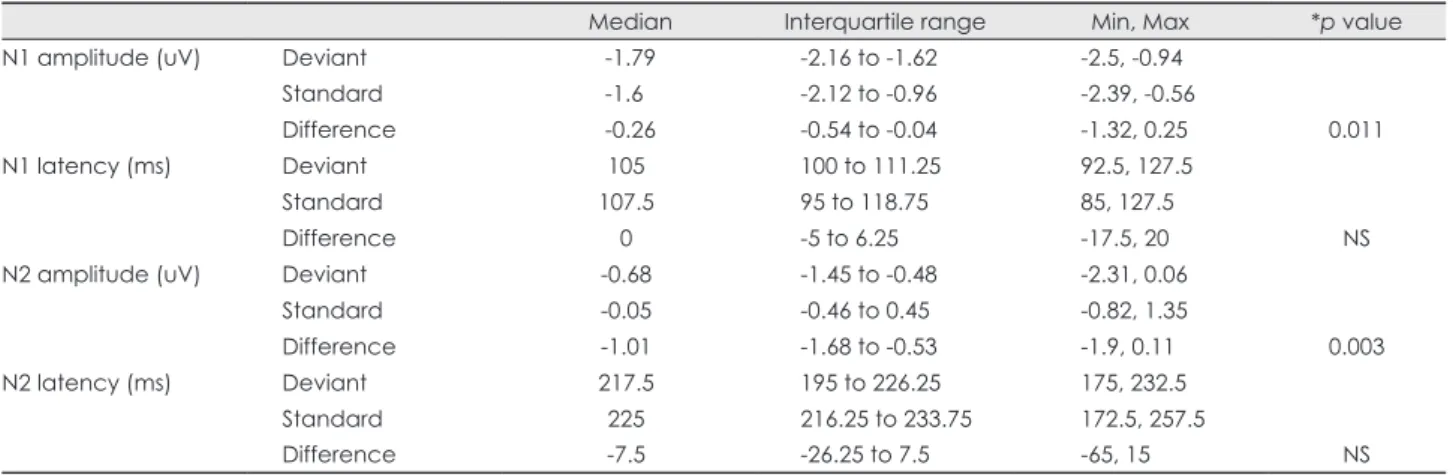
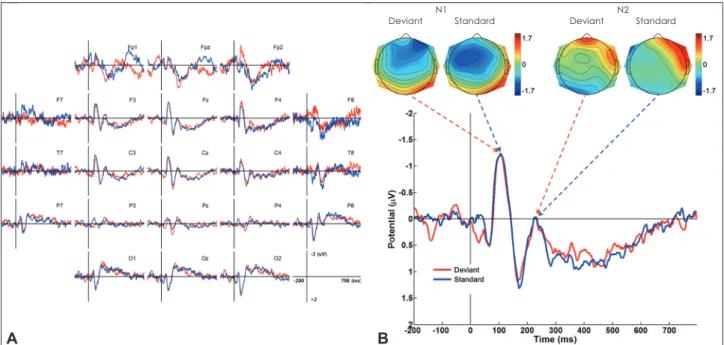
Average ERPOriginally 20 subjects were recruited for the study, but 7 of them were excluded because they did not show a clear MMN component at the frontal electrodes. Thus, data from 13 sub-jects were analyzed further in the present study. Grand aver-age waveforms and spatial distributions of ERPs in the odd-ball paradigm in response to auditory stimuli are shown in Fig. 1. In the oddball paradigm the MMN was clearly identi-fied, and it had a peak latency of 190 ms. The Wilcoxon sign-ed-rank test showed that the latencies of the N1 and N2 compo-nents did not differ significantly between the stimuli. However, the amplitudes of deviant N1 and N2 components were signifi-cantly larger than those of the standard ones (Table 1).
In the control paradigm, N1 amplitudes and latencies did not differ between the two stimuli (Table 2). In addition, no significant difference was observed for different types of au-ditory stimuli in terms of the amplitude and latency of N2 components. No discernible MMN component was observed with the control paradigm (Fig. 2).
Time-frequency analysis of single-trial ERPs Since ERSPs and ITCs may depend strongly on the number of trials, the trial number of both conditions was matched be-tween paradigms. The spatial distribution of ERSPs and ITCs exhibited frontocentral predominance (Figs. 3 and 4, respectively), and so only data from the Fz electrodes are presented at the individual level. Figs. 3 and 4 show ERSPs and ITCs at the Fz electrode for each auditory stimulus of the oddball and control paradigms.
Comparison of ERSPs and ITCs during the pre- and poststimulus periods
To determine whether ERSPs and ITCs increase significantly during task execution as compared with the prestimulus baseline at individual electrode locations for each subject, a bootstrap method with 200 repetitions was used to compute significant changes (p<0.001) from the distributions of ERSP and ITC values from surrogate data windows drawn at ran-dom from the same data epochs.17
For ERSPs in the oddball paradigm, time-frequency analy-sis of single-trial ERPs revealed that ERSPs increased signif-icantly from 3 to 12 Hz following standard sound stimuli at around 120 ms (Fig. 3A). The ERP response to deviant tones exhibited an elevated ERSP from 3 to 12 Hz at around 250 ms in addition to an early response at 120 ms after auditory stimulation (Fig. 3B). In contrast to the oddball paradigm, no significant ERSP changes to either standard (1000 Hz) or de-viant (1030 Hz) sound stimuli were noted for the control n 1 k=1 n ERSP (f, t)=
∑
|Fk (f, t)|2 n 1 k=1 n ITC (f, t)=∑
|FkFk (f, t) (f, t)|Table 1. Comparison of amplitude and latency between deviant and standard in oddball paradigm
Median Interquartile range Min, Max *p value
N1 amplitude (uV) Deviant -1.79 -2.16 to -1.62 -2.5, -0.94
Standard -1.6 -2.12 to -0.96 -2.39, -0.56
Difference -0.26 -0.54 to -0.04 -1.32, 0.25 0.011
N1 latency (ms) Deviant 105 100 to 111.25 92.5, 127.5
Standard 107.5 95 to 118.75 85, 127.5
Difference 0 -5 to 6.25 -17.5, 20 NS
N2 amplitude (uV) Deviant -0.68 -1.45 to -0.48 -2.31, 0.06
Standard -0.05 -0.46 to 0.45 -0.82, 1.35
Difference -1.01 -1.68 to -0.53 -1.9, 0.11 0.003
N2 latency (ms) Deviant 217.5 195 to 226.25 175, 232.5
Standard 225 216.25 to 233.75 172.5, 257.5
Difference -7.5 -26.25 to 7.5 -65, 15 NS
*Wilcoxon signed-rank test.
Max: maximum, Min: minimum, NS: not significant.
Table 2. Comparison of amplitude and latency between deviant and standard in control paradigm
Median Interquartile range Min, Max *p value
N1 amplitude (uV) Deviant -1.49 -1.97 to -1.04 -2.17, -0.78
Standard -1.57 -1.97 to -1.33 -2.34, -0.94
Difference 0.09 -0.1 to 0.24 -0.64, 0.95 NS
N1 latency (ms) Deviant 105.83 97.08 to 108.33 92.5, 113.33
Standard 104.58 95.83 to 108.33 87.08, 111.67
Difference 2.08 -5.83 to 5.0 -7.5, 5.42 NS
N2 amplitude (uV) Deviant -0.49 -0.83 to 0.05 -1.31, 0.08
Standard -0.51 -1.07 to -0.07 -1.49, 0.09
Difference 0.15 -0.04 to 0.24 -0.19, 0.26 NS
N2 latency (ms) Deviant 230.0 224.17 to 242.92 220.42, 247.08
Standard 227.92 214.58 to 245.83 205.42, 254.17
Difference -2.92 -7.5 to 9.58 -13.33, 35.42 NS
*Wilcoxon signed-rank test.
Max: maximum, Min: minimum, NS: not significant.
A B
Fig. 1. A: Grand averages showing N1 and N2 components evoked by a standard and a deviant stimulus in the oddball paradigm. The MMN is clearly elicited by subtracting the ERP evoked by a standard stimulus from the ERP evoked by a deviant stimulus. B: Voltage topographic map-ping of each ERP component. ERP: event-related potential, MMN: mismatch negativity.
paradigm.
For ITCs in the oddball paradigm, the standard response exhibited a significant ITC increase from 3 to 12 Hz at 120 ms following auditory stimulation (Fig. 4A). The deviant re-sponse gave rise to a significant ITC increase from 3 to 12 Hz at 250 ms in addition to a significant increase at 120 ms (Fig. 4B). For the control paradigm, both standard (1000 Hz) and deviant (1030 Hz) tones gave rise to a significant ITC increase of 2-12 Hz at around 120 ms. However, deviant
tones did not induce any change in ITC at around 250 ms, as in the control paradigm.
Comparison between the ERSPs/ITCs of standard and deviant stimuli
The ERP responses to standard and deviant sounds were compared across subjects by subtracting ERSPs and ITCs of standard responses from those of deviant responses. The re-sults of the topographic mapping of these differences are
de-A B
Fig. 2. A: Grand averages showing N1 and N2 components evoked by a standard and a deviant stimulus in the control paradigm. There is no discernible MMN component in the control paradigm. B: Voltage topographic mapping of each ERP component. ERP: event-related potential, MMN: mismatch negativity.
Deviant N1 Standard Deviant N2 Standard
Fig. 3. ERSP in response to standard (A) and deviant (B) tones, and the differ-ence between the two (C) in the oddball (upper row) and control (lower row) par-adigms at the Fz electrode. The color of each image pixel indicates a significant change (p<0.001) of power (in dB) at a given frequency and latency relative to the baseline period (200 ms prior to stimulus onset). Note that the box in (C) indicates the TFOI for further statistical analysis. Topographic distributions of ERSPs from this box are depicted. ERSP: event-related spectral perturba-tions, TFOI: time-frequency of interest.
A B C
Standard
Oddball
Control
picted in Figs. 3 and 4. For the oddball paradigm, ERSP dif-ferences between deviant and standard single-trial ERPs showed that deviant tones produced an ERSP that was 4-10 Hz higher at around 250 ms than the standard tones (Fig. 3C). Differences between the ITCs of deviant and standard single-trial ERPs in the oddball paradigm demonstrated that deviant sound produced an ITC that was increased by 4-10 Hz at 250 ms (Fig. 4C). Neither the ERSPs nor ITCs differed significantly in the control paradigm.
ERSP and ITC values of the time-frequency of interest (TFOI) identified during the analysis described above (the box in Figs. 3C and 4C) were subjected to statistical analysis using the Wilcoxon signed-rank test. The TFOI was 4.69-10.94 Hz at 223.6-295.4 ms for ERSPs and 4.69-4.69-10.94 Hz at 236.3-295.4 ms for ITCs. An averaged value from six fron-tocentral leads was calculated for each subject. The Wilcox-on singed-rank test showed that ERSP (p=0.028) and ITC (p=0.003) were significantly larger for deviant tones than for the standard tone (Table 3). As found for the control
para-digm, no significant TFOI was identified, and thus, no fur-ther statistical analysis was performed.
Discussion
We investigated the oscillatory characteristics of auditory discrimination by applying time-frequency analysis to sin-gle-trial ERPs. In the present study, average ERP analysis demonstrated that while deviant stimuli in the oddball para-digm clearly elicited MMN components, the standard tone did not. Time-frequency analysis of single-trial ERPs re-vealed that both power and phase modulations in the theta frequency band were significantly increased at around 120 ms for both standard and deviant stimuli. Additional theta power (ERSP) and phase modulation (ITC) were observed at around 250 ms only in response to the deviant stimulus. ERSP is a plot of the baseline-normalized spectrogram that enables visualization of mean event-related changes in spec-tral power over time over a broad frequency range. ITC is a Table 3. Comparison of ERSP and ITC between deviant and standard in oddball paradigm
Median Interquartile range Min, Max *p value
ERSP (dB) Deviant 0.45 0.14 to 0.77 -0.37, 2.25 Standard -0.06 -0.3 to 0.5 -0.75, 0.81 Difference 0.56 -0.23 to 0.94 -0.38, 1.59 0.028 ITC Deviant 0.25 0.2 to 0.34 0.15, 0.5 Standard 0.13 0.09 to 0.21 0.06, 0.24 Difference 0.08 0.04 to 0.24 -0.02, 0.27 0.003
*Wilcoxon signed-rank test.
ERSP: event-related spectral perturbations, ITC: inter-trial phase coherence, Max: maximum, Min: minimum.
Fig. 4. ITC in response to standard (A) and deviant (B) tones, and the differ-ence between the two (C) in the oddball (upper row) and control (lower row) par-adigms at the Fz electrode. The color of each image pixel indicates a significant change (p<0.001) of power (in dB) at a given frequency and latency relative to the baseline period (200 ms prior to stimulus onset). Note that the box in (C) indicates the TFOI for further statistical analysis. Topographic distributions of the ITC from this box are depicted. ITC: inter-trial phase coherence, TFOI: time-frequency of interest. A B C Standard Oddball Control Deviant Deviant-standard
frequency-domain measure of the partial or exact synchroni-zation of activity at a particular latency and frequency in re-sponse to a set of experimental events to which EEG data tri-als are time locked. This additional theta oscillation was present only in ERPs elicited by deviant tones, which could be related to the auditory discrimination process reflected in MMN. It has been reported that theta oscillation is involved in various cognitive functions, including working memory.18
Thus, our findings may support the memory-dependence of auditory discrimination in the generation of MMN.3,19
Our results are in agreement with those of previous studies that used either EEG9 or MEG.10 Fuentemilla et al.9 analyzed
auditory change detection using event-related brain poten-tials, and reported that MMN in the frontal region was ac-companied by an increase in theta power and phase align-ment for deviant trials. Hsiao et al.10 compared the MEG
re-sponses from ten healthy subjects using an auditory oddball paradigm that compared deviant and standard stimuli, and found that deviant stimuli elicited responses with a larger theta phase-locking value and a larger theta power change.
It is likely that EEG oscillation is elicited by physical dif-ferences and/or probability difdif-ferences in the stimuli. To eliminate the effect of probability differences, we used a control paradigm in which auditory tones with the same physical properties as in the oddball paradigm were present-ed with equal probability. No significant ERSP change was detected in the control paradigm. Furthermore, no discern-ible phase modulation was observed at around 250 ms; only phase modulation of the theta frequency band at around 120 ms was observed. This finding indicates that when stimuli are presented with equal probability, subjects show only a weak early theta oscillation response, which should corre-spond to a primary sensory process, and subjects do not de-tect an auditory change, as reflected by the absence of the second theta oscillation. Interestingly, a single-trial analysis of the ERPs of seven subjects in the present study who did not show an MMN response revealed that they exhibited nei-ther ERSPs nor ITC (Supplemental Fig. 1). Thus, our results strongly support that the MMN response in the oddball para-digm is related to theta power and phase modulation at around 250 ms.
In the present study, the spatial distributions of theta ER-SPs and ITC were strongest on the frontocentral region, fol-lowed by the temporal area, and particularly the right side. Right hemispheric dominance of theta oscillation in relation to auditory discrimination is in line with the findings of other studies.10,20,21 It has been reported that both frontal and
tem-poral sources are important for detecting auditory changes in MMN.21,22 Temporal sources are associated with auditory
change detection, whereas frontal sources are associated with
involuntary switching of attention to sound change. This finding suggests the presence of a functional relationship be-tween the frontal and temporal regions. An analysis of func-tional connectivity, such as phase synchrony between brain regions, should be conducted to clarify this relationship.
This study was subject to one main limitation. For techni-cal reasons, we were only able to obtain control-paradigm data from seven subjects, and this may have introduced sta-tistical bias when comparing the two paradigms.
In conclusion, the presented results confirm that the audi-tory discriminaaudi-tory process reflected in MMN is accompa-nied by phase resetting and power modulation at the theta frequency.
Conflicts of Interest
The authors have no financial conflicts of interest.
Acknowledgements
This research was supported by a Basic Science Research Program through the National Research Foundation of Korea (NRF) funded by the Ministry of Education, Science, and Technology (no. 2010-0015557). The authors thank Se Hyung Oh (EEG technologist) for acquiring the EEG data.
REFERENCES
1. Näätänen R, Gaillard AW, Mäntysalo S. Early selective-attention ef-fect on evoked potential reinterpreted. Acta Psychol (Amst) 1978;42: 313-329.
2. Näätänen R, Tervaniemi M, Sussman E, Paavilainen P, Winkler I. “Primitive intelligence” in the auditory cortex. Trends Neurosci 2001; 24:283-288.
3. Näätänen R, Paavilainen P, Rinne T, Alho K. The mismatch negativi-ty (MMN) in basic research of central auditory processing: a review. Clin Neurophysiol 2007;118:2544-2590.
4. Makeig S, Westerfield M, Jung TP, Enghoff S, Townsend J, Cour-chesne E, et al. Dynamic brain sources of visual evoked responses. Science 2002;295:690-694.
5. Rousselet GA, Husk JS, Bennett PJ, Sekuler AB. Single-trial EEG dynamics of object and face visual processing. Neuroimage 2007;36: 843-862.
6. Fell J, Dietl T, Grunwald T, Kurthen M, Klaver P, Trautner P, et al. Neural bases of cognitive ERPs: more than phase reset. J Cogn Neu-rosci 2004;16:1595-1604.
7. Mormann F, Fell J, Axmacher N, Weber B, Lehnertz K, Elger CE, et al. Phase/amplitude reset and theta-gamma interaction in the human medial temporal lobe during a continuous word recognition memory task. Hippocampus 2005;15:890-900.
8. Hanslmayr S, Klimesch W, Sauseng P, Gruber W, Doppelmayr M, Freunberger R, et al. Alpha phase reset contributes to the generation of ERPs. Cereb Cortex 2007;17:1-8.
9. Fuentemilla L, Marco-Pallarés J, Münte TF, Grau C. Theta EEG os-cillatory activity and auditory change detection. Brain Res 2008;1220: 93-101.
10. Hsiao FJ, Wu ZA, Ho LT, Lin YY. Theta oscillation during auditory change detection: an MEG study. Biol Psychol 2009;81:58-66. 11. Kimura M, Katayama J, Ohira H, Schröger E. Visual mismatch
nega-tivity: new evidence from the equiprobable paradigm. Psychophysi-ology 2009;46:402-409.
by cortical neurons. Nat Neurosci 2003;6:391-398.
13. Delorme A, Makeig S. EEGLAB: an open source toolbox for analy-sis of single-trial EEG dynamics including independent component analysis. J Neurosci Methods 2004;134:9-21.
14. Jung TP, Makeig S, Humphries C, Lee TW, McKeown MJ, Iragui V, et al. Removing electroencephalographic artifacts by blind source separation. Psychophysiology 2000;37:163-178.
15. Makeig S, Debener S, Onton J, Delorme A. Mining event-related brain dynamics. Trends Cogn Sci 2004;8:204-210.
16. Onton J, Westerfield M, Townsend J, Makeig S. Imaging human EEG dynamics using independent component analysis. Neurosci Biobehav Rev 2006;30:808-822.
17. Onton J, Delorme A, Makeig S. Frontal midline EEG dynamics dur-ing workdur-ing memory. Neuroimage 2005;27:341-356.
18. Klimesch W. EEG alpha and theta oscillations reflect cognitive and
memory performance: a review and analysis. Brain Res Brain Res Rev 1999;29:169-195.
19. Näätänen R, Jacobsen T, Winkler I. Memory-based or afferent pro-cesses in mismatch negativity (MMN): a review of the evidence. Psy-chophysiology 2005;42:25-32.
20. Lin YY, Hsiao FJ, Shih YH, Yiu CH, Yen DJ, Kwan SY, et al. Plastic phase-locking and magnetic mismatch response to auditory deviants in temporal lobe epilepsy. Cereb Cortex 2007;17:2516-2525. 21. Doeller CF, Opitz B, Mecklinger A, Krick C, Reith W, Schröger E.
Prefrontal cortex involvement in preattentive auditory deviance de-tection: neuroimaging and electrophysiological evidence. Neuroim-age 2003;20:1270-1282.
22. Rinne T, Alho K, Ilmoniemi RJ, Virtanen J, Näätänen R. Separate time behaviors of the temporal and frontal mismatch negativity sources. Neuroimage 2000;12:14-19.
Supplemental Fig. 1. ERSP (upper row) and ITC (lower row) in response to standard (A) and deviant (B) tones, and the difference between the two (C) in the oddball at the Fz electrode from seven subjects who did not show a clear MMN component. The color of each image pixel indi-cates a significant change (p<0.001) of power (in dB) at a given frequency and latency relative to the baseline period (200 ms prior to stimulus onset). ERSP: event-related spectral perturbations, ITC: inter-trial phase coherence, MMN: mismatch negativity.
Standard
ERSP
ITC