Copyright © 2021 Techno-Press, Ltd.
http://www.techno-press.com/journals/was&subpage=7 ISSN: 1226-6116 (Print), 1598-6225 (Online) 1. Introduction
The tower crane is essential vertical transportation equipment used for the construction of super-tall buildings, which is attached to the concrete core tube via connection supports. In eastern and southern China, most super-tall buildings are located in economically developed coastal cities. Compared with those located in inner mainland China, super-tall buildings located in these cities are more susceptible to strong winds, especially during their construction stage. For outer-attached tower cranes typically used in the construction of these buildings, strong winds at high levels can influence their working performance (Klinger 2014). The strength and stability of these cranes are affected by wind-induced vibration both from themselves and the main structure. When the tower crane is subjected to excessive dynamic load under strong wind, the buckling of key components under compression might occur, and the dynamic stability of the lifting arm may be affected (Vanvinckenroye et al. 2018). The design of these cranes may not fully consider such influences, and the strength and reserve resistance to instability may be overestimated in some extreme cases. According to the statistics by Mcgettigan (2010), there were 1125 tower crane accidents that occurred worldwide from 2000 to 2010,
Corresponding author, Professor E-mail: [email protected]leading to 780 deaths. Such a scenario could be more devastating if a tower crane fails and collapses from 600 to 1000 m high. Therefore, the strong wind-induced response and fragility of these cranes during the spatiotemporal construction process of super-tall buildings needs to be addressed.
The spatiotemporal variation in the configuration and height of super-tall buildings under construction make it more difficult to determine the distribution of wind pressure. Wind pressures can be evaluated using data from wind tunnel tests (Kassir et al. 2017), in-field measurements (Lepri et al. 2017), and numerical simulations (Fouad et al. 2018) based on computational fluid dynamics (CFD). The difficulty in determining the wind pressure can cause more challenges in determining the wind-induced vibration of the attached tower crane. Voisin et al. (2004) conducted wind tunnel tests on a non-working tower crane under strong wind to investigate the impact of building on tower crane. In addition, to study the effects of the solidity ratio and position of a tower crane attached to a tall building, on the distribution of wind pressures, Mara (2010) used wind tunnel tests. However, most relevant investigations have focused on tower cranes partially attached to the main structure and partially fixed on the ground. Physically, they can be simplified as a single-degree-of-freedom system. Only the overturning mode was considered, and the critical wind velocity was determined accordingly (Eden et al. 1981). It is clear that the above-mentioned simplification is not acceptable for tower cranes that are completely attached to the building, which are commonly used in super-tall
Wind-induced vibration fragility of outer-attached tower crane to
super-tall buildings: A case study
Yi Lu
1, Luo Zhang
1, Zheng He
1,2, Fan Feng
1and Feng Pan
3 1Department of Civil Engineering, Dalian University of Technology, Dalian, China2State Key Laboratory of Coastal and Offshore Engineering, Dalian University of Technology, Dalian, China 3Engineering Research Institute, Shanghai Construction No.5 (Group) Co., Ltd, Shanghai, China
(Received March 12, 2020, Revised March 22, 2021, Accepted April 10, 2021)
Abstract. To gain insight into the wind-induced safety concerns associated with attached tower cranes during the construction of super-tall buildings, a 606 m level frame-core tube super-tall building is selected to investigate the wind-induced vibration response and fragility of an outer-attached tower crane at all stages of construction. The wind velocity time history samples are artificially generated and used to perform dynamic response analyses of the crane to observe the effects of wind velocity and wind direction under its working and non-working resting state. The adverse effects of the relative displacement response at different connection supports are also identified. The wind-resistant fragility curves of the crane are obtained by introducing the concept of incremental dynamic analysis. The results from the investigation indicate that a large relative displacement between the supports can substantially amplify the response of the crane at high levels. Such an effect becomes more serious when the lifting arm is perpendicular to the plane of the connection supports. The flexibility of super-tall buildings should be considered in the design of outer-attached tower cranes, especially for anchorage systems. Fragility analysis can be used to specify the maximum appropriate height of the tower crane for each performance level.
Keywords: super-tall building; attached tower crane; construction; wind-induced vibration response; fragility analysis; incremental dynamic analysis; pushover analysis
buildings.
Fragility is the degree to which a system, subsystem, or system component is likely to experience harm due to exposure to a hazard, either a perturbation or stress/stressor (White 1974, Turner et al. 2003). Regarding hurricane engineering, structural fragility is further defined as the conditional probability of failure of certain limit states given a specific wind speed (Li and Ellingwood 2006). A complete chain of risk assessment analysis involves three parts: site hazard analysis, fragility analysis, and loss assessment. The fragility analysis considered herein is related only to the structure under concern. Hong et al.’s (2001) probabilistic assessment of wind-sensitive structures indicates that the uncertainties associated with the motions are the major source of the resulting uncertainties in the response quantities. Lee and Rosowsky (2005) evaluated the fragility of wood frame structures built in strong-wind regions and proposed a fragility model for these structures. Further, Seo and Caracoglia (2013) applied the method to evaluate the economic loss of long-span bridges experiencing various levels of wind-induced disasters during the entire life cycle. By expressing structural damage as a function of wind velocity, Stewart et al. (2016) developed fragility curves of roof damage to low-rise metal-
clad industrial buildings located in non-cyclonic regions of Australia. Despite ignoring the uncertainties of the structural parameters, the fragility investigations mentioned above are proven to be accurate, which indicates that the fragility analysis considering only the randomness of excitation is practicable. As a typical primary-secondary system, there are no previous studies available on the wind-induced fragility of tower cranes attached to super-tall buildings.
To gain insight into the wind-induced safety concerns associated with attached tower cranes during the construction of super-tall buildings, a 606 m level frame-core tube super-tall building is selected to investigate the wind-induced vibration response and fragility of the outer-attached tower crane at all stages of construction. The wind velocity time history samples are artificially generated and used to perform dynamic response analyses of the crane to observe the effects of wind velocity and wind direction under its working or non-working resting state. The adverse influence of the wind-induced vibration in the main structure on the outer-attached tower crane is identified by extracting the relative displacement time history response at the supports. Full dynamic time history analysis is used to investigate the wind-induced vibration response of tower
(b) Plan layout of standard floors
(a) Elevation (c) Analytical models of different construction stages Fig. 1 A 606 m level super-tall building
cranes. To facilitate the fragility analysis and capture the entire plasticity development process, pushover analysis is used to determine the limits of the performance levels of the tower crane. Combined with the generated fragility curves, the critical wind velocities of the tower crane corresponding to all the performance levels can be obtained.
2. Case building
2.1 Building model information
A 606 m level super-tall building located in Shanghai city has 128 stories under construction (see Fig. 1). It has a typical mega-frame-core tube-outrigger structural system. The elevation ±0.000 m is the fixed end of the structure. The eight mega ring-belt trusses divide the building structure into nine zones. According to the structural zones, nine construction stages are specified, and corresponding finite element models (FEMs) are established in the SAP2000 program. Fig. 1(c) illustrates five of these.
The plan layout of the building is approximately circular at the base story with a diameter of 80 m. As the story level increases, the shape of the core tube gradually reduced from square to cross-shaped and the thicknesses of the core tube wing wall and belly wall are reduced from 1.2 m to 0.5 m and 0.9 m to 0.5 m, respectively. A steel-plate composite shear wall is adopted in the former two zones, in which the steel-plate ratio ranges from 1.5% to 4%. The mega columns include eight side columns and four corner columns, of which only the corner columns exist in the basement and the former five zones. The sections of mega columns are gradually reduced from 5.3 m × 3.7 m to 2.4 m × 1.9 m. The steel ratio and reinforcement ratio of the columns range from 4% to 5% and from 1.2% to 2.5%, respectively. In terms of materials, C35, C50, and C60 concrete are mainly used for the floor slabs, foundations, and shear walls, respectively. HRB335 and HRB400 steel bars are used for reinforcement in the concrete, and HPB235 is used for the stirrups. The remainder of the
design information can be found elsewhere (TJAD, 2009). A typical core tube leading construction technique is adopted for this type of structural system, that is, the construction of the core tube remains ahead of the outer frame structure. According to some construction practices on this type of structural system, the leading stories are taken as 10 for all construction stages. The age-dependent concrete strength model specified in the CEB-FIP code (2010) is selected to account for the development of concrete strength during the construction process.
2.2 Shape factor of wind load
The shape factor of the wind load, μs, is defined as a
factor representing the drag acting on a structure according to the Chinese load code (GB50009-2012 2012), which is equivalent to the drag coefficient in fluid mechanics, that is,
μs=w/(ρV2/2), where w is the wind pressure, ρ is the air
density, and V is the wind velocity. For the 606 m super-tall building, the shape factor of the wind load is determined by CFD simulation. Considering that the shape of the core tube is gradually reduced from rectangular to cross-shaped, two models with exterior frame heights of 500 m (Case A) and 200 m (Case B) are established. From the standpoint of wind resistance, two different models and four cases for each are considered in the CFD simulation, as summarized in Table 1.
Each surface of a building or structure has a defined shape factor μs. All the shape factors can be divided into
two groups: the windward side shape factor, μsw, and the
leeward side shape factor, μsl. The global shape factor of
each floor, μsg, is determined by μsg = μsw - μsl. As the 606 m
super-tall building is located in the densely populated central business district of Shanghai city, the terrain roughness of the building site is classified as D-category according to the Chinese load code for the design of
building structures (GB50009-2012 2012). The reference
wind pressure is 0.55 kN/m2. The CFD simulation results of
those cases show that the shape factors of the core tube windward sides range from 0.72 to 1.02, and that of the Table 1 Some CFD simulation cases
Case No. Configuration Measure points at core tube (left) and exterior frame (right) direction Wind Wind velocity (m/s)
Case-A1 0 5 Case-A2 0 10 Case-A3 45 5 Case-A4 45 10 Case-B1 0 5 Case-B2 0 10 Case-B3 45 5 Case-B4 45 10
leeward sides range from -0.23 to -0.52. The global shape factor of the core tube, μsg, is observed to vary between 1.19
and 1.37. Only the global shape factor, μsg, is considered for
the circular exterior frame, which is found to vary between 0.68 and 0.81. Allowing for a strength reserve, μsg is taken
as 1.4 for the core tube, and 0.8 for the exterior frame, which are roughly consistent with those suggested in the GB50009-2012 (2012).
2.3 FEM of tower crane
Some of the parameters associated with the tower crane
are listed in Table 2. At all stages of construction, the interval of supports connecting the tower crane to the main structure is seven stories between the bottom and middle supports and four stories between the middle and top supports. Fig. 2 shows the FEM of the crane, including the light steel frame, working mechanism, and drive control system. For the latter two, some simplifications are performed in the FEM. The rotating part of the working mechanism is composed of several steel plates. The degrees of freedom (DOFs) of those plates at the connections can be coupled and simply modeled by three-dimensional (3D) link elements to reduce the number of element types and Table 2 Some parameters of the tower crane
Item Design value Item Design value
Max. rated lifting capacity 50 kN Rated lifting moment 630 kN∙m
Max. working radius 50 m Max. rated lifting capacity at max. working radius 12 kN
Min. working radius 2.5 m Max. working wind pressure 0.25 kN/m2
Lifting height in attached type 120 m Height of a standard segment 2.5 m
Height of lifting arm 0.96 m Length of the lifting arm 32 m
Section of tower body 1.6m × 1.6 m Weight of a standard segment 6.89 kN
Counterweight 57.1 kN Steel type Q235
Tower main limb section (mm) ∠125 × 10 Section of supports connected to main structure (mm) ∟600 × 300 × 15
Fig. 2 FEM of tower crane
(a) Mode 1 (Z-axis torsion) (b) Mode 2 (XZ-plane translation) (c) Mode 3 (YZ-plane translation) Fig. 3 The former three vibration modes of the tower crane
facilitate the analytical process. The tower body, beams, and columns of the lifting arm are simulated by 3D beam-column elements, while the diagonal braces are modeled by truss elements. Other attachments, such as steel wire cable, hook, and trolley, which have a small size and complex configuration, are treated as additional weights in the model, together with the lifting weight. As the lifting weight is flexibly connected to the lift arm, the inertia force caused by the wind-induced vibration is neglected for analytical convenience.
The tower crane model in the modal analysis is under the working state, and all the members are rigidly connected. All four supports at the bottom of the tower body are rigidly fixed, and the supports connected to the main structure of the tower body are pinned. Due to the enhancement in the connection part, the rigid floor assumption is adopted in the plane of the connection between the tower crane and the main structure, i.e., the nodes in the plane are defined as “diaphragm” constraints in order to couple the DOFs. Fig. 3 shows the former three vibration modes, that is, the Z-axis torsion, XZ-plane translation, and YZ-plane translation. The former three vibration periods of the model are 3.49 s, 1.28 s, and 0.68 s, respectively.
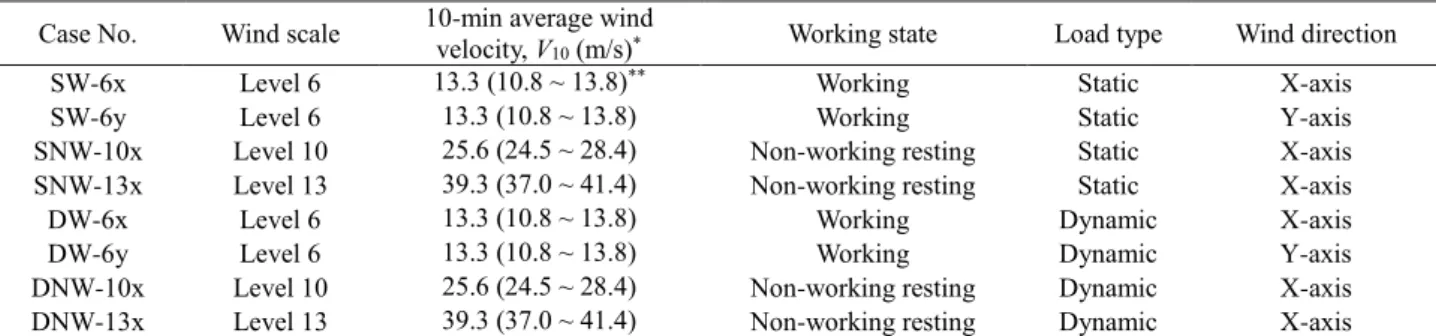
The working environmental conditions of tower cranes are complex. Wind scale, wind direction, load pattern, working state, and the main structure itself can influence the wind-induced response. Previous investigations indicate that the wind-induced response of the tower crane becomes dominant only when the wind direction is parallel or perpendicular to the plane of the lifting arm (Voisin et al. 2004). Therefore, only these two wind directions are considered in this study. In contrast, the equivalent static analysis and dynamic time history analysis are performed separately to obtain the wind-induced response of the tower crane during all construction stages. Meteorological information about strong winds, such as typhoons and hurricanes, can be roughly predicted before their arrival. All tower cranes in the wind-affected area are supposed to change into the non-working state before the arrival of such strong winds, if the predicted wind scale is above the limit specified in the design rules for tower cranes (GB/T13752-2017 (GB/T13752-2017). In that situation, the rotary brake is loosened and the lifting arm is kept parallel to the wind direction to prevent overturning. All the wind cases are summarized in
Table 3, where the Beaufort wind scale (Storm Prediction Center 2018) is used. According to the design rules for tower cranes (GB/T13752-2017 2017), all the construction tower cranes in the wind-affected area are supposed to be switched into the non-working resting state when the predicted wind level is beyond the limit of Level 6. To cover all possible working cases, three different wind velocities located at levels 6, 10, and 13 are considered in the analysis. It is noteworthy that when the crane is under the non-working state for wind scales of 10 or 13, only the X-axis wind pressure is considered in the analyses.
3. Wind-induced vibration response analysis of outer-attached tower crane
3.1 Simplification and assumption
The following simplifications and assumptions are adopted in the structure analysis: 1) the main structure remains linearly elastic at all levels of wind excitations, and the nonlinearity is only supposed to occur in the tower crane. Because we only consider the nonlinear response of the tower crane and the wind-induced response of the main structure is relatively small, it is reasonable to conduct strict nonlinear modeling of the tower crane and assume the main structure to be an elastic structure, to improve the computational efficiency; 2) the influence of the tower crane on the response of the main structure is negligible. There are three ways to develop analytical models of crane-building (i.e., primary-secondary) structural systems. They are, the globally coupled FEM of the tower crane and main structure, a substructure model considering interactive interfacial response (Craig and Bampton 1968, Kim et al. 2017, Wang and Wang 2020), and the decoupled crane-building system. The most accurate response can be obtained using the globally coupled model, but at the expense of computational efficiency. In the substructure model, the connecting supports are usually selected as the interactive interface between the tower crane and the main structure. Some iterations are required to determine the displacement and force vectors at the interface. In the decoupled crane-building model, the response at the interface is solved first from the FEM of the main structure and then transmitted to that of the tower crane. In view of Table 3 Summary of wind cases
Case No. Wind scale 10-min average wind velocity, V
10 (m/s)* Working state Load type Wind direction
SW-6x Level 6 13.3 (10.8 ~ 13.8)** Working Static X-axis
SW-6y Level 6 13.3 (10.8 ~ 13.8) Working Static Y-axis
SNW-10x Level 10 25.6 (24.5 ~ 28.4) Non-working resting Static X-axis
SNW-13x Level 13 39.3 (37.0 ~ 41.4) Non-working resting Static X-axis
DW-6x Level 6 13.3 (10.8 ~ 13.8) Working Dynamic X-axis
DW-6y Level 6 13.3 (10.8 ~ 13.8) Working Dynamic Y-axis
DNW-10x Level 10 25.6 (24.5 ~ 28.4) Non-working resting Dynamic X-axis
DNW-13x Level 13 39.3 (37.0 ~ 41.4) Non-working resting Dynamic X-axis
*V10: average wind velocity within a 10-min interval at the height of 10m under the terrain roughness where a building located. **: the numbers in the bracket indicates the range of wind velocity of a wind scale of concern.
the comparatively much smaller proportion of mass and stiffness of the tower crane to its attached main structure (usually less than 0.1%), the dynamic response of the tower crane is significantly affected by its attached main structure. On the other hand, the influence of the tower crane on the response of its attached main structure is negligible. For analytical convenience, we applied the decoupled primary-secondary structural system to determine the response of the tower crane; 3) the main structure and tower crane systems are approximated by two lumped multiple-degree-of-freedom (MDOF) systems. It is extremely difficult and complex to establish nonlinear dynamic equations for real 3D structures. Because most super-tall structures and tower cranes are symmetrical, and most of the mass is concentrated in the floor plane, it is feasible to simplify the complex structures to 2D primary-secondary MDOF systems; 4) the effect of local vortex shedding within the components of the tower crane on the vibration response of the main structure, is not considered. As construction tower cranes are typically latticed steel structures that consist of a
number of angle steel components, vortex shedding can be easily observed around these components. However, such local-scale fluctuating phenomena do not have a significant effect on the response of the main structure. Most importantly, the frequency of vortex shedding around the steel components of a tower crane is generally no greater than 0.05 Hz (Scarabino et al. 2005), which is much lower than the fundamental frequency of the main structure. The resonance caused by vortex shedding is negligible. Thus, such an effect can be neglected for analytical simplicity; and 5) Vertical turbulence is not considered. Vertical turbulence is mostly addressed in the monitoring and simulation of large-scale wind fields, for example, the atmospheric and marine environments (Fuchs et al. 1994, Mashayek et al. 2017). For buildings with relatively small-scale wind fields, the measured data show that the vertical turbulence component of a building wind field only accounts for approximately 1/5 of the horizontal turbulence component (Hu et al. 2011). Moreover, the lifting arm of a construction tower crane is even smaller than that of the Fig. 4 Discretized MDOF system under X-direction wind load
Fig. 5 Discretized MDOF system under Y-direction wind load Fig. 4 Discretized MDOF system under X-direction wind load
tower body and the attached main structure, and the vertical influence becomes insignificant. For analytical convenience, vertical turbulence is not replicated in the generation of the artificial fluctuating wind velocity time history.
The following assumptions and explanations are adopted in the fragility analysis: 1) as discussed in the Introduction, both fragility and site hazard analyses are part of the risk assessment analysis, however, the fragility analysis is only for the structure itself. The influence of site hazards is not considered. Only the interaction between the wind load and the coupled structural system of the main building with an attached tower crane is considered; 2) if all the uncertainties of the geometrical and material parameters are considered, a large number of comparison cases need to be investigated to determine the weight of each parameter, which will significantly increase the calculation workload. In addition, as discussed previously the uncertainties associated with the motions are the major source of the resulting uncertainties in the response quantities. Therefore, the uncertainties associated with geometrical and material parameters can be ignored compared with the significant randomness in wind excitation; 3) as the damage levels of structures under wind load have not been clearly defined, the outcome from the field of earthquake engineering can be tentatively applied. From a physical standpoint, the damage state is more closely related to the material stress level than load pattern, and some similarities can be observed between different lateral dynamic loads (Yan et al. 2005). If a more clear and reasonable division criterion appears in the prospective research, the fragility analysis method proposed herein can still be used based on the modified performance levels.
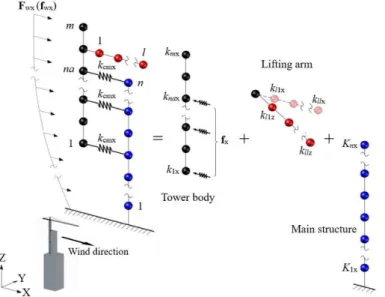
3.2 Simplified model of a primary-secondary system
Fig. 4 shows the case of a tower crane in the non-working resting state (large wind velocity). In this case, the wind direction is parallel to the lifting arm. The torsional mode of the crane is not excited, but the lifting arm vibrates in the X-Z plane. The response of the tower crane is dominated by the translational response, and only the translational stiffness is considered. For the main structure, as the influence of the tower crane on the response of the main structure (fx), is negligible, the X-direction
displacements of the 1st to the nth DOFs under wind load
(Fwx) can be obtained directly. For the tower body, the
X-direction displacements of the 1st to the mth DOFs under a
wind load (fwx) can be obtained by summing the
displacements of themselves and displacements of the main structure. Likewise, the X-direction displacements of the 1st
to the lth DOFs of the lifting arm can be obtained based on the displacement of the tower body. In the X-Z plane, as there is no Z-direction wind load, the Z-direction displacements of those DOFs can be determined by free vibration.
Fig. 5 shows the tower crane in the working state for when the predicted wind velocity is small. In that case, the wind direction is perpendicular to the lifting arm, and the torsional mode of the crane is excited. Both translational
and torsional stiffness should be considered. The Y-direction displacements of the structures can be obtained in the same way as described above. The torsional effect caused by the non-uniform vibration of the lifting arm in the X-Y plane is transferred to the main structure via the tower body. Correspondingly, the tower crane is affected by the torque (Tfz) transferred from the main structure. If Tfz is
determined, the Z-axis torsional rotation of the 1st to the mth DOFs of the tower body can be obtained by establishing the vibrational differential equations containing torsional stiffness.
To facilitate the solution of the above primary-secondary MDOF system, the following simplifications need to be made: 1) the connections between the tower crane and main structure are rigid, that is, the connection stiffness coefficients in the X and Y directions, kcmx and kcmy, are
infinite. In other words, the response of the DOFs of the main structure that are connected with the crane are equal to that of the DOFs of the crane that are connected with the main structure; 2) for light steel structures, the partitioned damping matrix of the elements correlated between the tower crane and the main structure are close to null matrices. Based on the above simplifications, the response of the tower crane can be conveniently derived from the response of the main structure.
3.3 Artificially generated wind velocity time history
The parallel fluctuating wind velocity time history is generated (see Fig. 6(a)) based on the Davenport power spectrum density (PSD) function (Davenport 1961), the spatial correlation function proposed by Shiotami, and the fourth-order autoregressive (AR) filtering method (Deodatis and Shinozuka 1988). The height at which the turbulence spectrum is examined is 105 m. The exponential wind profile specified in the Chinese load code (GB 50009-2012 2012) is adopted as follows: 10 G 10 G
10
10
Gz
V
z
z
V
z
V
z
z
(1)where V10 is the average wind velocity within a 10 min
interval at a height of 10 m under the terrain roughness where a building is located, z is the height of the position of concern, zG is the height of the gradient wind velocity, and α
is the terrain roughness parameter. For the building with D-category, α=0.30, and zG=550 m (GB50009-2012 2012).
Two assumptions are adopted: (1) the average wind velocity at any time does not vary with time, and (2) the fluctuating wind velocity time history is a zero-mean stationary stochastic process. Fig. 6(b) shows a comparison between the target Davenport PSD and the artificially generated spectrum. The horizontal axis in Fig. 6(b) shows the pulsing frequency range of the wind velocity (from 0.001 to 10) of the target Davenport spectrum and the artificially generated spectrum. This range is consistent with the field measurement data (Li et al. 2004).
(a) Fluctuating wind velocity time history
(b) PSD comparison between the two spectra Fig. 6 Generation of fluctuating wind velocity time history
3.4 Wind-induced vibration of tower crane
According to the Chinese load code for the design of
building structures (GB 50009-2012 2012), the wind
pressure, w, can be expressed as w=μsρV2/2. where ρ is the
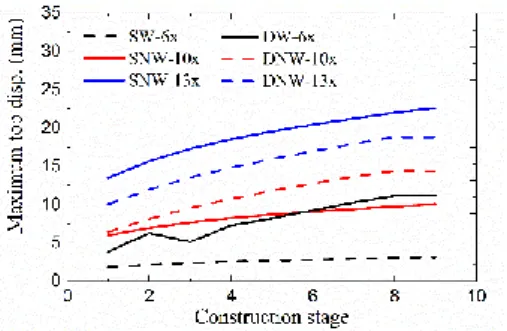
air density, and V is the wind velocity. The wind velocity time history can be generated artificially by the method mentioned in Section 3.3, and then the wind pressure time history can be calculated accordingly. The wind load on the structure, F, can be calculated using F=wS, where S is the windward area of the structure. Under strong winds, construction tower cranes mostly fail because of dynamic instability. In general, excessive displacement can be observed at the free end of the horizontal arm or the tower body prior to the occurrence of dynamic instability. Thus, the displacement responses at these two points are recorded to investigate the performance of the tower crane. Fig. 7 shows the maximum top displacement of the crane caused by the wind load in the X-direction for all stages of construction, without considering the effect of the wind-induced vibration in the main structure. In other words, the main structure is assumed to be a rigid body fixed on the ground. If the wind velocity scale is below level 6, the results obtained from the dynamic analysis, in terms of the root mean square (RMS) of the time history response are greater than those obtained from the equivalent static analysis. However, the former results will be smaller than the latter if the wind velocity scale reaches level 13. It is believed that if the wind velocity scale varies between levels 6 and 13, the two different methods can result in similar results. The constant wind vibration coefficient of 1.5, is risky to some extent for small wind velocities and overconservative for large wind velocities. In addition, the top displacement of the tower crane appears in construction stage No. 9, that is, the maximum construction height, reaching 22.6 mm with a wind scale equal to level 13.
Fig. 8 shows the free end displacement of the tower crane in the Y-direction for all stages of construction. As mentioned previously, the Y-direction wind load is considered only in the working state for wind loads with lower scales. Only the results corresponding to the wind
Fig. 7 X-direction maximum top displacement of tower crane for all construction stages
Fig. 8 Y-direction free end displacement of tower crane for all construction stages
scale of level 6 are presented for the two analytical methods. As a result of the leverage effect, the displacement at the free end of the crane becomes much larger than the top displacement, and it increases much faster as the construction height increases. Under construction stages 8 and 9, the displacement at the free end of the tower crane reaches approximately 800 mm, nearly doubling that calculated by the equivalent static analysis method. Clearly, it is dangerous to allow a strong wind load to be applied to the tower crane perpendicular to its lifting arm. A stronger wind load may trigger premature collapse of the tower crane due to excessive displacement unless the rotary brake is loosened and the lifting arm is allowed to turn parallel to the wind direction.
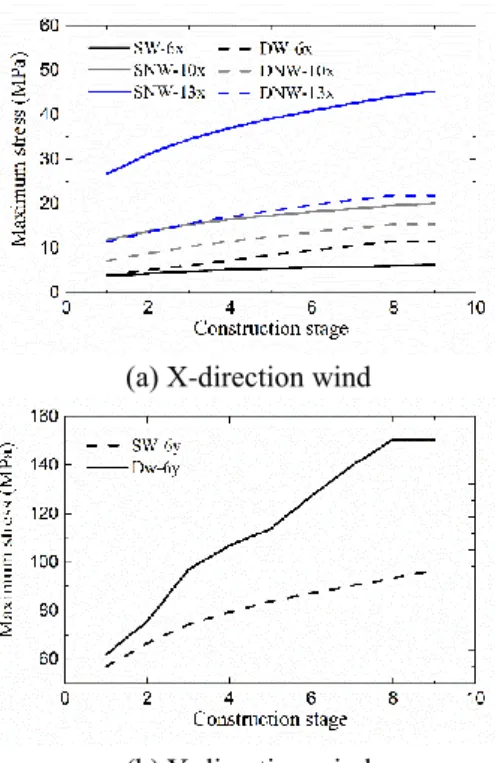
The tensile and compressive stresses in the tower crane for all construction stages are shown in Figs. 9 and 10, respectively. According to the design rules for tower cranes (GB/T13752-2017 2017), the overall maximum stress response of the tower crane should not exceed the specified allowable stress limit of steel in order to avoid strength failure. As Q235 steel is used as the main component of the tower crane, the specified allowable stress limit is 192 MPa (GB/T13752-2017 2017). Therefore, the tower crane under the conditions shown in Figs. 9 and 10 is safe. When subjected to the Y-direction wind load, the crane will reach a maximum tensile stress of approximately 150 MPa and a maximum compressive stress of approximately 180 MPa, which is much greater than those in other cases. This is the most critical case among all those considered. Under the same wind conditions, the compressive stresses are slightly greater than the tensile stresses. The other observations are similar to those in Figs. 7 and 8.
(a) X-direction wind
(b) Y-direction wind
Fig. 9 Tensile stresses of tower crane for all construction stages
(a) X-direction wind
(b) Y-direction wind
Fig. 10 Compressive stresses of tower crane for all construction stages
in the tower crane in the case of SNW-13x and DW-6y for construction stage No. 9, that is, the most unfavorable cases of the X- and Y-direction wind loads in Figs. 9 and 10. The blue and red blocks represent the relative amplitudes of the tensile and compressive stresses in the components, respectively. A sharp difference is observed between the two cases. When applied to the X-direction wind load, the entire tower body is stressed, exhibiting some distinct changes in
(a) Case SNW-13x
(a) Case DW-6y
Fig. 11 Tensile stresses in tower crane for construction stage No.9
the diagonal braces, beams, or columns near the supports. The support closest to the lifting arm is the most dangerous. The tower body acts physically as a multi-span continuously supported beam when excited with an X-direction wind load. When excited with the Y-X-direction wind load, only the upper part of the tower body and the lifting arm is stressed, similar to a curved beam cantilevered at the upper support. The stress concentration is observed in the support closest to the lifting arm and the connection point between the tower body and lifting arm. If the rotary brake is still fixed under stronger winds, rupture of the lifting arm may occur. Thus, the lifting arm plays an important role in the stress distribution. It is obvious that the support closest to the lifting arm is most dangerous for each case of wind direction, which indicates that the failure of the outer-attached tower crane could be triggered by the steel components near the upper support.
3.5 Influence of wind-induced vibration in main structure
As specified in the design rules for tower cranes (GB/T13752-2017 2017), when a crane is attached to a building or a structure, the reactions at the supports are calculated using the multi-span continuous beam model.
These reactions are used for the design of the attached device. This specification implies that the buildings or structures are rigid. For super-tall buildings, even if the influence of an attached tower crane on the response of the main structure can be ignored because of its relatively small contribution to the whole structural mass and stiffness, the inertia effect and large displacement response in the crane caused by the vibration of the main structure under strong wind should still be seriously considered. Such specifications could possibly underestimate the response of attached tower cranes in some cases for super-tall buildings. The effect of wind-induced vibration of the main structure on the attached tower crane needs to be identified.
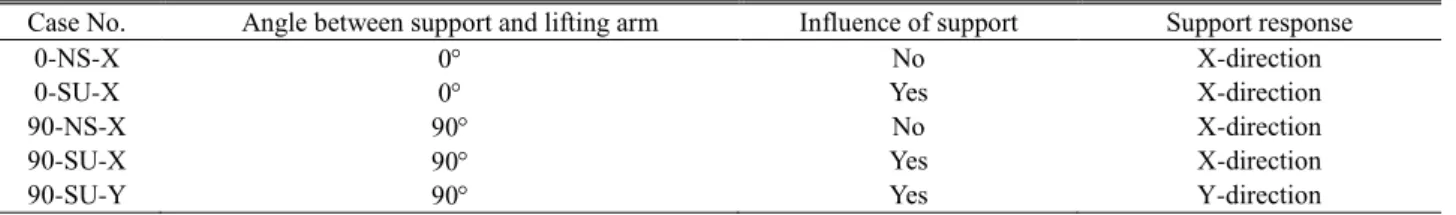
During the construction process, the angle between the planes of the lifting arm and the supports changes constantly. Different angles cause different vibration responses in both the attached tower crane and the main structures. As discussed previously, only two extreme angles, that is, 0° and 90°, are considered (see Fig. 12) for analytical convenience. The wind velocity is taken as 15.6 m/s, corresponding to a reference wind pressure of 0.55 kN/m2. In both cases, the wind direction is parallel to the
direction of the lifting arm. In the case of a 0-degree wind velocity time history, the X-direction wind load causes the X-direction displacement at the support only. In the case of 90-degree wind velocity time history, both directional responses should be considered. Five cases are included in the analysis, as shown in Table 4.
In the wind-induced response analysis of the crane at different stages of construction, the relative displacements at the upper two supports with respect to that at the bottom support are extracted and applied as the boundary
conditions to the finite element model of the crane. Fig. 13 shows the time history displacement response (with respect to the ground) at the top (Support-T), middle (Support-M), and bottom supports (Support-B) in construction stage No. 2, based on an X-direction wind velocity time history sample generated by the procedures mentioned previously. Some differences are observed among these supports. Fig. 14 shows the RMS of the relative displacement time history response at the upper two supports, T and Support-M, with respect to the bottom support (Support-B) for all construction stages. As construction proceeds, the relative displacements at the two supports increase nonlinearly, especially after construction stage No. 6. During construction stage No. 8, the maximum relative displacement at Support-T with respect to Support-B reaches approximately 35 mm.
Fig. 15(a) shows the RMS of the top displacement response time history of the crane for the cases listed in Table 4. Owing to the influence of the supports, the top displacement of the tower crane increased from 0-NS-X to 0-SU-X. Its maximum is reached at construction stage No. 2. This can be explained by the fact that, in this construction stage, some vibration periods of the main structure are close to those of the tower crane, causing the so-called analogous resonance. It can be observed that when the crane is located in the lower part (other than construction stage No. 2) of the building, the response of the crane is not affected significantly by the main structure, which is within 20%. When the construction height increases from stages six to nine, an increase in the displacement response at the supports will give rise to a nonlinear increase of up to 200%–500% in the top displacement of the crane. The (a) Parallel to the plane of lifting arm (0) (b) Perpendicular to the plane of lifting arm (90)
Fig. 12 Different angles between supports and lifting arm Table 4 Consideration cases of supports and response
Case No. Angle between support and lifting arm Influence of support Support response
0-NS-X 0 No X-direction
0-SU-X 0 Yes X-direction
90-NS-X 90 No X-direction
90-SU-X 90 Yes X-direction
Fig. 13 Sampled displacement time history at three supports in construction stage No.2
Fig. 14 RMS of relative displacement time history response at upper two supports
influence of the relative displacement at the supports is found to be most significant for the lifting arm perpendicular to the plane of the supports. Fig. 15(b) shows the RMS of the top acceleration response time history of the crane for the cases listed in Table 4. As the construction proceeds, the top acceleration increases. A significant fluctuation is observed only in the case of 90-SU-Y as the construction height increased from stage No. 1 to No. 9. In contrast to the top displacement response, the vibration of the main structure tends to have an insignificant influence on the top acceleration response of the crane in most cases.
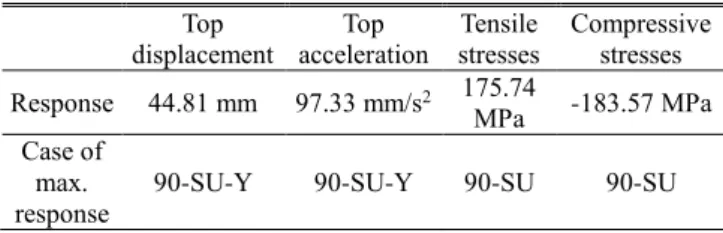
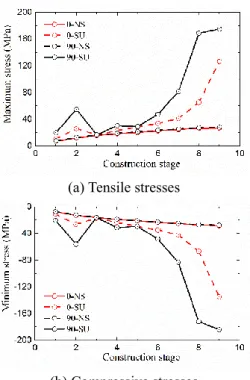
The RMS values of the tensile and compressive stresses in the tower crane obtained from the wind-induced vibration response analyses for all construction stages are illustrated in Fig. 16. The tensile and compressive stresses are basically symmetric about the abscissa and roughly follow the tendency observed in the top displacement response in Fig. 15(a). For construction stages at or below No. 6, the maximum tensile stresses are less than 50 MPa. When the construction height reaches stage nine, the maximum tensile stress is approximately 180 MPa, which is close to the allowable stress of the steel. This means that under the reference wind pressure, some steel components of the crane might yield during the construction of the upper part of the building. It is noteworthy that the maximum tensile stresses occur in the diagonal braces near the top support. The RMS values of the maximum response of the tower crane and the corresponding unfavorable working cases are listed in Table 5. The most unfavorable case appears when the plane of the supports is perpendicular to the lifting arm, which is consistent with the observations from the case where the support excitations from the main structure are ignored.
(a) Top displacement
(b) Top acceleration
Fig. 15 RMS of top displacement time history of tower crane for all construction stages
Table 5 RMS of maximum response Top displacement Top acceleration Tensile stresses Compressive stresses Response 44.81 mm 97.33 mm/s2 175.74 MPa -183.57 MPa Case of max. response
90-SU-Y 90-SU-Y 90-SU 90-SU
4. Fragility analysis of outer-attached tower crane
4.1 Wind-induced fragility analysis
If the stationary random process can be assumed for all the samples of wind velocity time history and the spectral characteristics can be assumed to be independent of wind velocity, the fragility analysis procedures that originate from earthquake performance assessment can be acceptable in the case of wind-resistant performance assessment. Similar to the definition of earthquake fragility, the wind-resistant fragility can be defined as the conditional probability of failure when a specified performance level is reached or exceeded in a structure subjected to a wind load having a certain scale, that is
i
i
P LS IM
im
P EDP
edp IM
im
(2)where IM is the intensity measure. Similar to the commonly used peak ground acceleration and spectral acceleration (Sa)
in earthquake fragility analysis, the average wind velocity at the 10 m level, V10, is selected as the IM in the
wind-resistant fragility analysis; LSi is the limit state of the ith
performance level; EDP is an engineering demand parameter; and edpi is the EDP capacity threshold
(a) Tensile stresses
(b) Compressive stresses
Fig. 16 RMS of maximum stresses in tower crane for all construction stages
associated with LSi.
The modified fragility analysis procedures proposed by Fu et al. (2016) are applied. During each incremental dynamic analysis (IDA), a fluctuating wind velocity time history sample is generated and superposed with an average wind velocity, V10, which increases until the failure of the
tower crane. Using the IDA loops, the probability of reaching or exceeding a certain performance level under different wind loads can be obtained, and the corresponding wind-resistant fragility curve can be plotted. A total of 20 average wind velocities are considered, and 20 fluctuating wind velocity time history samples are generated for each. If the two-parameter lognormal probability distribution function is used to describe the wind-resistant fragility, the mean, μ, and standard deviation, σ, can be calculated by taking the logarithm of the average wind velocity under the limit state of each performance level. The probability of failure of the logarithm of any average wind velocity, F(x
μ, σ), under each target performance level can be
determined by:
2 2 21
,
2
t u xP
F x
e
d t
(3)where x is the logarithm of the average wind velocity, that is, x = ln(V10); and V10 is the average wind velocity
within a 10 min time interval at a height of 10 m under the terrain roughness where the building is located.
4.2 Modeling of tower crane
Based on the assumption mentioned previously, an elastic finite element model is established for the main
Fig. 17 Plastic hinges in one standard section
Fig. 18 Skeleton curve model of a plastic hinge structure. The tower cranes illustrated in Section 2.3 are modeled using the SAP2000 program with some inelastic beam-column elements to capture their possible inelastic behavior. All components in the crane consist of Q235 grade steel with an elasticity modulus of 206 GPa and yielding strength of 235 MPa. The inelastic elements have concentrated M-hinges and PMM-hinges at the ends of the beams and columns, respectively, while the P-hinges are used for the diagonal braces, which are located in the middle part. Fig. 17 shows the distribution of the plastic hinges of the elements in one standard section of the tower crane. The four-segment skeleton curve defined in SAP2000 (see Fig. 18) combined with the Takeda hysteresis rule is used to model the behavior of the plastic hinges. The coordinates of the characteristic points in the skeleton curves of the P-hinges, M-hinges, and PMM-hinges are determined by the FEMA 273 report (1997), as well as the three plasticity-related performance levels, that is, immediate occupancy (IO), life safety (LS), and collapse prevention (CP). To facilitate analysis, the skeleton curves of the P-hinges and M-hinges are symmetrical in the first and third quartiles.
4.3 Performance levels and quantitative indexes
The performance levels introduced are used to describe the plasticity development states of the tower crane. To fully describe the status of a tower crane under strong wind, the operational (OP) performance level is also included with the three plasticity-related performance levels (IO, LS, and CP). As no relevant guidelines are available for the descriptions of the performance levels of tower cranes, the relevant descriptions in the ASCE PBWE guideline (ASCE 2019) are adopted with the combination of those provided in the Chinese seismic code (GB50011-2010 2016), as
Fig. 19 Story drift response of tower crane in Pushover analysis
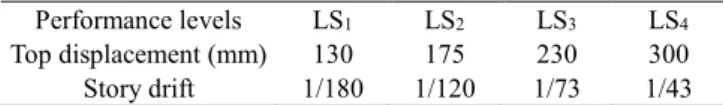
listed in Table 6. Table 6 lists some descriptions of the different performance levels of tower cranes and the corresponding limits for the two commonly used quantitative indexes, that is, the top displacement and story drift of a tower crane. The former index is used to reflect the global performance of a crane, while the latter is used to identify the possible local unfavorable positions. The selection of these indexes depends on the situation of concern. The story drift of tower cranes refers to the relative displacement between adjacent standard segments divided by the height of one standard segment. All the suggested peak story drifts for the performance levels in both the ASCE PBWE guideline (ASCE 2019) and the Chinese seismic code (GB50011-2010 2016) are based entirely on buildings. Obviously, they are not applicable to more flexible latticed tower cranes consisting of a number of angle steel components. Instead, a static nonlinear pushover analysis is performed to evaluate the peak story drifts of the four performance levels, that is, OP, IO, LS, and CP, for the case tower crane according to the descriptions listed in Table 6. The displacement-based control scheme is adopted in the pushover analysis, where the top point of the tower crane is set as the monitoring point and the target displacement is set as 400 mm. The wind load of the tower crane, calculated by the wind profile and shape factor, is applied at several vertical mass points as the horizontal force. If the tower crane is in different construction stages, the wind profile shape will be modified accordingly. Only
(a) Top displacement
(b) Story drift
Fig. 20 Performance indexes at four limit states (construction stage No.1)
Table 7 Limits of quantitative indexes for all performance levels
Performance levels LS1 LS2 LS3 LS4
Top displacement (mm) 130 175 230 300 Story drift 1/180 1/120 1/73 1/43
the case in which the wind direction is parallel to the lifting arm of the tower crane is considered. The five damage levels can be divided by the limits of the indexes corresponding to the four performance levels, i.e., operational ( LS1), slight ((LS1, LS2]), moderate ((LS2,
LS3]), severe ((LS3, LS4]) and collapse-critical (> LS4).
Based on the results from 13 analytical steps, Fig. 19 Table 6 Descriptions of four performance levels and quantitative indexes (GB 50011-2010 2016, ASCE 2019)
Performance level
& limit state Operational (OP)
Immediate occupancy
(IO) Life safety (LS) Collapse prevention (CP)
Performance level
The structural system shall remain elastic. The building systems shall remain operational during
the wind event. No damage or minor damage in structural components;
operational without repairing.
Specific elements or components of the structural system shall be
permitted to become inelastic. Slight damage in
structural components; usable after repair.
The structural system shall withstand a design
wind event with a low probability of partial or total collapse. Structure is
stable; possess adequate load-carrying capacity.
Structure remains stable; other damage is
acceptable.
Limit state No structural damage; first plastic hinge appears; operational.
Key load-bearing component yields; slight damage in 20% structural
components.
20% ~ 50% of load-bearing components are
damaged; 20% of structural components are
severely damaged and others are slightly
damaged.
Structure is severely damaged; 50% or more of
structural components yield; local mechanism is
shows the distributions of the story drifts along the height of the tower crane. It can be seen from Fig. 19 that the story drift eventually reaches its maximum at the 21st standard
segment, although this segment does not always exhibit the largest story drift in the previous analytical steps. It is clear that this segment dominates the failure pattern of the tower crane. Therefore, the quantitative limit of story drift is defined according to the curve of the story shear force and story drift of the 21st standard segment. From the pushover analysis, Fig. 20 shows the relation curves between the reaction at the base of the crane and the two quantitative indexes for construction stage No. 1, where the indexes corresponding to the four limits are dotted and listed in Table 7. That is, the limits of the quantitative indexes for all
performance levels listed in Table 7 are the abscissa values corresponding to different performance level points in Fig. 20. It is noteworthy that the criteria and methods proposed in Table 6 are general and referable, while the calculation results shown in Table 7 and Fig. 20 are only for the specific tower crane structure herein without universality.
4.4 Analytical results
With the results from the samples, Fig. 21 shows the relation between the average wind velocity and the maximum top displacement of the tower crane under the four performance levels. The scatter in the samples at any average wind velocity is not significant. When the average Fig. 21 Relation between average wind velocity and maximum top displacement of tower crane
Table 8 Critical failure wind velocity corresponding to each performance level (m/s)
Performance level OP IO LS CP
Top displacement 79.16 97.64 113.21 121.31 Story drift 80.39 99.65 113.90 121.96
wind velocity is greater than 121.5 m/s, the maximum top displacement of the crane will reach 1.0 ~ 3.0 m for some fluctuating wind velocity samples, implying the occurrence of structural instability of the tower crane. Similar observations can be made in the relation between the average wind velocity and the maximum story drift of the tower crane, as shown in Fig. 22. According to the limits of the quantitative indexes suggested in Table 7 determined by the pushover analysis prior to the IDAs, the fragility curves can be developed with the analytical data, as shown in Fig. 23 for the two quantitative indexes. Owing to the slight scatter in the fluctuating wind velocity samples generated from the same PSD function for each average wind velocity, the range of the wind velocities of the samples that cause structural failure under each performance level is very narrow. Thus, all the S-type fragility curves for all performance levels are very steep. In the case of the performance level OP, the probability of failure ranging from 0% to 100% corresponds to a range of average wind velocities from 75 m/s to 85 m/s.
4.5 Critical failure curves
The generation procedures of the critical failure curve proposed by Fu et al. (2016) are adopted herein. The critical
wind velocities corresponding to the 10% failure probability of the fragility curves are calculated. When exceeded, the structure is considered likely to collapse. Subsequently, the actual wind velocity at the height of the tower crane in Eq. (1) is replaced with critical wind velocities. The critical failure curves can be derived by plotting the relationship between the height of the tower crane and the average wind velocity. Table 8 lists the critical failure wind velocities of the tower crane for all the performance levels. The results for the two quantification indexes are close to each other. The critical failure curves of the tower crane for all four performance levels are shown in Fig. 24. Based on these curves, the maximum appropriate height of the tower crane for each performance level under a specific average wind velocity can be evaluated. Above this height, the corresponding performance level would be exceeded. 5. Conclusions
• The main structure exerts its influence on the tower crane via connection supports between them. Such influence tends to become increasingly significant as construction height increases. When the tower crane is attached to the core tube at a high level, a large relative displacement can be observed among the supports as a result of the wind-induced vibration in the main structure. A large relative displacement between the supports can substantially amplify the crane response. The influence becomes more significant when the lifting arm is perpendicular to the plane of the connection supports.
(a) Top displacement (b) Story drift
Fig. 23 Fragility curves of tower crane
(a) Top displacement (b) Story drift
• The failure of the outer-attached tower crane could be triggered by the steel components near the upper support, although the displacement response of the supports did not significantly affect the critical failure displacement of the tower crane. To avoid premature failure arising from excessive displacement of tower cranes or inadequate anchorage resistance of connection supports, the flexibility of super-tall buildings should be more reasonably addressed in the design of outer-attached tower cranes, especially for anchorage systems. • The slight scatter observed in the fluctuating wind velocity samples generated from a specific PSD function can cause the fragility curves to be in a narrow S-shape. For example, in the case of the performance level OP, the probability of failure ranging from 0% to 100% corresponds to a range of average wind velocities from 75 m/s to 85 m/s. The wind-resistant fragility curves based on the quantitative indexes of the top displacement and story drift are close to each other. • Using the critical failure curves of the tower crane for all performance levels, the maximum appropriate height of the tower crane for each performance level under a specific average wind velocity can be evaluated. Above this height, the corresponding performance level would be exceeded, and proper reinforcement measures should be taken during construction.
Acknowledgments
This research is financially supported by the National Key R&D Program of China (Grant No. 2016YFC0802000) and the Fundamental Research Funds for the Central Universities (Grant No. DUT19G208).
References
CEB-FIP (2010), Model Code 2010, International Federation for Structural Concrete; London, U.K.
Computers & Structures, Inc. (2011), Software SAP2000 Version 15.1.0, California, U.S.A.
https://www.csiamerica.com/products/sap2000.
Craig, J.R.R. and Bampton, M.C.C. (1968), “Coupling of substructures for dynamic analyses”, AIAA J., 6(7), 1313-1319. https://doi.org/10.2514/3.4741.
Davenport, A.G. (1961), “The spectrum of horizontal gustiness near the ground in high winds”, Quart. J. Royal Meteorol. Soc., 87(372), 194-211. https://doi.org/10.1002/qj.49708737208. Deodatis, G. and Shinozuka, M. (1988), “Auto-Regressive model
for nonstationary stochastic processes”, J. Eng. Mech., 114(11), 1995-2012.
https://doi.org/10.1061/(ASCE)0733-9399(1988)114:11(1995). Eden, J.F., Iny, A. and Butler, A.J. (1981), “Cranes in storm
winds”, Eng. Struct., 3(3), 175-180.
https://doi.org/10.1016/0141-0296(81)90026-2.
FEMA 273 (1997), NEHRP Guidelines for the Seismic Rehabilitation of Buildings, Federal Emergency Management Agency; Washington, D.C., U.S.A.
Fouad, N.S., Mahmoud, G.H. and Nasr, N.E. (2018), “Comparative study of international codes wind loads and CFD results for low rise buildings”, Alexandria Eng. J., 57(4), 3623-3639. https://doi.org/10.1016/j.aej.2017.11.023.
Fu X., Li H.N. and Li G. (2016), “Fragility analysis and estimation of collapse status for transmission tower subjected to wind and rain load”, Struct. Safety, 58, 1-10.
https://doi.org/10.1016/j.strusafe.2015.08.002.
Fuchs, A., Tallon, M. and Vernin, J. (1994), “Folding-up of the vertical atmospheric turbulence profile using an optical technique of movable observing plane”, Proceedings of SPIE - The International Society for Optical Engineering, 2222, 682-692. Orlando, FL, United States.
https://doi.org/10.1117/12.178041.
GB 50009-2012 (2012), Load Code for The Design of Building Structures, Ministry of Housing and Urban-Rural Development of People’s Republic of China; Beijing, China. (in Chinese). GB 50011-2010 (2016), Code for Seismic Design for Buildings,
Ministry of Housing and Urban-Rural Development of People’s Republic of China; Beijing, China. (in Chinese).
GB/T 13752-2017 (2017), Code for Design of Tower Cranes, AQSIQ and SAC; Beijing, China. (in Chinese).
Hong, H.P., Beadle, S. and Escobar, J.A. (2001), “Probabilistic assessment of wind-sensitive structures with uncertain parameters”, J. Wind Eng. Ind. Aerod., 89(2001), 893-910. https://doi.org/10.1016/S0167-6105(01)00076-9.
Hu S.Y., Song, L.L. and Li, Q.S. (2011), “Monitoring of typhoons in surface boundary layer and analysis of wind turbulence characteristics”, J. Build. Struct., 32(4), 1-8.
https://doi.org/10.14006/j.jzjgxb.2011.04.001. (in Chinese). ISBN 978-0-7844-8218-6 (2019), Pre-standard for
Performance-Based Wind Design, ASCE; Reston, Virginia, U.S.A.
Kassir, W., Soize, C., Heck, J. V. and De Oliveira, F. (2017), “Non-Gaussian approach for equivalent static wind loads from wind tunnel measurements”, Wind Struct., 25(6), 589-608.
https://doi.org/10.12989/was.2017.25.6.589.
Kim, J.H., Kim, J. and Lee, P.S. (2017), “Improving the accuracy of the dual Craig-Bampton method”, Comput. Struct., 191, 22-32. https://doi.org/10.1016/j.compstruc.2017.05.010.
Klinger, C. (2014), “Failures of cranes due to wind induced vibrations”, Eng. Fail. Anal., 43(43), 198-220.
https://doi.org/10.1016/j.engfailanal.2013.12.007.
Lee, K.H. and Rosowsky, D.V. (2005), “Fragility assessment for roof sheathing failure in high wind regions”, Eng. Struct., 27(6), 857-868. https://doi.org/10.1016/j.engstruct.2004.12.017. Lepri, P., Vecenaj, Ž., Kozmar, H. and Grisogono, B. (2017),
“Bora wind characteristics for engineering applications”, Wind Struct., 24(6), 579-611.
https://doi.org/10.12989/was.2017.24.6.579.
Li, Q.S., Xiao, Y.Q., Wong, C.K. and Jeary, A.P. (2004), “Field measurements of typhoon effects on a super tall building”, Eng. Struct., 26(2), 233-244.
https://doi.org/10.1016/j.engstruct.2003.09.013.
Li, Y. and Ellingwood, B.R. (2006), “Hurricane damage to residential construction in the US: Importance of uncertainty modeling in risk assessment”, Eng. Struct., 28(7), 1009-1018. https://doi.org/10.1016/j.engstruct.2005.11.005.
Mara, T.G. (2010), “Effects of a construction tower crane on the wind loading of a high-rise building”, J. Struct. Eng., 136(11), 1453-1460.
https://doi.org/10.1061/(asce)st.1943-541x.0000243.
Mashayek, A., Ferrari, R., Merrifield, S., Ledwell, J.R., St Laurent, L. and Garabato, A.N. (2017), “Topographic enhancement of vertical turbulent mixing in the Southern Ocean”, Nature Commun., 8, 1-12.
https://doi.org/10.1038/ncomms14197.
Mcgettigan (2010), World-Wide Tower Crane Accident Statistics. http://www.towercranesupport.com/tower_crane_accidents.php. Scarabino, A., Marañón, D.L.J., Delnero, J.S. and Bacchi, F. (2005), “Drag coefficients and Strouhal numbers of a port crane boom girder section”, J. Wind Eng. Ind. Aerod., 93(6), 451-460.
https://doi.org/10.1016/j.jweia.2005.03.004.
Seo, D.W. and Caracoglia, L. (2013), “Estimating life-cycle monetary losses due to wind hazards: Fragility analysis of long-span bridges”, Eng. Struct., 56(6), 1593-1606.
https://doi.org/10.1016/j.engstruct.2013.07.031.
Stewart, M.G., Ryan, P.C., Henderson, D.J. and Ginger, J.D. (2016), “Fragility analysis of roof damage to industrial buildings subject to extreme wind loading in non-cyclonic regions”, Eng. Struct., 128, 333-343.
https://doi.org/10.1016/j.engstruct.2016.09.053.
Storm Prediction Center (2018), Beaufort Wind Scale. https://www.spc.noaa.gov/faq/tornado/beaufort.html
Tongji Architectural Design (Group) Co., Ltd. (2009), Ultra-limit Seismic Design Inspection Report: Shanghai Tower Project, Thornton Tomasetti, Inc, Shanghai, China. (in Chinese). Turner, B.L., Kasperson, R.E., Matsone, P.A., McCarthyf, J.J.,
Corell, R.W., Christensene, L. and Schillerb, A. (2003), “A framework for vulnerability analysis in sustainability science”, Proceedings of the National Academy of Sciences of the United States of America, 100(14), 8074-8079.
https://doi.org/10.1073/pnas.1231335100.
Vanvinckenroye, H., Andrianne, T. and Denoel, V. (2018), “First passage time as an analysis tool in experimental wind engineering”, J. Wind Eng. Ind. Aerod., 177, 366-375. https://doi.org/10.1016/j.jweia.2018.03.032.
Voisin, D., Grillaud, G., Solliec, C., Beley-Sayettat, A., Berlaud, J.L. and Miton, A. (2004), “Wind tunnel test method to study out-of-service tower crane behaviour in storm winds”, J. Wind Eng. Ind. Aerod., 92(7), 687-697.
https://doi.org/10.1016/j.jweia.2004.03.005.
Wang, G. and Wang, L. (2020), “Coupling relationship of the non-ideal parallel mechanism using modified Craig-Bampton method”, Mech. Syst. Sig. Processing, 141, 1-28.
https://doi.org/10.1016/j.ymssp.2019.106471.
White, G.F. (1974), Natural Hazards, Oxford University Press, New York, NY, U.S.A.
Yan, A.-M., Kerschen, G., De Boe, P. and Golinval, J.-C. (2005), “Structural damage diagnosis under varying environmental conditions - part II: local PCA for non-linear cases”, Mech. Syst. Sig. Processing, 19(4), 865-880.
https://doi.org/10.1016/j.ymssp.2004.12.003.