INTRODUCTION
End-stage renal disease (ESRD) patients often suffer from
var-ious cardiovascular (CV) diseases, which account for consid-erable morbidity and mortality.1,2 In addition, diabetes melli-tus (DM), which comprises the most common cause of ESRD,3 is a major risk factor for CV diseases. Thus, it can be reason-ably hypothesized that DM would play an additive role in the generation and advancement of CV diseases in ESRD patients compared to patients with ESRD due to other etiologies (non-DM ESRD). With recent advances in diagnostic modalities for CV diseases and our enhanced knowledge of the CV system, we currently have better screening protocols for CV system even in subclinical stage patients. However, comprehensive inves-tigation of the prevalence and features of CV system in ESRD patients with and without DM has not yet been performed. In this study, we assessed various structural and functional ab-normalities in the CV system in ESRD patients and explored additive impact of DM on subclinical CV damage.
The Impact of Diabetes Mellitus on Vascular Biomarkers
in Patients with End-Stage Renal Disease
Jeonggeun Moon
1*, Chan Joo Lee
2*, Sang-Hak Lee
2, Seok-Min Kang
2,
Donghoon Choi
2, Tae-Hyun Yoo
3, and Sungha Park
21Cardiology Division, Department of Internal Medicine, Gachon University of Medicine and Science, Incheon;
2Division of Cardiology, Severance Cardiovascular Hospital and Cardiovascular Research Institute, Yonsei University College of Medicine, Seoul; 3Division of Nephrology, Department of Internal Medicine, Yonsei University College of Medicine, Seoul, Korea.
Purpose: Diabetes mellitus (DM) is the most common cause of end-stage renal disease (ESRD) and an important risk factor for cardiovascular (CV) disease. We investigated the impact of DM on subclinical CV damage by comprehensive screening protocol in ESRD patients.
Materials and Methods: Echocardiography, coronary computed tomography angiogram, 24-h ambulatory blood pressure moni-toring, and central blood pressure with pulse wave velocity (PWV) were performed in 91 ESRD patients from the Cardiovascular and Metabolic disease Etiology Research Center-HIgh risk cohort.
Results: The DM group (n=38) had higher systolic blood pressure than the non-DM group (n=53), however, other clinical CV risk factors were not different between two groups. Central aortic systolic pressure (148.7±29.8 mm Hg vs. 133.7±27.0 mm Hg, p= 0.014), PWV (12.1±2.7 m/s vs. 9.4±2.1 m/s, p<0.001), and early mitral inflow to early mitral annulus velocity (16.7±6.4 vs. 13.7±5.9, p= 0.026) were higher in the DM group. Although the prevalence of coronary artery disease (CAD) was not different between the DM and the non-DM group (95% vs. 84.4%, p=0.471), the severity of CAD was higher in the DM group (p=0.01). In multivariate regres-sion analysis, DM was an independent determinant for central systolic pressure (p=0.011), PWV (p<0.001) and the prevalence of CAD (p=0.046).
Conclusion: Diabetic ESRD patients have higher central systolic pressure and more advanced arteriosclerosis than the non-DM control group. These findings suggest that screening for subclinical CV damage may be helpful for diabetic ESRD patients. Key Words: End-stage renal disease, diabetes mellitus, target organ damage, coronary artery disease, hypertension
Yonsei Med J 2017 Jan;58(1):75-81
https://doi.org/10.3349/ymj.2017.58.1.75 pISSN: 0513-5796 · eISSN: 1976-2437
Received: November 24, 2015 Revised: July 31, 2016 Accepted: August 16, 2016
Co-corresponding authors: Dr. Sungha Park, Division of Cardiology, Severance
Cardiovascular Hospital, Yonsei University College of Medicine, 50-1 Yonsei-ro, Seodaemun-gu, Seoul 03722, Korea.
Tel: 82-2-2228-8455, Fax: 82-2-393-2041, E-mail: shpark0530@yuhs.ac and Dr. Tae-Hyun Yoo, Division of Nephrology, Department of Internal Medicine, Yonsei University College of Medicine, 50-1 Yonsei-ro, Seodaemun-gu, Seoul 03722, Korea. Tel: 82-2-2228-1975, Fax: 82-2-393-6884, E-mail: yoosy0316@yuhs.ac
*Jeonggeun Moon and Chan Joo Lee contributed equally to this work. •The authors have no financial conflicts of interest.
© Copyright: Yonsei University College of Medicine 2017
This is an Open Access article distributed under the terms of the Creative Com-mons Attribution Non-Commercial License (http://creativecomCom-mons.org/licenses/ by-nc/3.0) which permits unrestricted non-commercial use, distribution, and repro-duction in any medium, provided the original work is properly cited.
MATERIALS AND METHODS
The current study used the Cardiovascular and Metabolic dis-ease Etiology Research Center-HIgh risk cohort (CMERC-HI) data, which is a prospective cohort study aimed at developing individual prevention strategies for patients with high risks of CV disease (clinicaltrial.gov NCT02003781). The CMERC-HI cohort enrolls patients who are 20 to 80 years old and meet at least one of the following inclusion criteria: high-risk hyper-tension patients [estimated glomerular filtration rate (eGFR) >60 mL/min with target organ damage or eGFR ≤60 mL/min]; DM patients with albuminuria; anuric ESRD patients on dial-ysis (urine output less than 200 mL/day); and relatives of acute myocardial infarction patients who were less than 55 years old for men or 65 years old for women. Exclusion criteria were a history of acute coronary syndrome, symptomatic coronary artery disease (CAD), symptomatic peripheral artery disease, heart failure, life expectancy less than 6 months due to non-CV disease, women who were pregnant or nursing, and a his-tory of contrast allergy and related side effects. Finally, 1017 patients were enrolled between November 2013 and January 2015 at the Severance Hospital in Seoul, Republic of Korea. This study was performed in a subgroup of ESRD patients with an-uria. The Institutional Review Board of the Yonsei University Health System Clinical Trial Center approved the study proto-col, and the written informed consent was obtained from all participants.
Twenty-four hour ambulatory blood pressure monitoring (ABPM) was performed using a Takeda TM-2430 instrument (A&D Medical, Tokyo, Japan) with readings taken every 30 min. ABPM measurements were done on the arm without the arte-riovenous fistula. Daytime and nighttime periods were defined according to information provided by the patient. Ambulatory blood pressure (BP) readings were averaged for 24 hours, day-time, and nighttime. Patients were classified according to dip-ping pattern as follows: dippers (nighttime BP decrease >10%), non-dippers (nighttime BP decrease <10% and >0%) and re-verse dippers (nighttime BP > daytime BP).
Central hemodynamics were evaluated in the sitting posi-tion after 10 min of rest using the SphygmoCor system (AtCor Medical, Sydney, Australia). A high-fidelity micromanometer (Millar Instruments, Houston, TX, USA) was used to record peripheral pressure waveforms from the radial arteries as re-ported previously.4,5 Radial artery waveforms were obtained from the arm without the arteriovenous fistula. The Sphygmo-Cor system obtains the ascending aortic pressure waveform from the radial artery waveform using its validated mathemat-ical transfer function. Central systolic BP, diastolic BP, pulse pressure, augmentation pressure, forward wave amplitude, and augmentation index (AI) were acquired from the aortic pres-sure waveform analyses. Pulse prespres-sure was calculated as the difference between systolic and diastolic pressures. Augmen-tation pressure is the difference between the second and first
systolic peak pressures, and AI was defined as the ratio of aug-mentation pressure to aortic pulse pressure. The pulse wave velocity (PWV) was measured as specified previously.6 Briefly, electrocardiogram and carotid/femoral pulse waves were ob-tained simultaneously to calculate the transit time using the foot-to-foot method. The distance traveled by the pulse wave was calculated by subtracting the sternal notch-right carotid site from right femoral site-sternal notch distances.6
In each patient, standard 2-dimensional transthoracic echo-cardiography was performed following The American Society of Echocardiography guidelines.7 Left ventricular (LV) end-diastol-ic dimension (LVEDD) and LV end-systolend-diastol-ic dimension (LVESD), end-diastolic interventricular septum (IVSd), and LV posterior wall thickness (PWd) were measured. LV mass was calculated using the formula 0.8 [1.04 (IVSd+LVEDD+PWd)3-LVEDD3]+0.6 (g) indexed to the body surface area. The LV ejection fraction (EF) was obtained using the modified Simpson’s method. Left atrial (LA) volume was measured using the biplane area-length method indexed to the body surface area [left atrial volume in-dex (LAVI)]. Using Doppler, peak velocities of early (E) and late diastolic mitral inflow were measured. Early (E’) and late dia-stolic mitral annulus velocity were determined at the septal cor-ner of the mitral annulus using tissue Doppler imaging. The ratio of E/E’, which reflects LV filling pressure,8 was calculated. Two experienced echocardiologists who were unaware of the pa-tient’s clinical information analyzed the echocardiographic data. All testing, data acquisition, and image post-processing for coronary computed tomography angiogram (CCTA) were in accordance with the Society of Cardiovascular Computed To-mography guidelines on CCTA acquisition.9,10 CCTA was per-formed with multi-detector row computed tomography scan-ners of 64 rows or greater (Aquilion ONE; Toshiba Medical Systems, Tokyo, Japan). Coronary arteries were evaluated ac-cording to a 16-segment coronary artery model modified from the American Heart Association classification.11 Atherosclerot-ic plaques were defined as any structure >1 mm2 within the ves-sel lumen or adjacent to the vesves-sel lumen that could be clearly distinguished from the lumen and neighboring pericardial tis-sue or epicardial fat. CAD was defined as the presence of ath-erosclerotic plaques in each coronary artery segment. Minimal CAD was defined as coronary artery segments exhibiting pl-aques with <50% luminal narrowing, whereas significant CAD was defined as ≥50% luminal narrowing. The extent of signifi-cant CAD was categorized into 1-vessel disease (VD), 2-VD, and 3-VD. In addition, coronary artery calcium score (CACS) was measured in analyzable patients according to the scoring sys-tem described by Agatston, et al.12 and Nakazato, et al.13
Continuous variables are expressed as mean±standard de-viation after normality tests were performed for each parame-ter to assess whether a data set was normally distributed. Cat-egorical variables were expressed as numbers and percentages. Variables of the two groups were compared using two-sample t-tests for continuous variables and chi-squared tests and
Fish-er’s exact tests for categorical variables. In subgroup analyses for evaluating impact of dialysis modality, variables were com-pared by using the Mann-Whitney U test. Linear regression analyses and binary logistic regression analyses were performed to test the independent impact of DM on dependent vari-ables. p<0.05 was considered statistically significant.
RESULTS
The baseline clinical characteristics of patients are summarized in Table 1. Patients in the DM group had higher systolic BP, and therefore, they took more antihypertensive medications such as beta-blocker and calcium channel blocker than patients in Table 1. Baseline Clinical Characteristics
Characteristics/Measures DM (n=38) Non-DM (n=53) p value
Demography Age, yrs 56.0±13.0 51.2±13.6 0.096 Male, n (%) 22 (57.9) 30 (56.6) 1.000 Hypertension, n (%) 37 (97.4) 47 (88.7) 0.256 Mode of dialysis 0.894 Hemodialysis, (%) 23 (60.5) 34 (64.2) Peritoneal dialysis, (%) 15 (39.5) 19 (35.8)
ESRD duration, yrs 16.0±25.6 13.4±13.7 0.575
Height, cm 163.4±8.9 162.4±9.3 0.590
Weight, kg 66.6±14.2 62.0±12.5 0.104
Body mass index, kg/m2 24.8±3.9 23.4±3.4 0.071
Waist, cm 87.4±11.9 83.2±9.5 0.065
Hip, cm 93.8±6.9 91.0±6.9 0.061
Thigh, cm 44.8±5.2 45.0±5.2 0.895
SBP, mm Hg 153.9±27.9 141.2±23.7 0.021
DBP, mm Hg 77.9±11.8 81.9±12.9 0.140
Heart rate, beats/min 70.8±11.8 70.8±14.0 0.994
Medications Insulin treatment, n (%) 12 (31.6) 0 (0) <0.001 Beta-blocker, n (%) 26 (68.4) 24 (45.3) 0.048 ACEi/ARB, n (%) 26 (68.4) 31 (58.5) 0.456 CCB, n (%) 22 (57.9) 18 (34.0) 0.040 Statin, n (%) 19 (50.0) 16 (30.2) 0.090 Laboratory Hemoglobin, g/dL 10.2±1.7 10.9±1.4 0.033 Calcium, mg/dL 8.5±1.0 9.0±0.8 0.005 Phosphate, mg/dL 5.1±1.8 4.8±1.1 0.324 Glucose, mg/dL 128.3±58.3 94.3±19.4 0.001 BUN, mg/dL 52.5±23.1 59.6±23.5 0.158 Creatinine, mg/dL 9.7±3.5 10.5±3.7 0.294 Uric acid, mg/dL 6.3±1.9 6.4±1.7 0.956 Cholesterol, mg/dL 156.9±36.3 162.5±35.8 0.470 Triglycerides, mg/dL 126.4±86.5 105.6±43.2 0.184 HDL cholesterol, mg/dL 42.8±16.0 46.2±12.3 0.265 LDL cholesterol, mg/dL 85.7±28.6 87.2±27.1 0.804 Protein, g/dL 6.4±0.9 6.6±0.7 0.206 Albumin, g/dL 3.5±0.6 3.8±0.5 0.006 Sodium, mEq/L 137.8±3.3 138.5±2.8 0.265 Potassium, mEq/L 4.7±0.8 5.0±0.9 0.190 HbA1C, % 6.6±1.4 5.2±0.3 <0.001 C-reactive protein, mg/dL 7.3±14.7 4.3±7.7 0.267
ESRD, end-stage renal disease; SBP, systolic blood pressure; DBP, diastolic blood pressure; ACEi, angiotensin converting enzyme inhibitor; ARB, angiotensin re-ceptor blocker; CCB, calcium channel blocker; BUN, blood urea nitrogen; HDL, high-density lipoprotein; LDL, low-density lipoprotein; DM, diabetes mellitus; HbA1C, glycosylated hemoglobin.
the non-DM group. Other demographic findings were similar between the DM and non-DM groups. In laboratory findings, the DM group had higher fasting glucose and glycosylated he-moglobin levels. In addition, there were statistical differences
in hemoglobin, serum calcium, and albumin between the groups. However, uric acid levels and lipid profiles, which are well-known risk factors for CV diseases, did not differ be-tween the two groups.
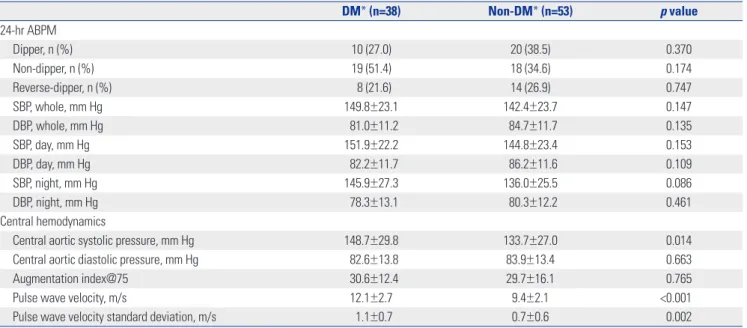
Table 2. Twenty-Four Hour-Ambulatory Blood Pressure Monitoring (ABPM) and Central Hemodynamics Assessed with Noninvasive Tonometry
DM* (n=38) Non-DM* (n=53) p value 24-hr ABPM Dipper, n (%) 10 (27.0) 20 (38.5) 0.370 Non-dipper, n (%) 19 (51.4) 18 (34.6) 0.174 Reverse-dipper, n (%) 8 (21.6) 14 (26.9) 0.747 SBP, whole, mm Hg 149.8±23.1 142.4±23.7 0.147 DBP, whole, mm Hg 81.0±11.2 84.7±11.7 0.135 SBP, day, mm Hg 151.9±22.2 144.8±23.4 0.153 DBP, day, mm Hg 82.2±11.7 86.2±11.6 0.109 SBP, night, mm Hg 145.9±27.3 136.0±25.5 0.086 DBP, night, mm Hg 78.3±13.1 80.3±12.2 0.461 Central hemodynamics
Central aortic systolic pressure, mm Hg 148.7±29.8 133.7±27.0 0.014
Central aortic diastolic pressure, mm Hg 82.6±13.8 83.9±13.4 0.663
Augmentation index@75 30.6±12.4 29.7±16.1 0.765
Pulse wave velocity, m/s 12.1±2.7 9.4±2.1 <0.001
Pulse wave velocity standard deviation, m/s 1.1±0.7 0.7±0.6 0.002
SBP, systolic blood pressure; DBP, diastolic blood pressure; DM, diabetes mellitus. *One patient in the DM group and the non-DM group did not received ABPM.
Table 3. Transthoracic Echocardiography and CCTA
Echocardiography DM (n=38) Non-DM (n=53) p value
LVEDD, mm 52.1±5.2 51.8± 5.7 0.809 LVESD, mm 34.4±4.6 34.6± 5.1 0.910 LVEF, % 65.0±7.3 64.4± 8.3 0.738 IVSd, mm 11.3±1.8 10.9±1.8 0.256 PWd, mm 11.1±1.5 10.8±1.7 0.418 LVMI, g/m2 134.6±33.7 133.1±34.2 0.837 LAVI, mL/m2 65.1±21.0 58.6±21.5 0.159 E, cm/s 0.8±0.3 0.7±0.2 0.016 A, cm/s 1.0±0.2 0.8±0.2 0.001 E’, cm/s 5.4±1.5 5.6±1.7 0.414 A’, cm/s 8.6±1.7 8.3±1.9 0.593 E/E’ 16.7±6.4 13.7±5.9 0.026
CCTA DM (n=20) Non-DM (n=32) p value
Presence of CAD, n (%) 19 (95) 27 (84.4) 0.471
Presence of significant CAD, n (%) 9 (45) 3 (9.4) 0.009
Severity of CAD, n (%) 0.010 None 1 (5.0) 5 (15.6) Minimal CAD 10 (50.0) 24 (75) 1-vessel 6 (30) 1 (3.1) 2-vessel 2 (10) 1 (3.1) 3-vessel 1 (5) 1 (3.1)
LVESD, left ventricular end-systolic dimension; LVEDD, left ventricular end-diastolic dimension; LVEF, left ventricular ejection fraction; IVSd, diastolic interventric-ular septum; PWd, diastolic posterior wall thickness; E, early diastolic mitral inflow velocity; A, late diastolic mitral inflow velocity; LVMI, left ventricinterventric-ular mass index; LAVI, left atrial volume index; E’, early diastolic mitral annulus velocity; A’, late diastolic mitral annulus velocity; CCTA, coronary computed tomography an-giography; CAD, coronary artery disease; DM, diabetes mellitus.
Data from 24-h ABPM, central hemodynamics, and PWV are shown in Table 2. Results from the 24-h ABPM were similar be-tween the two groups. However, central aortic systolic pressure and PWV were significantly higher in DM patients compared to non-DM subjects (p<0.05). Table 3 provides the data from echo-cardiography and CCTA examinations. In DM patients, E/E’ was significantly higher despite similar LV EF, indicating that DM pa-tients have higher LV filling pressure than non-DM papa-tients.
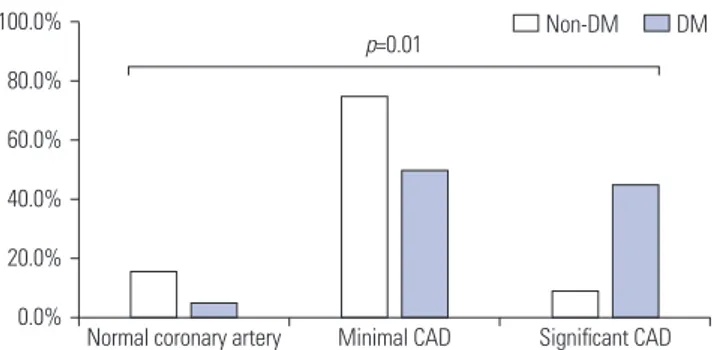
CCTA was performed in 52 patients, and the presence of atherosclerotic plaques in each coronary artery segment was not different between the DM and non-DM groups (95% vs. 84.4%; p=0.471) (Table 3). However, the prevalence of signifi-cant CAD was 23.1% (n=12); and it was higher in the DM group (45%) than the DM group (9.4%). As shown in Fig. 1, it is noted that the prevalence of significant CAD (the presence of ≥50% stenosis in any major coronary artery) was greater in the DM group (p=0.010). However, CACS, evaluated in analyzable
pa-tients (20 non-DM papa-tients and 19 DM papa-tients), was not dif-ferent between the groups (non-DM group, 129.4±263.8; DM group, 360.3±678.7; p=0.703).
We performed statistical analyses to determine the associa-tion of clinical variables and the independent impact of DM on various vascular biomarkers. These data are provided in Table 4 and 5. The presence of DM independently determined central aortic pressure, PWV (Table 4), and the presence of CAD (Ta-ble 5) in both univariate and multivariate analyses. The pres-ence of DM had significant association with E/E’ in univariate analysis, however, it was not independent determinant for E/ E’ after adjustment with other variables (Table 4).
DISCUSSION
The core findings of this study are: 1) despite similar demog-raphy, DM patients had higher central aortic systolic pressure and faster PWV; and 2) DM ESRD patients have more CAD and suffered from more severe CAD than non-DM ESRD patients. These results can be interpreted to indicate that DM ESRD pa-tients have more advanced arteriosclerosis and more severe CAD than non-DM ESRD subjects. To the best of our knowl-edge, the current research is the first to assess the additive im-pact of DM on CV damage profile using a comprehensive sc-reening protocol in ESRD patients who have a high risk of CV diseases. Based on the current data, we guardedly propose that more aggressive diagnostic work-ups and tailored manage-ment may be helpful for DM ESRD patients.
Although data from 24-h ABPM did not differ, DM ESRD Table 4. Linear Regression Analyses for Independent Determinants of Central Systolic Aortic Pressure, Pulse Wave Velocity, and E/E’
Variable Univariate model Multivariate model
β t p value β t p value
Central aortic systolic pressure
Age 0.248 1.095 0.276 0.153 0.660 0.511
Male 2.032 0.329 0.743 3.379 0.561 0.576
ESRD duration 0.006 0.040 0.968 -0.001 -0.006 0.995
Peritoneal dialysis -2.137 -0.339 0.736 -3.060 -0.474 0.637
DM etiology 14.986 2.503 0.014 15.950 2.593 0.011
Pulse wave velocity
Age 0.082 4.115 <0.001 0.072 3.783 <0.001 Male 0.523 0.896 0.372 0.522 1.064 0.290 ESRD duration 0.003 0.195 0.845 -0.001 -0.047 0.963 Peritoneal dialysis 0.269 0.449 0.654 0.615 1.176 0.243 DM etiology 2.671 5.198 <0.001 2.262 4.511 <0.001 E/E’ Age 0.143 3.009 0.003 0.120 2.392 0.019 Male -2.393 -1.829 0.071 -2.287 -1.802 0.075 ESRD duration -0.002 -0.076 0.940 0.008 0.239 0.812 Peritoneal dialysis -1.360 -1.004 0.318 -0.558 -0.401 0.689 DM etiology 2.960 1.305 0.026 2.367 1.806 0.075
ESRD, end stage renal disease; DM, diabetes mellitus; E, early diastolic mitral inflow velocity; E’, early diastolic mitral annulus velocity. 100.0% 80.0% 60.0% 40.0% 20.0% 0.0%
Fig. 1. Coronary artery disease (CAD) severity according to the etiology of end-stage renal disease (ESRD). DM ESRD patients had more signifi-cant CAD compared to the non-DM ESRD group. DM, diabetes mellitus.
Normal coronary artery Minimal CAD Significant CAD
patients had significantly higher central aortic systolic pressure, which is a robust prognosticator for CV outcomes and is supe-rior to conventional brachial BP.14 One potential explanation for this finding is more advanced arteriosclerosis in the DM ESRD group. This is further supported by our observation of faster PWV in these patients than non-DM ESRD subjects, de-spite similar clinical characteristics. In fact, the presence of DM, along with age, was an independent determinant for PWV in our cohort. Studies have shown that hyperglycemia and hyper-insulinemia accelerate arteriosclerosis through increased ac-cumulation of advanced glycation end products and endothe-lial dysfunction.15,16 In a study by Tomiyama, et al.,15 increased BP and increased plasma glucose levels synergistically acceler-ated the progression of arterial stiffness in 2080 Japanese men. In the current investigation, we observed that the presence of DM independently correlated with more advanced arterial stiffness even in ESRD patients. This is clinically important be-cause aortic stiffness is a strong independent predictor of CV mortality in subjects with end stage renal disease.17
In echocardiography examinations, however, the association between DM and E/E’ showed marginal significance in multi-variate analysis, and DM patients seemed to have higher E/E’, which represents increased LV filling pressure.8 This result sug-gests that: 1) DM ESRD patients might be prone to pulmonary congestion and/or heart failure symptoms during cardiac vol-ume/pressure overload despite normal LV EF; and thus, 2) more aggressive LV unloading by renal replacement therapy and/or anti-heart failure medications should be considered in the setting of ESRD and DM.
Unexpectedly, E’ and LA volumes did not differ between the DM and non-DM ESRD groups. E’ reflects early diastolic LV longitudinal relaxation, which is more vulnerable and is an ear-lier manifestation of cardiac dysfunction than LV radial motion, which is commonly expressed by LV EF in various diseases af-fecting the heart.18 It is well known that DM patients have bl-unted LV long-axis performances at rest19 and during exercise.20 As previously reported, diastolic dysfunction is more advanced in patients with DM19-21 and ESRD;22 however, our data failed to show any difference in LV relaxation properties between the two groups. In addition, LAVI, reflecting chronicity and severity of diastolic function, was not different between the two groups. Those results are plausibly explained by: 1) the longer duration of ESRD in the non-DM group, 2) characteristic chronic volume
overload status which overwhelms slight difference of myocar-dial dysfunction in ESRD patients, and 3) E’ might be too rough to be used as a parameter to detect subtle differences in LV me-chanics between the two groups. Thus, further studies are war-ranted using a more well-balanced and larger study sample and newer echocardiographic technologies, such as strain analysis, for better evaluation of myocardial function.
Although the overall prevalence of CAD (i.e., subclinical CAD) was modest (23.1%) in analyzable patients based on CCTA, the prevalence was apparently higher in the DM group (45%) than non-DM group (9.4%). Our data support the notion that DM may have a more negative impact on CV system even in ESRD patients, even though ESRD itself is a powerful risk fac-tor for CV diseases and should be regarded as a ‘CAD equiva-lent’ condition. In DM ESRD patients, it is known that vascular calcification, chronic inflammation, and insulin resistance are kidney related CV risk factors.23 However, the current study showed no difference of CACS and C-reactive protein levels between the groups. This observation suggests that different pathophysiologic mechanisms such as insulin resistance might have roles in generation and progression of CAD between ESRD patients with and without DM. ESRD has a strong rela-tionship with the development of CV diseases, including ath-erosclerosis, due to the effects of uremia, volume/pressure overload of the heart and vessels, oxidative stress, and altered metabolism.24,25 The clinical implication of our investigation is that when DM, which induces oxidative stress and inflamma-tion,21 is superimposed on ESRD, it affects the CV system in these patients.26 Therefore, we carefully suggest a thorough di-agnostic work-up for the detection and characterization of each patient’s CV disease profile even in subclinical stages.
This study has some limitations. First, our small cohort limits the power of statistical analyses. Second, this is a single center study and included patients referred to a tertiary center. Thus, the current study group might not represent the entire popula-tion of patients with ESRD. Third, because of its cross-secpopula-tional design, we do not have CV outcome data in this cohort, and only observational data analyses were possible. In addition, baseline clinical characteristics were not matched between the DM and non-DM groups, although the differences were not statistically significant. Further investigations with larger ESRD population and long-term clinical outcome are needed to ex-plore whether the comprehensive CV screening protocol could Table 5. Binary Logistic Regression Analyses for Determinants of Significant Coronary Artery Disease
Variable Univariate model Multivariate model
OR (95% CI) p value OR (95% CI) p value
Age 1.087 (1.016–1.187) 0.032 1.129 (1.015–1.312) 0.052
Male sex 10 (1.711–191.144) 0.035 1.734 (1.900–473.898) 0.031
ESRD duration 0.916 (0.803–0.999) 0.12 0.916 (0742–1.014) 0.320
Peritoneal dialysis 1.115 (0.260–4.248) 0.876 1.493 (0.157–14.696) 0.721
DM etiology 7.5 (1.883–38.445) 0.007 6.651 (1.137–51.673) 0.046
help prevent future CV event in DM ESRD patients.
ACKNOWLEDGEMENTS
This research was supported by a grant of the Korea Health Tech-nology R&D Project through the Korea Health Industry Develop-ment Institute (KHIDI), funded by the Ministry of Health & Wel-fare, Republic of Korea (grant number: HI13C0715) and by the Gachon University Gil Medical Center (grant number: 2013-46).
REFERENCES
1. Go AS, Chertow GM, Fan D, McCulloch CE, Hsu CY. Chronic kid-ney disease and the risks of death, cardiovascular events, and hospitalization. N Engl J Med 2004;351:1296-305.
2. Herzog CA, Ma JZ, Collins AJ. Poor long-term survival after acute myocardial infarction among patients on long-term dialysis. N Engl J Med 1998;339:799-805.
3. Ritz E, Rychlík I, Locatelli F, Halimi S. End-stage renal failure in type 2 diabetes: a medical catastrophe of worldwide dimensions. Am J Kidney Dis 1999;34:795-808.
4. Weber T, Auer J, O’Rourke MF, Kvas E, Lassnig E, Berent R, et al. Arterial stiffness, wave reflections, and the risk of coronary artery disease. Circulation 2004;109:184-9.
5. Weber T, O’Rourke MF, Ammer M, Kvas E, Punzengruber C, Eber B. Arterial stiffness and arterial wave reflections are associated with systolic and diastolic function in patients with normal ejection frac-tion. Am J Hypertens 2008;21:1194-202.
6. Rajzer MW, Wojciechowska W, Klocek M, Palka I, Brzozowska-Kiszka M, Kawecka-Jaszcz K. Comparison of aortic pulse wave ve-locity measured by three techniques: Complior, SphygmoCor and Arteriograph. J Hypertens 2008;26:2001-7.
7. Lang RM, Bierig M, Devereux RB, Flachskampf FA, Foster E, Pellik-ka PA, et al. Recommendations for chamber quantification: a re-port from the American Society of Echocardiography’s Guidelines and Standards Committee and the Chamber Quantification Writ-ing Group, developed in conjunction with the European Associa-tion of Echocardiography, a branch of the European Society of Car-diology. J Am Soc Echocardiogr 2005;18:1440-63.
8. Nagueh SF, Appleton CP, Gillebert TC, Marino PN, Oh JK, Smiseth OA, et al. Recommendations for the evaluation of left ventricular diastolic function by echocardiography. J Am Soc Echocardiogr 2009;22:107-33.
9. Hendel RC, Patel MR, Kramer CM, Poon M, Hendel RC, Carr JC, et al. ACCF/ACR/SCCT/SCMR/ASNC/NASCI/SCAI/SIR 2006 appro-priateness criteria for cardiac computed tomography and cardiac magnetic resonance imaging: a report of the American College of Cardiology Foundation Quality Strategic Directions Committee Appropriateness Criteria Working Group, American College of Ra-diology, Society of Cardiovascular Computed Tomography, Society for Cardiovascular Magnetic Resonance, American Society of Nu-clear Cardiology, North American Society for Cardiac Imaging, So-ciety for Cardiovascular Angiography and Interventions, and Soci-ety of Interventional Radiology. J Am Coll Cardiol 2006;48:1475-97. 10. American College of Cardiology Foundation Task Force on Expert
Consensus Documents, Mark DB, Berman DS, Budoff MJ, Carr JJ, Gerber TC, et al. ACCF/ACR/AHA/NASCI/SAIP/SCAI/SCCT 2010 expert consensus document on coronary computed tomographic angiography: a report of the American College of Cardiology
Foun-dation Task Force on Expert Consensus Documents. Circulation 2010;121:2509-43.
11. Austen WG, Edwards JE, Frye RL, Gensini GG, Gott VL, Griffith LS, et al. A reporting system on patients evaluated for coronary artery disease. Report of the Ad Hoc Committee for Grading of Coronary Artery Disease, Council on Cardiovascular Surgery, American Heart Association. Circulation 1975;51(4 Suppl):5-40.
12. Agatston AS, Janowitz WR, Hildner FJ, Zusmer NR, Viamonte M Jr, Detrano R. Quantification of coronary artery calcium using ul-trafast computed tomography. J Am Coll Cardiol 1990;15:827-32. 13. Nakazato R, Dey D, Gutstein A, Le Meunier L, Cheng VY, Pimentel
R, et al. Coronary artery calcium scoring using a reduced tube volt-age and radiation dose protocol with dual-source computed to-mography. J Cardiovasc Comput Tomogr 2009;3:394-400.
14. Williams B, Lacy PS, Thom SM, Cruickshank K, Stanton A, Collier D, et al. Differential impact of blood pressure-lowering drugs on central aortic pressure and clinical outcomes: principal results of the Conduit Artery Function Evaluation (CAFE) study. Circulation 2006;113:1213-25.
15. Tomiyama H, Hashimoto H, Hirayama Y, Yambe M, Yamada J, Koji Y, et al. Synergistic acceleration of arterial stiffening in the presence of raised blood pressure and raised plasma glucose. Hypertension 2006;47:180-8.
16. Zieman SJ, Melenovsky V, Kass DA. Mechanisms, pathophysiolo-gy, and therapy of arterial stiffness. Arterioscler Thromb Vasc Biol 2005;25:932-43.
17. Blacher J, Guerin AP, Pannier B, Marchais SJ, Safar ME, London GM. Impact of aortic stiffness on survival in end-stage renal dis-ease. Circulation 1999;99:2434-9.
18. Urbano-Moral JA, Rowin EJ, Maron MS, Crean A, Pandian NG. Investigation of global and regional myocardial mechanics with 3-dimensional speckle tracking echocardiography and relations to hypertrophy and fibrosis in hypertrophic cardiomyopathy. Circ Cardiovasc Imaging 2014;7:11-9.
19. Poirier P, Bogaty P, Garneau C, Marois L, Dumesnil JG. Diastolic dysfunction in normotensive men with well-controlled type 2 dia-betes: importance of maneuvers in echocardiographic screening for preclinical diabetic cardiomyopathy. Diabetes Care 2001;24:5-10. 20. Kim SA, Shim CY, Kim JM, Lee HJ, Choi DH, Choi EY, et al. Impact
of left ventricular longitudinal diastolic functional reserve on clini-cal outcome in patients with type 2 diabetes mellitus. Heart 2011; 97:1233-8.
21. Fang ZY, Prins JB, Marwick TH. Diabetic cardiomyopathy: evi-dence, mechanisms, and therapeutic implications. Endocr Rev 2004;25:543-67.
22. Hayashi SY, Brodin LA, Alvestrand A, Lind B, Stenvinkel P, Mazza do Nascimento M, et al. Improvement of cardiac function after haemodialysis. Quantitative evaluation by colour tissue velocity imaging. Nephrol Dial Transplant 2004;19:1497-506.
23. Wang AY. Cardiovascular risk in diabetic end-stage renal disease patients. J Diabetes 2011;3:119-31.
24. Meeus F, Kourilsky O, Guerin AP, Gaudry C, Marchais SJ, London GM. Pathophysiology of cardiovascular disease in hemodialysis patients. Kidney Int Suppl 2000;76:S140-7.
25. Zoungas S, Ristevski S, Lightfoot P, Liang YL, Branley P, Shiel LM, et al. Carotid artery intima-medial thickness is increased in chronic renal failure. Clin Exp Pharmacol Physiol 2000;27:639-41.
26. Ishii H, Toriyama T, Aoyama T, Takahashi H, Amano T, Hayashi M, et al. Prognostic values of C-reactive protein levels on clinical out-come after implantation of sirolimus-eluting stents in patients on hemodialysis. Circ Cardiovasc Interv 2009;2:513-8.