An Integrative Model of the Cardiovascular System Coupling
Heart Cellular Mechanics with Arterial Network Hemodynamics
The current study proposes a model of the cardiovascular system that couples heart cell mechanics with arterial hemodynamics to examine the physiological role of arterial blood pressure (BP) in left ventricular hypertrophy (LVH). We developed a comprehensive multiphysics and multiscale cardiovascular model of the cardiovascular system that simulates physiological events, from membrane excitation and the contraction of a cardiac cell to heart mechanics and arterial blood hemodynamics. Using this model, we delineated the relationship between arterial BP or pulse wave velocity and LVH. Computed results were compared with existing clinical and experimental observations. To investigate the relationship between arterial hemodynamics and LVH, we performed a parametric study based on arterial wall stiffness, which was obtained in the model. Peak cellular stress of the left ventricle and systolic blood pressure (SBP) in the brachial and central arteries also increased; however, further increases were limited for higher arterial stiffness values. Interestingly, when we doubled the value of arterial stiffness from the baseline value, the percentage increase of SBP in the central artery was about 6.7% whereas that of the brachial artery was about 3.4%. It is suggested that SBP in the central artery is more critical for predicting LVH as compared with other blood pressure measurements.
Key Words: Computer Simulation; Blood Pressure; Hypertrophy, Left Ventricular; Integrative Cell-System-Arterial Network Model
Young-Tae Kim,1* Jeong Sang Lee,2* Chan-Hyun Youn,3 Jae-Sung Choi,2 and Eun Bo Shim1
1Department of Mechanical and Biomedical
Engineering, Kangwon National University,
Chuncheon; 2Department of Thoracic and
Cardiovascular Surgery, Seoul National University College of Medicine and SMG-SNU Boramae
Hospital, Seoul; 3Department of Information and
Communications Engineering, Korea Advanced Institute of Science and Technology, Daejeon, Korea *Young-Tae Kim and Jeong Sang Lee contributed equally to this study.
Received: 29 June 2012 Accepted: 15 May 2013 Address for Correspondence: Eun Bo Shim, PhD
Department of Mechanical and Biomedical Engineering, Kangwon National University, 1 Kangwondaehak-gil, Chuncheon 200-701, Korea
Tel: +82.33-250-6318, Fax: +82.33-257-6595 E-mail: [email protected]
This work was supported by the IT R&D program of MOTIE/KEIT (10044910, Development of Multi-modality Imaging and 3D Simulation-Based Integrative Diagnosis-Treatment Support Software System for Cardiovascular Diseases).
http://dx.doi.org/10.3346/jkms.2013.28.8.1161 • J Korean Med Sci 2013; 28: 1161-1168
Cardiovascular Disorders
INTRODUCTION
There have been a number of recent studies examining the re-lationship between arterial wall stiffening and cardiac cellular overload (1, 2). However, despite substantial progress in under-standing this issue, the detailed mechanisms underlying this relationship remain unclear. Therefore, a novel approach is re-quired to delineate the causal relationship between arterial stiffness and heart hypertrophy. The use of computer simula-tions with mathematical models is an alternative method and has been widely used for the analysis of cardiovascular system dynamics (3-6).
Lumped models of the cardiovascular system are very simple and can be easily coupled with the nervous system for long-term simulation (7). However, the model cannot accurately predict microscopic phenomena in cells or tissues. To over-come this limitation, we proposed a cell-system integrated model of the cardiovascular system that included cardiac cells,
the Laplace heart, and the vascular system (8-10). However, the cell-system model uses relatively a simple lumped model for the arterial system and lacks detailed information regarding ar-terial pressures and pulse wave velocity (PWV). On the other hand, mathematical models focusing on arterial hemodynam-ics have been proposed by several groups (11-13). These mod-els have the ability to represent the spatial distribution of arteri-al hemodynamics and PWV. However, the time-varying capaci-tance heart model (14) was incorporated into these models by which the relationship between heart cellular mechanics and arterial hemodynamics could not be analyzed.
In this study, the arterial network model of Ozawa et al. (11) was incorporated into our previous cell-system model (8) to delineate the physiological relationship between arterial sure and left ventricular hypertrophy (LVH). To verify the pres-ent method, we calculated the effects of arterial stiffness, arteri-al hemodynamics, and pulse wave velocity on cardiac cellular mechanics, and compared the results with experimental and
clinical observations. Using this methodology, the physiologi-cal effects of arterial stiffness variation on LVH were assessed in an integrated manner.
MATERIALS AND METHODS
To simulate heart mechanics and arterial pulse waves at a mul-tiscale level, we developed an integrative mathematical model that combined cell excitation-contraction coupling with heart mechanics, system circulation, and hemodynamics of the arte-rial network. In our previous studies (8, 10), we combined the ventricular cell model with the Negroni and Lascano model (NL model) (15) and eventually with system circulation. Here, we used the same approach for the atrial and ventricular models,
but with the addition of arterial network branches (Fig. 1). As described in our previous report (10), the present compu-tational approach to cardiac cells is based on the electrophysio-logical models of human atrial and ventricular myocytes pro-posed by Nygren et al. (16) and ten Tusscher et al. (17) (TNNP model), respectively. In addition, these cellular electrophysio-logical models were combined with the NL model of cross-bridge dynamics (CBD) for contraction (18). Cross-cross-bridge dy-namics in the NL model are described by a four-state system
consisting of free troponin (T), Ca2+-bound troponin (TCa),
Ca2+-bound troponin with attached cross-bridges (TCa*), and
troponin with attached cross-bridges (T*). The total force (F) of a single muscle unit is given by the following relationship:
F = Fb + Fp (a)
where Fb is the equivalent cross-bridge force generated by the
contribution of all cross-bridges attached in parallel within the
muscle unit and Fp is the force developed by the elastic element
of the muscle unit. The cross-bridge force generated in (a) is presented as follows, according to the NL paper (15):
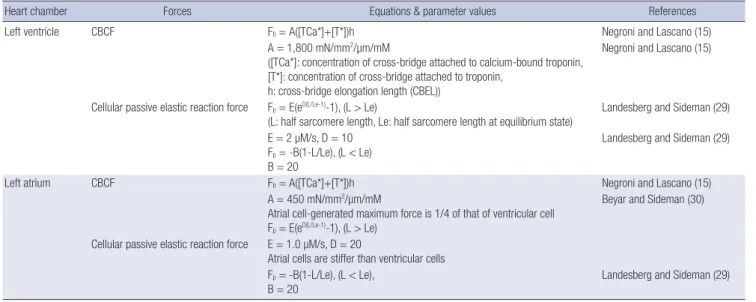
Fb= A · ([TCa*]+[T*]) · h (b)
where A is the model parameter and h is the cross-bridge elon-gation length. The related parameters in the NL models are presented in Table 1.
The forces obtained from the cell-NL models were converted into atrial and ventricular pressures by applying Laplace’s law to the atrial and ventricular models. In our previous report, we referred to this type of heart model as a biological Laplace heart (BLH) (9). The NL, as well as the spherical atrial and ventricle models, were explained in detail in our previous reports (8, 9). We used a lumped parameter model to simulate a cardiovas-cular system. With the exception of the heart and arterial com-partments, the hemodynamic elements were the same as those described by Heldt et al. (19). The entire model is shown in Fig.
Multi-scale Heart Mechanics Model
Arterial system Venous system Lumped parameter vascular system model
Hemodynamics Momentum &
Continuity equation 28 compartment
vascular tree
Calcium buffer Cross-bridge dynamics (CBD) model Left Atrium BLH Left Ventricle BLH Electro-physiological cell
models Calcium transient
Cell tension Half sarcomere length
preload Afterload
Ventricular pressure
Fig. 1. Schematic of the integrative cell-system simulation model designed for effec-tive multiscale numerical analysis from cellular to tissue mechanics. BLH, biological Laplace heart.
Table 1. Equations and parameter values for the cross-bridge dynamics model
Heart chamber Forces Equations & parameter values References
Left ventricle CBCF Fb= A([TCa*]+[T*])h Negroni and Lascano (15)
A = 1,800 mN/mm2/µm/mM
([TCa*]: concentration of cross-bridge attached to calcium-bound troponin, [T*]: concentration of cross-bridge attached to troponin,
h: cross-bridge elongation length (CBEL))
Negroni and Lascano (15)
Cellular passive elastic reaction force Fp= E(eD(L/Le-1)-1), (L > Le)
(L: half sarcomere length, Le: half sarcomere length at equilibrium state) Landesberg and Sideman (29) E = 2 µM/s, D = 10
Fp= -B(1-L/Le), (L < Le)
B = 20
Landesberg and Sideman (29)
Left atrium CBCF Fb= A([TCa*]+[T*])h Negroni and Lascano (15)
A = 450 mN/mm2/µm/mM
Atrial cell-generated maximum force is 1/4 of that of ventricular cell Fp= E(eD(L/Le-1)-1), (L > Le)
Beyar and Sideman (30) Cellular passive elastic reaction force E = 1.0 µM/s, D = 20
Atrial cells are stiffer than ventricular cells Fp= -B(1-L/Le), (L < Le),
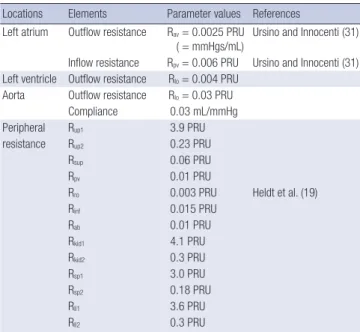
2. The peripheral circulation is divided into the upper body, re-nal, splanchnic, and lower extremity sections; the intrathoracic superior, inferior vena cava, and extrathoracic vena cava are identified separately. The model thus consists of compart-ments, each of which is represented by a linear resistance (R) and compliance (C) that can be either linear, nonlinear, or time-varying. The NL model and Laplace’s law were applied to calcu-late heart mechanics. All of the recalcu-lated parameters in the sys-temic circulation model are presented in Table 2.
The arterial network model proposed by Ozawa et al. (11) was incorporated into the current cell-system model system as shown in Fig. 2. Model of Ozawa et al. was based on the numer-ical solution of one-dimensional equations for fluid and vessel
wall motion in a geometrically accurate branching network of the arterial system (28 elements), including energy losses at bi-furcations. Blood flow and pulse wave propagation in each ele-ment were described by one-dimensional Navier-Stokes equa-tions with axial velocity, fluid pressure, and vessel cross-sec-tional area as variables (14). These equations were solved using the finite difference method on one-dimensional meshes for each element of the arterial network branches (14). Rebound of arterial waves from terminal or bifurcation branches were nu-merically implemented through boundary conditions. As simi-lar to Ozawa et al. (11), we used the method of charateristics for the boundary conditions. Detailed specifications of the four large arteries in the arterial network are shown in Table 3. The
Venous circulation model Upper body Superior vena cava Rup2 Pup Rup1 Ppv Ppa Rpa Rro
Rkid2 Pkid Rkid1
Rsp2 RII2 PII RII1 CII Rsp1 Psp Csp Ckid Rinf Pinf Pab Cinf Cab Rab Pth Prv Pla Rla Plv Rlv Pth Crv(t) Pth Pth Pth Psup Rsup Csup Cpa Rpv Cpv Cup Pulmonary circulation BLH models Left heart Right ventricle Renal part Inferior vena cava Abdominal vena cava Splanchnic part Legs Wall tension: T Radius: r Atrial (Pla) or ventricular (Plv) pressures
Arterial circulation model
Fig. 2. Schematic of the integrative vascular system model. up, upper body; sup, superior vena cava; pa, pulmonary artery; pv, pulmonary vein; ro, right ventricular outflow; la, left atrium; lv, left ventricle; inf, inferior vena cava; ab, abdominal vena cava; kid, kidney; sp, splanchnic; ll, lower limbs; th, thoracic; rv, right ventricle.
total length of the four arteries was 37.9 cm, and the length of the thoracic aorta was about half (48.8%) of the total length, with a mean diameter of 2 cm. In the normal case, wall stiffness values for the arterial elements were identical to those de-scribed in the Model of Ozawa et al. (11). To couple the arterial network model with BLH, we regarded the left ventricular (LV) pressure as the boundary condition of the arterial network model and the aortic flow rate as the input condition of the BLH model.
To investigate the effects of arterial wall stiffening on heart cellular mechanics and cardiovascular system dynamics, we performed a parametric study with respect to arterial wall stiff-ness, increasing arterial wall elasticity of the model by 1, 2, 3, and 4 times the normal value. However, this variation in arterial elasticity was assumed only in large arteries because the wall stiffness of small arteries remains nearly unchanged (21). Here, PWV was calculated from the distance and traveling time of the pressure wave between the ascending aorta (1st element of the arterial network in Fig. 2) and the abdominal aorta (4th ele-ment of the arterial network in Fig. 2).
RESULTS
To assess the feasibility of our cell-system-arterial network model, we plotted the sequential events from the cell level to that of the arterial pulse (Fig. 3) and reconstructed the shapes of
the original action potential and Ca2+ transient. The action
po-tential showed the characteristic spike notch dome shape of ventricular cells (Fig. 3A). Fig. 3B shows the transient increase in free calcium concentration within the cytoplasm. The force
of muscle contraction develops rapidly in response to the Ca2+
transient in cells (Fig. 3C). Two components comprise this force: that generated by cross-bridges and elastic force. The LV
active force showed a peak value of approximately 28 mN/mm2
(kPa). Fig. 3D shows the volume variation in the left atrium (LA) and LV relative to time. The ejection fraction of the left ventricle was nearly 0.58. The LA contracts prior to ventricular contrac-tion. The timeline of the pressure changes observed in the aor-ta, atrium, and ventricle are shown in Fig. 3E. Here, the heart rate was assumed to be 72 bpm (beats/min). Pressure pulse waves at three arterial positions (ascending aorta, common ili-ac artery, and anterior tibial artery) are plotted in Fig. 3F and show increased pulse pressures and a smoothed dicrotic notch in the distal portion of the arterial branches.
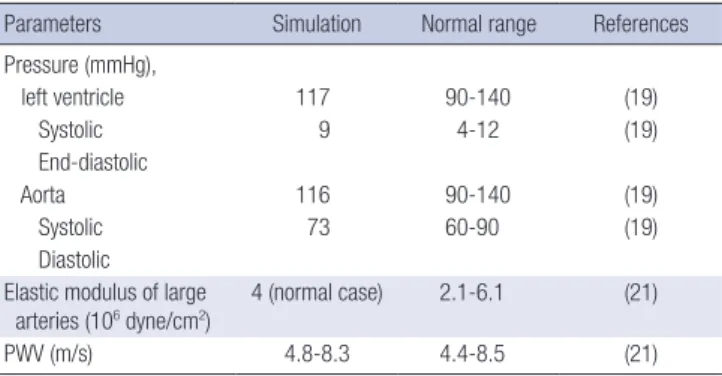
To verify our model, the major hemodynamic variables gen-erated by the model are compared with standard values in Table 4. The computed blood pressure is within the range considered to be physiologically normal within the general population. The
Concentra tion (µM) Volta ge (mV) Force (mN/mm 2) Volume (mL) Pressure (mmHg) Pressure (mmHg) Time (sec) Ascending aorta Common iliac artery Anterior tibial artery 0.0 0.4 0.8 1.2 1.6 40 0 -40 -80 1.2 0.8 0.4 0.0 30 20 10 0 120 90 60 30 120 80 40 0 125 100 75 50 A B C D E F
Fig. 3. Numerical simulation results of sequential events of the integrative cell-sys-tem-arterial network model. Dotted lines, atrial events; solid lines, ventricular events. (A) Action potential. (B) Ca2+ concentration. (C) Cellular forces (solid line: active force
generated by cross-bridges, thick dotted line: passive elastic force at the ventricular myocyte). (D) Cardiac volume. (E) Blood pressure in the left atrium and left ventricle, respectively (thick dotted line: aorta pressure). (F) Pressure pulse waves at three arte-rial positions (ascending aorta, common iliac artery, and anterior tibial artery). Table 2. Lumped parameter values for the cardiovascular system model
Locations Elements Parameter values References Left atrium Outflow resistance Rav= 0.0025 PRU
( = mmHgs/mL)
Ursino and Innocenti (31) Inflow resistance Rpv= 0.006 PRU Ursino and Innocenti (31)
Left ventricle Outflow resistance Rlo= 0.004 PRU
Aorta Outflow resistance Rlo= 0.03 PRU
Compliance 0.03 mL/mmHg Peripheral Rup1 3.9 PRU
resistance Rup2 0.23 PRU
Rsup 0.06 PRU
Rpv 0.01 PRU
Rro 0.003 PRU Heldt et al. (19)
Rinf 0.015 PRU Rab 0.01 PRU Rkid1 4.1 PRU Rkid2 0.3 PRU Rsp1 3.0 PRU Rsp2 0.18 PRU Rll1 3.6 PRU Rll2 0.3 PRU
PRU, peripheral resistance unit (mmHg s/mL); up, upper body; sup, superior vena cava; pv, pulmonary vein; ro, right ventricular outflow; inf, inferior vena cava; ab, ab-dominal vena cava; kid, kidney; sp, splanchnic; ll, lower limbs.
Table 3. Material properties and dimensions of the four large arteries Element
number Artery name Length (cm) Proximal area (cm2) Distal area (cm2) Elastic modulus (106 dyne/cm)
1 Ascending aorta 5.5 6.605 3.941 4.0
2 Thoracic aorta 18.5 3.597 2.835 4.0
3 Abdominal aorta 4.3 2.378 2.378 4.0
stroke volume was approximately 73 mL. The cardiac output, which was obtained by multiplying the stroke volume with a heart rate of 72 bpm, was 5,256 mL/min. The computed value of the PWV in the aorta was within the range 4.4 to 8.5 m/sec, which is consistent with an experimental study in humans (22). Fig. 4 shows the variation in pressure waves within the aorta according to arterial stiffness. Compared with the baseline
val-ue of arterial elasticity (En= 4 × 10⁶ dyne/cm2), with increases
in arterial stiffness, the time delay of the pressure wave between the ascending and abdominal aortas decreased, whereas the difference in peak aortic pressures increased. As shown in Fig. 4A and B, increase of arterial stiffness by 2 times of normal val-ue increased peak aortic pressure by nearly 8% (from 112.5 mmHg to 121.5 mmHg). However, the increased value is rela-tively small compared with in vivo experimental observation (23). Interestingly, in revers to the present cases, acute rise in blood pressure can increase in vivo arterial stiffness demon-strated by Stewart et al. (24). The relation between arterial stiff-ness and cardiac output is shown in Table 5.
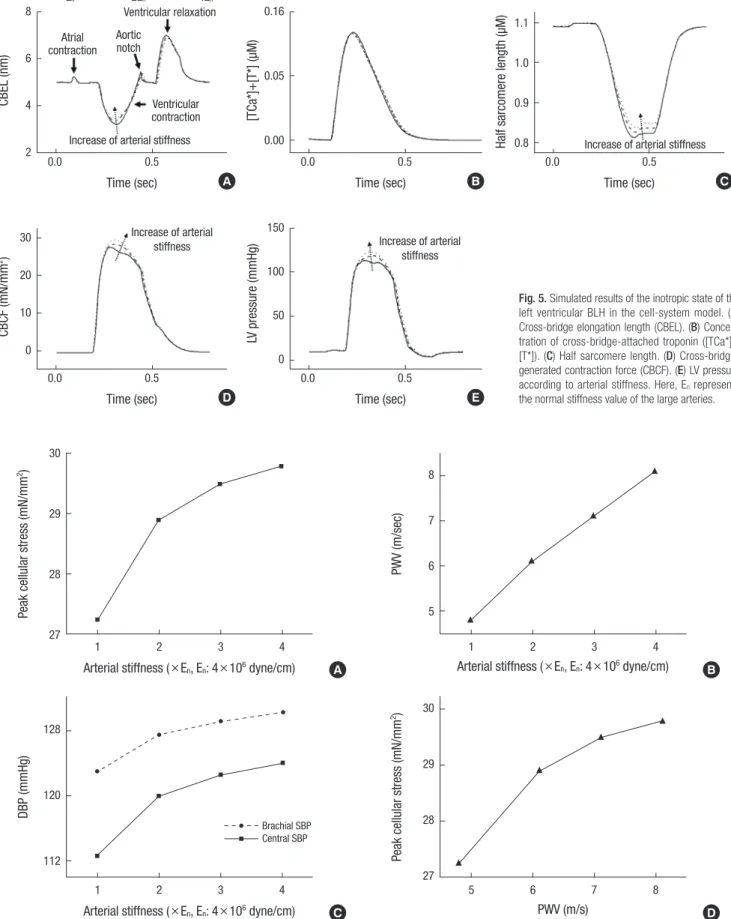
At the cellular level, the cross-bridge elongation (CBEL) de-creased sharply during contraction below the steady-state value ( = 5 nm) and then immediately reverted to the back to the steady-state value (Fig. 5A). Shortening of the CBEL below the steady-state value during contraction played a critical role in active force generation, as the calcium-bound troponin
con-centration was high during this period (Fig. 5B). This shorten-ing of the elongation durshorten-ing contraction was accompanied by a decrease in the half sarcomere length (HSL) (Fig. 5C). The ac-tive force was generated by the product of the CBEL and the concentration of calcium-bound troponin (Fig. 5D).
There was no change in the amount of troponin bound to the cross-bridge with increasing arterial thickness (solid, thick, and thin dotted lines in Fig. 5B), whereas CBEL increased (Fig. 5A). Accordingly, the HSL and LV peak pressure (Fig. 5E) increased with arterial stiffness. According to increased stiffness, it is re-markable that the changes of CBEL and half sarcomere length during ventricular relaxation were relatively small compared with those during ventricular contraction.
The peak cellular stress observed with increases in arterial stiffness is shown in Fig. 6A. As shown in the Fig. 6, there was an initial steep increase in the peak cellular stress followed by a saturated pattern at higher arterial stiffness values. On the other hand, the variation in PWV was nearly linear with increasing arterial stiffness (Fig. 6B). Systolic blood pressures (SBP) in the ascending aorta and brachial artery also changed consistent with peak cellular stress (Fig. 6C). Interestingly, variation in aor-tic SBP was more prominent than that in the brachial arterial with respect to increasing arterial stiffness. Fig. 6D presents the relationship between PWV and peak cellular stress, showing a saturated pattern for higher values of PWV.
DISCUSSION
A major objective of the present study was to integrate cellular processes with systemic and arterial hemodynamics by which propagation of the arterial pulse wave is related to heart
me-Pressure (mmHg) Pressure (mmHg) Pressure (mmHg)
Time (sec) Time (sec) Time (sec)
td: delay time En 2En 4En 0.0 0.2 0.4 0.6 0.8 0.0 0.2 0.4 0.6 0.8 0.0 0.2 0.4 0.6 0.8 130 120 110 100 90 80 70 60 130 120 110 100 90 80 70 60 130 120 110 100 90 80 70 60 50 Abdominal aorta Ascending aorta Abdominal aorta Ascending aorta Abdominal aorta Ascending aorta A B C
Fig. 4. Simulated results of propagation delay of arterial pressure waves between the ascending aorta and the abdominal aorta with respect to differences in arterial stiffness. (A) En, (B) 2En, (C) 4En. Here, En represents the normal stiffness of the large arteries.
Table 4. Comparison between computational and normal parameter ranges Parameters Simulation Normal range References Pressure (mmHg), left ventricle 117 90-140 (19) Systolic 9 4-12 (19) End-diastolic Aorta 116 90-140 (19) Systolic 73 60-90 (19) Diastolic
Elastic modulus of large
arteries (106 dyne/cm2) 4 (normal case) 2.1-6.1 (21)
PWV (m/s) 4.8-8.3 4.4-8.5 (21)
PWV, pulse wave velocity.
Table 5. Variations of cardiac output and pulse wave velocity according to the in-crease of arterial stiffness
Elastic modulus
(106 dyne/cm) volume (mL)Stroke (beats/min)Heart rate Cardiac output(mL/min) Pulse wave velocity (m/s)
4.0 77.6 72 5,587 4.8
8.0 75.9 72 5,465 6.2
CBEL (nm)
CBCF (mN/mm
2)
[TCa*]+[T*] (µM)
LV pressure (mmHg)
Half sarcomere length (µM)
Time (sec) Time (sec) Time (sec) Time (sec) Time (sec) En 2En 4En 0.0 0.5 0.0 0.5 0.0 0.5 0.0 0.5 0.0 0.5 8 6 4 2 30 20 10 0 0.16 0.05 0.00 150 100 50 0 1.1 1.0 0.9 0.8 Ventricular relaxation
Increase of arterial stiffness
Increase of arterial
stiffness Increase of arterial
stiffness
Increase of arterial stiffness Atrial contraction Aortic notch Ventricular contraction A D B E C
Fig. 5. Simulated results of the inotropic state of the left ventricular BLH in the cell-system model. (A) Cross-bridge elongation length (CBEL). (B) Concen-tration of cross-bridge-attached troponin ([TCa*]+ [T*]). (C) Half sarcomere length. (D) Cross-bridge-generated contraction force (CBCF). (E) LV pressure according to arterial stiffness. Here, En represents
the normal stiffness value of the large arteries.
A B
Peak cellular stress (mN/mm
2)
PWV (m/sec)
Arterial stiffness (×En, En: 4×10⁶ dyne/cm) Arterial stiffness (×En, En: 4×10⁶ dyne/cm)
1 2 3 4 1 2 3 4 30 29 28 27 8 7 6 5 C D DBP (mmHg)
Peak cellular stress (mN/mm
2)
Arterial stiffness (×En, En: 4×10⁶ dyne/cm) PWV (m/s)
1 2 3 4 5 6 7 8 128 120 112 30 29 28 27 Brachial SBP Central SBP
Fig. 6. Simulation results of the (A) peak cellular stress of the ventricle, (B) pulse wave velocity (PWV) change, (C) brachial and central systolic blood pressures (SBP) with re-spect to arterial stiffness, and (D) peak cellular stress with rere-spect to PWV.
chanics in the human circulatory system. Here, the arterial net-work model proposed by Ozawa et al. (11) could couple blood hemodynamics and pulse waves in detailed arteries with LV mechanics and systemic circulation. Our discussion of the computational results focuses on three main aspects: the plau-sibility of the integrative method of a cell-system-arterial net-work to simulate heart mechanics and cardiovascular hemody-namics, a parametric study focusing on arterial stiffness to de-lineate the relationship between arterial hemodynamics and cardiac cellular mechanics.
In the cell-system-arterial network model, electrophysiologi-cal variables such as the action potential, electrophysiologi-calcium concentra-tion, and generated cellular forces in the cellular models were determined for atrial and ventricular cells (Fig. 3A-C). Compu-tational results for the cardiovascular system dynamics were consistent with published results of pressure and volume varia-tions in the LA and LV (Fig. 3D, E). Arterial pulse wave propaga-tion along the arterial network also showed a pattern similar to previous clinical observations (Fig. 3F, 4). In conclusion, all se-quential events from the cell to arterial pulse waves were well reproduced and consistent with the existing data, demonstrat-ing the plausibility of the present method as an integrative analysis tool for evaluating heart mechanics and arterial hemo-dynamics.
Atherosclerosis is a symptom of aging that causes serious health problems. Specifically, it increases cardiac cellular stress, which eventually stimulates heart hypertrophy (23, 24). Roman et al. (25) investigated the effects of central blood pressure (BP) on left ventricular hypertrophy (LVH), and showed that systolic BP in the central artery (or the ascending aorta) is more impor-tant in stimulating LVH and inducing conformational changes and remodeling of the heart. With respect to medical terminol-ogy, central BP represents the BP in the large arteries, such as the ascending, descending, and abdominal aortas. Wang et al. (26) also reported that central systolic pressure is more critical than other blood pressures in predicting cardiovascular diseas-es. However, theoretical approaches to explain the detailed physiological mechanism underlying these effects have not been reported. Therefore, we proposed an integrative cell-sys-tem-arterial network model to delineate the relationships be-tween heart cellular stress, LVH, and arterial stiffness.
Using this model, we performed a parametric study to evalu-ate the effects of stiffened arteries on heart cellular mechanics by increasing the vascular wall stiffness of the largest arteries in the model. Cross-bridge-generated contraction force (CBCF) (Fig. 5D), LV peak pressure (Fig. 5E), and PWV (Fig. 6B) in-creased, whereas HSL decreased with increasing arterial stiff-ness. Peak cellular stress and SBP in the brachial and central teries also increased, but were saturated at higher values of ar-terial stiffness (Fig. 6A). As shown in Fig. 6C, central arar-terial stiffness could more affect SBP, which is because the half of
ejected blood is stored in the vessel and three quarters of the blood is stored in aorta. Therefore, if the central artery becomes stiff, the SBP could be more affected. Interestingly, changes in the peak cellular stress and SBP showed similar patterns (Fig. 6A and C). In particular, SBP variation in the central artery (or ascending aorta) with respect to arterial stiffness was more prominent than that in the brachial artery) (Fig. 6C). As increas-es in exerted cellular strincreas-ess indicate increased stimulation of LVH, this result clearly corresponds to the clinical observation that SBP in the central artery is more critical than other blood pressure measurements in predicting LVH. The peak cellular stress corresponding to a specific PWV can be inferred quanti-tatively from the graph shown in Fig. 6D. Clinically, cellular stress is not easy to observe in patients (27), while PWV can be measured easily. Therefore, this result provides another exam-ple of the utility of the present cell-system-arterial network model.
This study developed a cell-system-arterial network coupled model of the cardiovascular system. Although results were rea-sonable, the study has several limitations. First, we did not con-sider other effects, such as autonomic nerve control or changes in the resistance of the peripheral vessels involved in the arteri-al stiffening process. Therefore, we elucidated only the mecha-nisms involved in arterial stiffness perturbation, cellular con-tractility, and vascular hemodynamics. Second, the heart has a complex muscle layer with fiber anisotropy and heterogeneous muscle thickness. In addition, different parts of the ventricles are activated at different times. However, in this study, the ven-tricle was assumed to be a Laplace heart to reduce the com-plexity of the coupled cell-circulation hemodynamics method. Besides, in this study we didn’t consider long-term compensa-tory mechanism of blood pressure through renal excrecompensa-tory sys-tem. Nevertheless, these limitations were not expected to mark-edly alter the main findings of this study.
Despite its limitations, our model can simulate the sequen-tial events of the cardiovascular system from cells to the sys-temic circulation. Consequently, the model can be applied to perioperative intensive care in heart, lung and liver surgery which requires accurate evaluation of the pulmonary preload and systemic afterload. Along with clinical data, a computer model of the cardiovascular system can be a useful tool allow-ing clinicians to estimate critical information about patients’ cardiovascular system, such as blood pressure, and the arterial pulse wave. In addition, clinicians can use the model to predict the cardiovascular changes induced in patients by treatment in intensive care units. For example, Kashif et al. (28) showed that a simulation method combined with clinical measurements can provide information about patients in intensive care. We expect that our model could play a similar role in estimating patient-specific data for grave patients. In the future, this will be delineated by combining the model with clinical data.
DISCLOSURE
The authors have no conflicts of interest to disclose. REFERENCES
1. Abhayaratna WP, Barnes ME, O’Rourke MF, Gersh BJ, Seward JB, Miya-saka Y, Bailey KR, Tsang TS. Relation of arterial stiffness to left
ventricu-lar diastolic function and cardiovascuventricu-lar risk prediction in patients > or =65 years of age. Am J Cardiol 2006; 98: 1387-92.
2. Urbina EM, Dolan LM, McCoy CE, Khoury PR, Daniels SR, Kimball TR.
Relationship between elevated arterial stiffness and increased left ven-tricular mass in adolescents and young adults. J Pediatr 2011; 158: 715-21.
3. Kerckhoffs RC, Neal ML, Gu Q, Bassingthwaighte JB, Omens JH, Mc-Culloch AD. Coupling of a 3D finite element model of cardiac
ventricu-lar mechanics to lumped systems models of the systemic and pulmonic circulation. Ann Biomed Eng 2007; 35: 1-18.
4. Lim KM, Lee JS, Song JH, Youn CH, Choi JS, Shim EB. Theoretical
esti-mation of cannulation methods for left ventricular assist device support as a bridge to recovery. J Korean Med Sci 2011; 26: 1591-8.
5. Trayanova NA, Rice JJ. Cardiac electromechanical models: from cell to
organ. Front Physiol 2011; 2: 43.
6. Campbell SG, McCulloch AD. Multi-scale computational models of
fa-milial hypertrophic cardiomyopathy: genotype to phenotype. J R Soc In-terface 2011; 8: 1550-61.
7. Shim EB, Sah JY, Youn CH. Mathematical modeling of cardiovascular
system dynamics using a lumped parameter method. Jpn J Physiol 2004; 54: 545-53.
8. Shim EB, Leem CH, Abe Y, Noma A. A new multi-scale simulation
model of the circulation: from cells to system. Philos Trans A Math Phys Eng Sci 2006; 364: 1483-500.
9. Shim EB, Amano A, Takahata T, Shimayoshi T, Noma A. The
cross-bridge dynamics during ventricular contraction predicted by coupling the cardiac cell model with a circulation model. J Physiol Sci 2007; 57: 275-85.
10. Shim EB, Jun HM, Leem CH, Matusuoka S, Noma A. A new integrated
method for analyzing heart mechanics using a cell-hemodynamics-au-tonomic nerve control coupled model of the cardiovascular system. Prog Biophys Mol Biol 2008; 96: 44-59.
11. Ozawa ET, Bottom KE, Xiao X, Kamm RD. Numerical simulation of
en-hanced external counterpulsation. Ann Biomed Eng 2001; 29: 284-97.
12. Stettler JC, Niederer P, Anliker M. Theoretical analysis of arterial
hemo-dynamics including the influence of bifurcations: part I: mathematical models and prediction of normal pulse patterns. Ann Biomed Eng 1981; 9: 145-64.
13. Avolio AP. Multi-branched model of the human arterial system. Med
Biol Eng Comput 1980; 18: 709-18.
14. Dell’Italia LJ, Walsh RA. Application of a time varying elastance model
to right ventricular performance in man. Cardiovasc Res 1988; 22: 864-74.
15. Negroni JA, Lascano EC. A cardiac muscle model relating sarcomere
dy-namics to calcium kinetics. J Mol Cell Cardiol 1996; 28: 915-29.
16. Nygren A, Fiset C, Firek L, Clark JW, Lindblad DS, Clark RB, Giles WR.
Mathematical model of an adult human atrial cell: the role of K+ cur-rents in repolarization. Circ Res 1998; 82: 63-81.
17. ten Tusscher KH, Noble D, Noble PJ, Panfilov AV. A model for human
ventricular tissue. Am J Physiol Heart Circ Physiol 2004; 286: H1573-89.
18. Matsuoka S, Sarai N, Kuratomi S, Ono K, Noma A. Role of individual
ionic current systems in ventricular cells hypothesized by a model study. Jpn J Physiol 2003; 53: 105-23.
19. Heldt T, Shim EB, Kamm RD, Mark RG. Computational modeling of
cardiovascular response to orthostatic stress. J Appl Physiol 2002; 92: 1239-54.
20. Avolio AP. Multi-branched model of the human arterial system. Med
Biol Eng Comput 1980; 18: 709-18.
21. Izzo JL Jr, Shykoff BE. Arterial stiffness: clinical relevance, measurement,
and treatment. Rev Cardiovasc Med 2001; 2: 29-34.
22. Gozna ER, Marble AE, Shaw AJ, Winter DA. Mechanical properties of
the ascending thoracic aorta of man. Cardiovasc Res1973; 7: 261-5.
23. Lehmann ED, Parker JR, Hopkins KD, Taylor MG, Gosling RG.
Valida-tion and reproducibility of pressure-corrected aortic distensibility mea-surements using pulse-wave-velocity Doppler ultrasound. J Biomed Eng 1993; 15: 221-8.
24. Stewart AD, Millasseau SC, Kearney MT, Ritter JM, Chowienczyk PJ.
Ef-fects of inhibition of basal nitric oxide synthesis on carotid-femoral pulse wave velocity and augmentation index in humans. Hypertension 2003; 42: 915-8.
25. Roman MJ, Devereux RB, Kizer JR, Okin PM, Lee ET, Wang W, Umans JG, Calhoun D, Howard BV. High central pulse pressure is independently
associated with adverse cardiovascular outcome the strong heart study. J Am Coll Cardiol 2009; 54: 1730-4.
26. Wang KL, Cheng HM, Chuang SY, Spurgeon HA, Ting CT, Lakatta EG, Yin FC, Chou P, Chen CH. Central or peripheral systolic or pulse
pres-sure: which best relates to target organs and future mortality? J Hyper-tens 2009; 27: 461-7.
27. Rochette L, Tatou E, Maupoil V, Zeller M, Cottin Y, Jazayeri S, Brenot R, Girard C, David M, Vergely C. Atrial and vascular oxidative stress in
pa-tients with heart failure. Cell Physiol Biochem 2011; 27: 497-502.
28. Kashif FM, Verghese GC, Novak V, Czosnyka M, Heldt T. Model-based
noninvasive estimation of intracranial pressure from cerebral blood flow velocity and arterial pressure. Sci Transl Med 2012; 4: 129ra44.
29. Landesberg A, Sideman S. Mechanical regulation of cardiac muscle by
coupling calcium kinetics with cross-bridge cycling: a dynamic model. Am J Physiol 1994; 267: H779-95.
30. Beyar R, Sideman S. Atrioventricular interactions: a theoretical
simula-tion study. Am J Physiol 1987; 252: H653-65.
31. Ursino M, Innocenti M. Modeling arterial hypotension during