Open Access
The Effect of Hospital Case Volume on Clinical Outcomes in Patients
with Nasopharyngeal Carcinoma: A Multi-institutional Retrospective
Analysis (KROG-1106)
Original Article
Purpose
The purpose of this study was to investigate the effect of hospital case volume on clinical outcomes in patients with nasopharyngeal carcinoma (NPC).
Materials and Methods
Data on 1,073 patients with cT1-4N0-3M0 NPC were collected from a multi-institutional ret-rospective database (KROG 11-06). All patients received definitive radiotherapy (RT) either with three-dimensional-conformal RT (3D-CRT) (n=576) or intensity-modulated RT (IMRT) (n=497). The patients were divided into two groups treated at high volume institution (HVI) (n=750) and low volume institution (LVI) (n=323), defined as patient volume 10 (median, 13; range, 10 to 18) and < 10 patients per year (median, 3; range, 2 to 6), respectively. End-points were overall survival (OS) and loco-regional progression-free survival (LRPFS).
Results
At a median follow-up of 56.7 months, the outcomes were significantly better in those treated at HVI than at LVI. For the 614 patients of propensity score-matched cohort, 5-year OS and LRPFS were consistently higher in the HVI group than in the LVI group (OS: 78.4% vs. 62.7%, p < 0.001; LRPFS: 86.2% vs. 65.8%, p < 0.001, respectively). According to RT modality, significant difference in 5-year OS was observed in patients receiving 3D-CRT (78.7% for HVI vs. 58.9% for LVI, p < 0.001) and not in those receiving IMRT (77.3% for HVI vs. 75.5% for LVI, p=0.170).
Conclusion
A significant relationship was observed between HVI and LVI for the clinical outcomes of patients with NPC. However, the difference in outcome becomes insignificant in the IMRT era, probably due to the standardization of practice by education.
Key words
Nasopharyngeal neoplasms, Hospital, Low- or high-volume, Treatment outcome, Three-dimensional conformal radiotherapy, Intensity-modulated radiotherapy
Boram Ha,
MD1Kwan Ho Cho,
MD1Sung Ho Moon,
MD1Chang-Geol Lee,
MD2Ki Chang Keum,
MD2Yeon-Sil Kim,
MD3Hong-Gyun Wu,
MD4Jin Ho Kim,
MD4Yong Chan Ahn,
MD5Dongryul Oh,
MD5Jae Myoung Noh,
MD5Jong Hoon Lee,
MD6Sung Hwan Kim,
MD6Won Taek Kim,
MD7Young-Taek Oh,
MD8Min Kyu Kang,
MD9Jin Hee Kim,
MD10Ji-Yoon Kim,
MD11Moon-June Cho,
MD12Chul Seoung Kay,
MD13Jin Hwa Choi,
MD14+ + + + + + + + + + + + + + + + + + + + + + + + + + + + + + + + + + + + + + + + + + + + + + + + + + + + + + + + + + + + + + + + + + + + + + + + + + + + + + + + + + + + + + + + + + + + + + + + + + + + + + + + + + + + + + + + + + + + + + + + + + + + + + + + + + + + + + + + + + + + + + + + + + + + + + + + + + + + + + + + + + + + + + + + + + + + + + + + + + + + + + + + + + + + + + + + + + + + + + + + + + + + + + + + + + + + + + + + + + + + + + + + + + + + + + + + + + + + + + + + + + + + + + + + + + + + + + + + + + + + + + + + + + + + + + + + + + + + + + + + + + + + + + + + + + + + + + + + + + + + + + + + + + + + + + + + + + + + + + + + + + + + + + + + + + + + + + + + + + + +
Correspondence: Kwan Ho Cho, MD
Proton Therapy Center, National Cancer Center, 323 Ilsan-ro, Ilsandong-gu, Goyang 10408, Korea Tel: 82-31-920-1720
Fax: 82-31-920-0149 E-mail: [email protected] Received June 6, 2017 Accepted February 4, 2018 Published Online February 5, 2018 *Presented as an oral presentation at the 2016 Annual Meeting of the Korean Society for Radiation Oncology, October 14, 2016, Seoul, Korea.
*A list author’s aliations appears at the end of the paper.
Introduction
Surgeon expertise has a great impact on the treatment out-come of cancer surgery, and on surgical morbidity [1-3]; the expertise of the radiation oncologist presumably has the same impact on outcome and morbidity in radiotherapy (RT), but this has not been well documented. To practice “state of the art” RT, a radiation oncologist should have knowledge of the natural history of the disease, proper incorporation of multimodal images, and cross-sectional anatomy; they should also be able to precisely delineate tar-get volume, develop an optimal treatment plan with an adequate dose to the target volume, avoid critical organs, and accurately deliver the daily treatment. RT with insuffi-cient target coverage and an excessive dose to critical organs can result in lower loco-regional control, a higher incidence of late toxicity, and poorer survival outcome. Therefore, sub-stantial knowledge and experience are required to provide high quality RT. Differences in the knowledge and experi-ence among providers can make a differexperi-ence in the outcome of RT [4-6] in patients with head and neck cancer, particu-larly in the era of three-dimensional-conformal RT (3D-CRT) or intensity-modulated RT (IMRT). However, there is sub-stantial heterogeneity in target volume delineation and clin-ical practice among radiation oncologists [5], depending on their experience and knowledge. Therefore, we postulated that the experience of a radiation oncologist, as indexed by hospital case volume (HCV), might have an impact on treat-ment outcome in patients with nasopharyngeal cancer (NPC).
NPC arises from anatomically challenging region, but is highly radio-curable disease, which makes RT with or with-out chemotherapy the mainstay of treatment [7]. Thus, NPC might be a good candidate disease to evaluate the impact of radiation oncologists’ experience on treatment outcome. We retrospectively investigated the effect of HCV on overall sur-vival (OS) and loco-regional progression-free sursur-vival (LRPFS) in patients with NPC enrolled in a retrospective multi-center trial (Korean Radiation Oncology Group [KROG] 11-06).
Materials and Methods
1. Data source and study populationWe collected the data of patients with cT1-4N0-3M0 NPC from a NPC study database (KROG 11-06). KROG 11-06 was a retrospective multi-center trial which included 14
institu-tions that reviewed the NPC pattern of care and treatment outcomes in patients with primary NPC treated from Sep-tember 1988 to October 2011 [8]. The inclusion criteria were histologically confirmed NPC, cT1-4N0-3M0 disease accord-ing to the seventh editions of Union for International Cancer Control/American Joint Committee on Cancer (UICC/AJCC) staging classification. At the time of data collection, patients who had no baseline clinical information or had never com-pleted RT were excluded from data collection. All patients on the data base were included for this analysis. Computa-tional tomography was routinely done in all institutions for staging assessment. Magnetic resonance image (MRI) or positron emission tomography (PET) was also used for stag-ing in some institutions.
After excluding patients treated with two-dimensional (2D) RT, 1,073 patients were analyzed. All patients received definitive RT either with 3D-CRT (n=576) or IMRT (n=497). The mean (±standard deviation [SD]) total 3D-CRT dose was 67.99±2.64 Gy in 38.0±2.8 fractions with a median fraction size of 1.80 Gy (range, 1.50 to 2.40 Gy). The mean±SD total dose for IMRT was 69.49±3.18 Gy in 31.8±3.4 fractions with a median fraction size of 2.25 Gy (range, 1.8 to 3.0 Gy), reflecting use of the concomitant boost technique.
2. Primary endpoint and covariates
To investigate associations between treatment outcome and institutional volume, the institutions were divided into high volume institutions (HVI) and low volume institutions (LVI) (S1 Table). The number of patients treated per year was calculated by dividing the total number of patients by the total period over which the patients were treated at each institution and it ranged from 2 to 18. HVI was defined as patient volume 10 patients per year (median, 13; range, 10 to 18) and LVI as patient volume < 10 patients per year (median, 3; range, 2 to 6). Ten patients per year was chosen as cut-point because there was the largest gap between the two consecutive values of 10 and 6. A total of 750 patients were treated at 4 HVIs and 323 were treated at 10 LVIs.
The endpoints of this study were OS and LRPFS, which were defined as the time from the start of RT to the time of death from any cause (OS), and persistence or recurrence in the nasopharynx or neck (LRPFS). Patients who had lost to follow-up were censored at the time of their last follow-up. The variables analyzed were age, Eastern Cooperative Oncology Group (ECOG) performance status (PS), World Health Organization (WHO) histologic type, TN category, stage grouping, the utilization of MRI or PET for staging, concurrent chemo-radiotherapy (CCRT; yes or no), RT modality (3D or IMRT), and institutional case volume (HVI or LVI).
3. Statistical analysis
Baseline characteristics of the patients treated at HVI and LVI were compared with the t test for continuous variables and the chi-square test for categorical variables. The Kaplan-Meier method was used to assess event-time distributions and the log-rank test was used to compare the event-time distributions between the two groups. In both the univariate and multivariate analyses, a p < 0.05 was considered
signif-icant. A Cox proportional hazard model was used with step-wise backward linear regression, where only variables whose p-values were > 0.10 were removed and used in multivariate analyses. Since there was significant imbalance in patient characteristics between HVI and LVI, propensity score matching analysis was done to reduce bias due to confound-ing variables. The propensity score was estimated usconfound-ing a logistic regression model including variables of age, ECOG PS, WHO histologic classification, TN category, stage group,
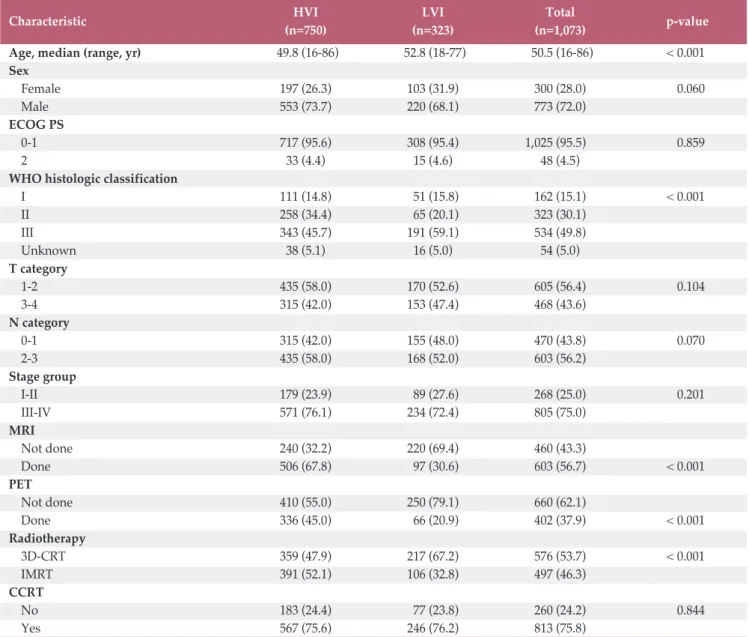
Table 1. Patient characteristics before propensity score matching
Characteristic HVI LVI Total p-value
(n=750) (n=323) (n=1,073)
Age, median (range, yr) 49.8 (16-86) 52.8 (18-77) 50.5 (16-86) < 0.001 Sex Female 197 (26.3) 103 (31.9) 300 (28.0) 0.060 Male 553 (73.7) 220 (68.1) 773 (72.0) ECOG PS 0-1 717 (95.6) 308 (95.4) 1,025 (95.5) 0.859 2 33 (4.4) 15 (4.6) 48 (4.5)
WHO histologic classification
I 111 (14.8) 51 (15.8) 162 (15.1) < 0.001 II 258 (34.4) 65 (20.1) 323 (30.1) III 343 (45.7) 191 (59.1) 534 (49.8) Unknown 38 (5.1) 16 (5.0) 54 (5.0) T category 1-2 435 (58.0) 170 (52.6) 605 (56.4) 0.104 3-4 315 (42.0) 153 (47.4) 468 (43.6) N category 0-1 315 (42.0) 155 (48.0) 470 (43.8) 0.070 2-3 435 (58.0) 168 (52.0) 603 (56.2) Stage group I-II 179 (23.9) 89 (27.6) 268 (25.0) 0.201 III-IV 571 (76.1) 234 (72.4) 805 (75.0) MRI Not done 240 (32.2) 220 (69.4) 460 (43.3) Done 506 (67.8) 97 (30.6) 603 (56.7) < 0.001 PET Not done 410 (55.0) 250 (79.1) 660 (62.1) Done 336 (45.0) 66 (20.9) 402 (37.9) < 0.001 Radiotherapy 3D-CRT 359 (47.9) 217 (67.2) 576 (53.7) < 0.001 IMRT 391 (52.1) 106 (32.8) 497 (46.3) CCRT No 183 (24.4) 77 (23.8) 260 (24.2) 0.844 Yes 567 (75.6) 246 (76.2) 813 (75.8)
Values are presented as number (%). HVI, high volume institutions; LVI, low volume institutions; ECOG PS, Eastern Coop-erative Oncology Group performance status; WHO, World Health Organization; MRI, magnetic resonance image; PET, positron emission tomography; 3D-CRT, three-dimensional-conformal radiotherapy; IMRT, intensity-modulated radiother-apy; CCRT, concurrent chemo-radiotherapy.
750 323 627 229 457 153 295 88 87 27 178 51 No. at risk HVI LVI OS 1.0 0 0.4 0.2 0.6 0.8 0 Time (yr)
Entire cohort Entire cohort
1 2 3 4 5 6 7 8 9 10 HVI LVI p < 0.001 78.1% 62.5%
A
750 323 593 197 424 140 280 77 78 23 167 45 No. at risk HVI LVI LR PF S 1.0 0 0.4 0.2 0.6 0.8 0 Time (yr) 1 2 3 4 5 6 7 8 9 10 HVI LVI p < 0.001 81.8% 66.0%B
307 307 256 218 195 146 138 83 46 23 86 46 No. at risk HVI LVI OS 1.0 0 0.4 0.2 0.6 0.8 0 Time (yr)Propensity score-matched cohort Propensity score-matched cohort
1 2 3 4 5 6 7 8 9 10 HVI LVI p < 0.001 78.4% 62.7%
C
307 307 227 169 174 126 128 76 43 21 81 44 No. at risk HVI LVI LR PF S 1.0 0 0.4 0.2 0.6 0.8 0 Time (yr) 1 2 3 4 5 6 7 8 9 10 HVI LVI p < 0.001 86.2% 65.8%D
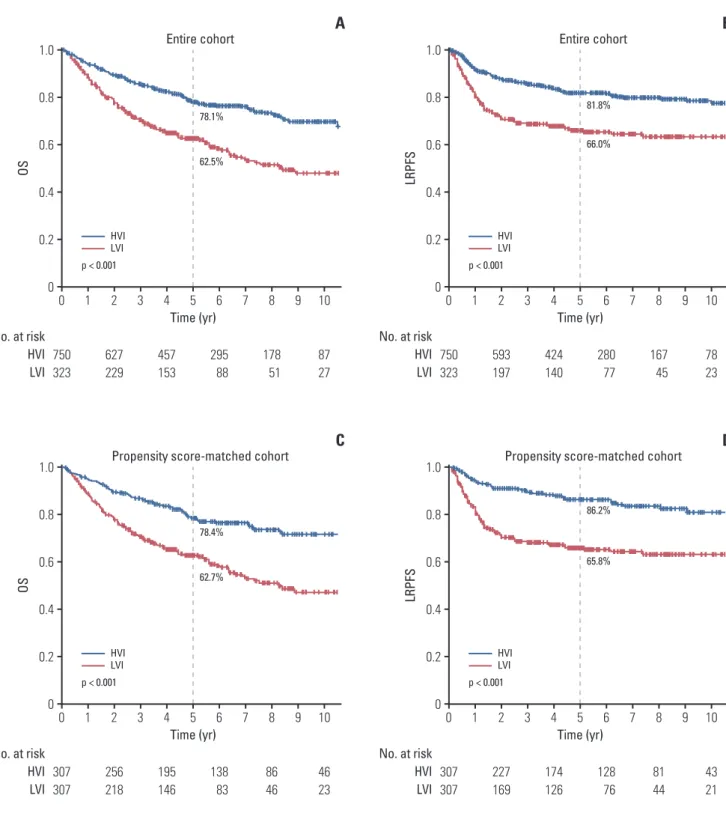
Fig. 1. Kaplan-Meier survival curves of overall survival (OS) (A) and loco-regional progression-free survival (LRPFS) (B)
for both groups in entire cohort and propensity score-matched cohort. The OS (C) and LRPFS (D) were significantly higher in high volume institutions (HVI) than in low volume institutions (LVI) for the cohort before and after propensity score matching.
RT modality (3D or IMRT) and concurrent chemotherapy (yes or no).
4. Ethical statement
KROG 11-06 was approved by the institutional review boards of each participating hospital and performed in accor-dance with the principles of the Declaration of Helsinki. The informed consent was waived.
Results
1. Patient characteristics and survival of the cohort before propensity score matching
The patient and treatment characteristics stratified by HVI and LVI are summarized in Table 1. The median follow-up time was 56.7 months (range, 0 to 244 months). Median age
Characteristic No. of OS LRPFS
patients HR 95% CI p-value HR 95% CI p-value
Age (yr) < 50 492 1.00 - < 0.001 1.00 - 0.123 50 581 1.88 1.47-2.40 1.24 0.94-1.64 ECOG PS 0-1 1,025 1.00 - 0.001 1.00 - 0.044 2 48 2.16 1.46-3.21 1.73 1.02-2.93
WHO histologic classification
I 162 1.00 - < 0.001 1.00 - 0.002 II 323 0.57 0.41-0.79 0.54 0.37-0.79 III 534 0.81 0.47-1.40 0.52 0.37-0.74 Unknown 54 - - 0.82 0.45-1.52 T category 1-2 605 1.00 - < 0.001 1.00 - < 0.001 3-4 468 1.72 1.29-2.30 1.78 1.35-2.34 N category 0-1 470 1.00 - 0.015 1.00 - 0.304 2-3 603 1.46 1.08-1.97 1.21 0.84-1.75 Stage group I-II 268 1.00 - 0.060 1.00 - 0.658 III-IV 805 1.61 0.98-2.63 1.13 0.66-1.95 MRI Not done 460 1.00 - 0.267 1.00 - 0.840 Done 603 1.17 0.89-1.55 1.04 0.74-1.45 PET Not done 660 1.00 - 0.111 1.00 - 0.307 Done 402 0.79 0.59-1.06 0.84 0.60-1.18 Radiotherapy 3D-CRT 576 1.00 - 0.218 1.00 - 0.959 IMRT 497 0.85 0.66-1.10 0.99 0.74-1.33 HCV HVI 750 1.00 - < 0.001 1.00 - < 0.001 LVI 323 2.03 1.60-2.57 2.14 1.63-2.80
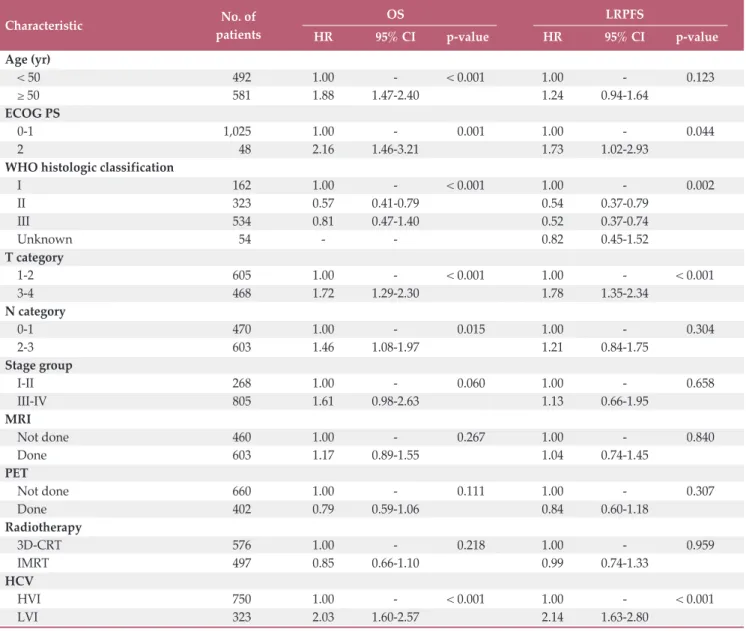
Table 2. Multivariate analysis of the prognostic variables for predicting OS and LRPFS
OS, overall survival; LRPFS, loco-regional progression-free survival; HR, hazard ratio; CI, confidence interval; ECOG PS, Eastern Cooperative Oncology Group performance status; WHO, World Health Organization; MRI, magnetic resonance image; PET, positron emission tomography; 3D-CRT, three-dimensional-conformal radiotherapy; IMRT, intensity-modulated radiotherapy; HCV, hospital case volume; HVI, high volume institutions; LVI, low volume institutions.
was older in patients treated at HVI versus LVI. A lower pro-portion of patients treated at HVI had WHO histologic grade III tumors (45.7% vs. 59.1%, p < 0.001). MRI and PET were more frequently used for staging in patients treated at HVI than at LVI (MRI, 67.8% vs. 30.6%, p < 0.001; PET, 45.0% vs. 20.9%, p < 0.001, respectively). HVI were more likely to treat patients with IMRT than 3D-CRT (52.1% vs. 32.8%, p < 0.001). A total of 304 patients died. Fig. 1 shows the Kaplan-Meier survival curves for both groups. The OS was signifi-cantly higher in HVI than LVI for the cohort before propensity score matching (5-year, 78.1% vs. 62.5%; 10-year, 69.7% vs. 47.9%; p < 0.001). HVI was associated with higher OS compared with LVI in the multivariate Cox regression model (hazard ratio [HR], 0.48; 95% confidence interval [CI], 0.38 to 0.61; p < 0.001) (Table 2). Other variables significantly associated with OS were age, PS, WHO histologic
classifica-tion, and TN category.
HVI was associated with significantly longer LRPFS com-pared to that of LVI (5-year, 81.8% vs. 66.0%; 10-year, 77.5% vs. 63.3%; p < 0.001) (Fig. 1). This survival benefit at HVI was also seen in the multivariate analysis (HR, 0.45; 95% CI, 0.34 to 0.59; p < 0.001) (Table 2).
2. Patient characteristics and survival of the cohort after propensity score matching
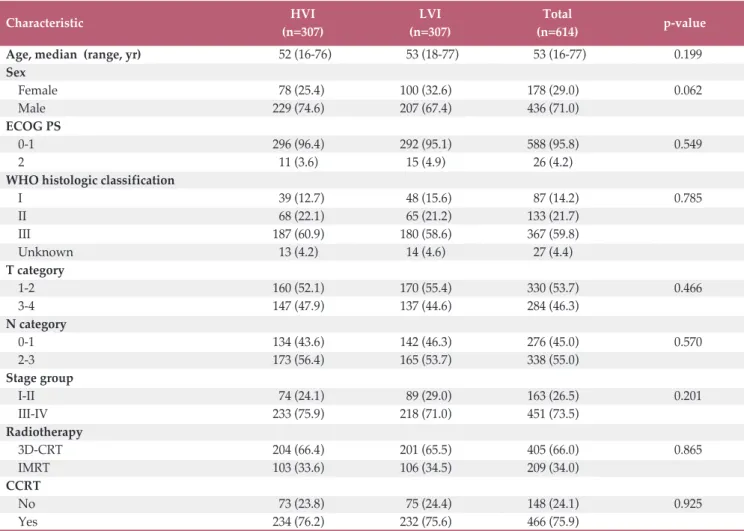
A propensity score matching analysis was performed to reduce bias due to confounding variables. Of the patients treated at LVI, 307 were matched with 307 patients treated at HVI. Table 3 shows the patients characteristics for the propensity score-matched cohort. Variables including age, WHO histologic classification, and RT modality (3D-CRT vs.
Table 3. Patient characteristics after propensity score matching
Characteristic HVI LVI Total p-value
(n=307) (n=307) (n=614)
Age, median (range, yr) 52 (16-76) 53 (18-77) 53 (16-77) 0.199
Sex Female 78 (25.4) 100 (32.6) 178 (29.0) 0.062 Male 229 (74.6) 207 (67.4) 436 (71.0) ECOG PS 0-1 296 (96.4) 292 (95.1) 588 (95.8) 0.549 2 11 (3.6) 15 (4.9) 26 (4.2)
WHO histologic classification
I 39 (12.7) 48 (15.6) 87 (14.2) 0.785 II 68 (22.1) 65 (21.2) 133 (21.7) III 187 (60.9) 180 (58.6) 367 (59.8) Unknown 13 (4.2) 14 (4.6) 27 (4.4) T category 1-2 160 (52.1) 170 (55.4) 330 (53.7) 0.466 3-4 147 (47.9) 137 (44.6) 284 (46.3) N category 0-1 134 (43.6) 142 (46.3) 276 (45.0) 0.570 2-3 173 (56.4) 165 (53.7) 338 (55.0) Stage group I-II 74 (24.1) 89 (29.0) 163 (26.5) 0.201 III-IV 233 (75.9) 218 (71.0) 451 (73.5) Radiotherapy 3D-CRT 204 (66.4) 201 (65.5) 405 (66.0) 0.865 IMRT 103 (33.6) 106 (34.5) 209 (34.0) CCRT No 73 (23.8) 75 (24.4) 148 (24.1) 0.925 Yes 234 (76.2) 232 (75.6) 466 (75.9)
Values are presented as number (%). HVI, high volume institutions; LVI, low volume institutions; ECOG PS, Eastern Coop-erative Oncology Group performance status; WHO, World Health Organization; 3D-CRT, three-dimensional-conformal radiotherapy; IMRT, intensity-modulated radiotherapy; CCRT, concurrent chemo-radiotherapy.
IMRT) were well-balanced between the two groups after propensity score matching.
A total of 196 patients died at a median follow-up of 55 months. As shown in the Kaplan-Meier survival curves for both groups in the propensity score-matched cohort (Fig. 1), OS was significantly higher in HVI than LVI (5-year, 78.4% vs. 62.7%; 10-year, 71.6% vs. 47.0%; p < 0.001, respectively). The multivariate Cox regression revealed that HVI was associated with higher OS than LVI, with an estimated HR of 0.43 (95% CI, 0.32 to 0.57; p < 0.001). Other variables asso-ciated with OS in multivariate analysis were age, PS, WHO histologic classification, and stage group (Table 4).
As shown in Fig. 1, LRPFS was significantly higher in HVI than in LVI (5-year, 86.2% vs. 65.8%; 10-year, 80.9% vs. 63.0%;
p < 0.001). The LRPFS difference remained significant in favor of patients treated at HVI in the multivariate analysis (HR, 0.34; 95% CI, 0.23 to 0.49; p < 0.001). Other variable associated with LRPFS was T category (Table 4).
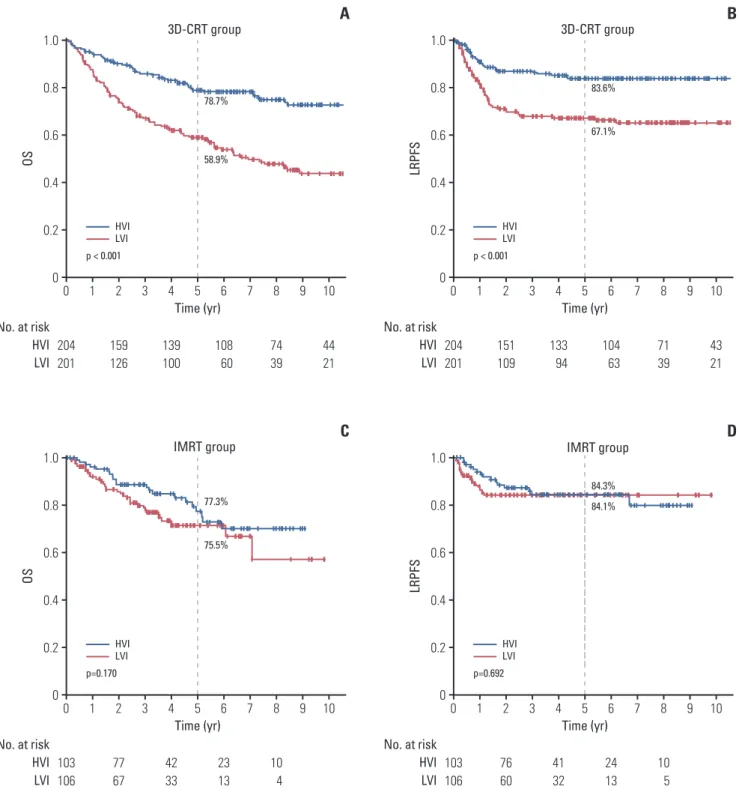
To determine the impact of RT modality, the propensity score-matched cohort was divided into 3D-CRT and IMRT groups. Significant differences in OS (5-year OS, 78.7% for HVI vs. 58.9% for LVI; p < 0.001) and LRPFS (5-year LRPFS, 83.6% for HVI vs. 67.1% for LVI; p < 0.001) were observed in the 3D-CRT group (Fig. 2). No differences in OS (5-year OS, 77.3% for HVI vs. 75.5% for LVI; p=0.170) or LRPFS (5-year LRPFS, 84.3% for HVI vs. 84.1% for LVI; p=0.692) were observed in the IMRT group (Fig. 2).
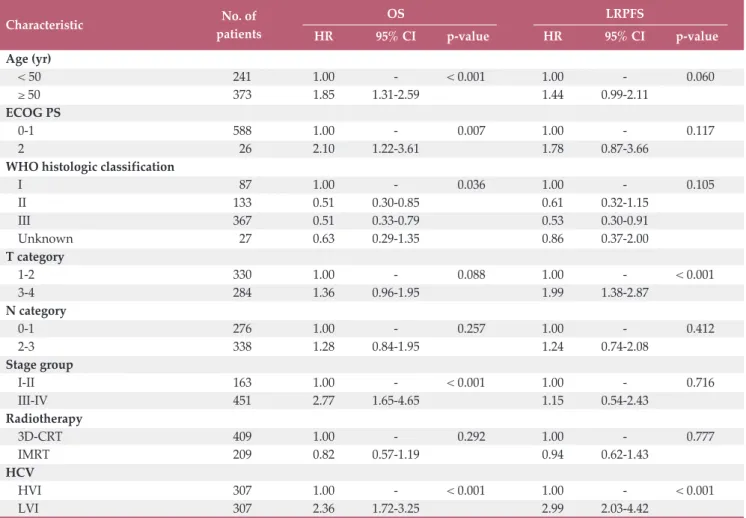
Characteristic No. of OS LRPFS
patients HR 95% CI p-value HR 95% CI p-value
Age (yr) < 50 241 1.00 - < 0.001 1.00 - 0.060 50 373 1.85 1.31-2.59 1.44 0.99-2.11 ECOG PS 0-1 588 1.00 - 0.007 1.00 - 0.117 2 26 2.10 1.22-3.61 1.78 0.87-3.66
WHO histologic classification
I 87 1.00 - 0.036 1.00 - 0.105 II 133 0.51 0.30-0.85 0.61 0.32-1.15 III 367 0.51 0.33-0.79 0.53 0.30-0.91 Unknown 27 0.63 0.29-1.35 0.86 0.37-2.00 T category 1-2 330 1.00 - 0.088 1.00 - < 0.001 3-4 284 1.36 0.96-1.95 1.99 1.38-2.87 N category 0-1 276 1.00 - 0.257 1.00 - 0.412 2-3 338 1.28 0.84-1.95 1.24 0.74-2.08 Stage group I-II 163 1.00 - < 0.001 1.00 - 0.716 III-IV 451 2.77 1.65-4.65 1.15 0.54-2.43 Radiotherapy 3D-CRT 409 1.00 - 0.292 1.00 - 0.777 IMRT 209 0.82 0.57-1.19 0.94 0.62-1.43 HCV HVI 307 1.00 - < 0.001 1.00 - < 0.001 LVI 307 2.36 1.72-3.25 2.99 2.03-4.42
Table 4. Multivariate analysis of the prognostic variables for predicting OS and LRPFS in the propensity score-matched
cohort
OS, overall survival; LRPFS, loco-regional progression-free survival; HR, hazard ratio; CI, confidence interval; ECOG PS, Eastern Cooperative Oncology Group performance status; WHO, World Health Organization; 3D-CRT, three-dimensional-conformal radiotherapy; IMRT, intensity-modulated radiotherapy; HCV, hospital case volume; HVI, high volume institu-tions; LVI, low volume institutions.
204 201 159 126 139 100 108 60 44 21 74 39 No. at risk HVI LVI OS 1.0 0 0.4 0.2 0.6 0.8 0 Time (yr) 3D-CRT group 3D-CRT group 1 2 3 4 5 6 7 8 9 10 HVI LVI p < 0.001 78.7% 58.9%
A
204 201 151 109 133 94 104 63 43 21 71 39 No. at risk HVI LVI LR PF S 1.0 0 0.4 0.2 0.6 0.8 0 Time (yr) 1 2 3 4 5 6 7 8 9 10 HVI LVI p < 0.001 83.6% 67.1%B
103 106 77 67 42 33 23 13 10 4 No. at risk HVI LVI OS 1.0 0 0.4 0.2 0.6 0.8 0 Time (yr)IMRT group IMRT group
1 2 3 4 5 6 7 8 9 10 HVI LVI p=0.170 77.3% 75.5%
C
103 106 76 60 41 32 24 13 10 5 No. at risk HVI LVI LR PF S 1.0 0 0.4 0.2 0.6 0.8 0 Time (yr) 1 2 3 4 5 6 7 8 9 10 HVI LVI p=0.692 84.3% 84.1%D
Fig. 2. Kaplan-Meier survival curves of overall survival (OS) (A, C) and loco-regional progression-free survival (LRPFS)
(B, D) for both groups in the subgroups of patients treated with three-dimensional-radiotherapy (3D-CRT) and intensity-modulated radiotherapy (IMRT) in the propensity score-matched cohort. Significant differences in OS (p < 0.001) and LRPFS (p < 0.001) were observed in the 3D-CRT group and not in the IMRT group.
3. Toxicity
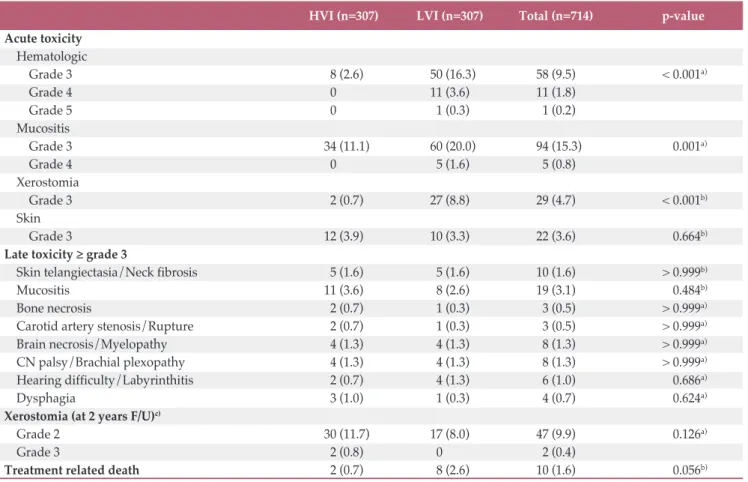
Acute grade 3 toxicities occurred less frequently in patients treated at HVI than those treated at LVI: hemato-logic toxicity (3.1% vs. 19.2%, p < 0.001), mucositis (18.4% vs. 22.0%, p=0.003), and xerostomia (0.9% vs. 9.0%, p < 0.001). Xerostomia grade 2 at 2 years after treatment was more fre-quently reported in patients treated at HVI than those treated at LVI (13.0% vs. 7.4%, p=0.046). However, this difference was not statistically significant in the propensity score-matched cohort (12.5% vs. 8.0%, p=0.126, respectively) (Table 5). Other late toxicities were reported in less than 3% of patients and the incidences were comparable between HVI and LVI. Two patients (0.3%) in HVI and eight patients (2.5%) in LVI died of treatment related toxicity.
Discussion
This study demonstrated a significant relationship between institutional volume and long-term outcomes of NPC. A higher institutional volume was associated with higher OS (HR, 2.09; 95% CI, 1.65 to 2.64; p < 0.001) and LRPFS (HR, 2.22; 95% CI, 1.69 to 2.91; p < 0.001). This differ-ence remained significant after adjusting for covariates in the multivariate and propensity score matching analyses. These findings are consistent with other studies evaluating the vol-ume effect in patients treated with definitive RT at diverse cancer sites, including high-risk prostate cancer, locally-advanced lung cancer, and NPC [9-12].
Wuthrick et al. [13] performed a secondary analysis of the RTOG 0129 stage III-IV head and neck cancer RT trial, in which all patients received definitive RT with IMRT, and reported a greater risk of death in patients treated at
histor-HVI (n=307) LVI (n=307) Total (n=714) p-value
Acute toxicity Hematologic Grade 3 8 (2.6) 50 (16.3) 58 (9.5) < 0.001a) Grade 4 0 ( 11 (3.6) 11 (1.8) Grade 5 0 ( 1 (0.3) 1 (0.2) Mucositis Grade 3 34 (11.1) 60 (20.0) 94 (15.3) 0.001a) Grade 4 0 ( 5 (1.6) 5 (0.8) Xerostomia Grade 3 2 (0.7) 27 (8.8) 29 (4.7) < 0.001b) Skin Grade 3 12 (3.9) 10 (3.3) 22 (3.6) 0.664b)
Late toxicity grade 3
Skin telangiectasia/Neck fibrosis 5 (1.6) 5 (1.6) 10 (1.6) > 0.999b)
Mucositis 11 (3.6) 8 (2.6) 19 (3.1) 0.484b)
Bone necrosis 2 (0.7) 1 (0.3) 3 (0.5) > 0.999a)
Carotid artery stenosis/Rupture 2 (0.7) 1 (0.3) 3 (0.5) > 0.999a)
Brain necrosis/Myelopathy 4 (1.3) 4 (1.3) 8 (1.3) > 0.999a)
CN palsy/Brachial plexopathy 4 (1.3) 4 (1.3) 8 (1.3) > 0.999a)
Hearing difficulty/Labyrinthitis 2 (0.7) 4 (1.3) 6 (1.0) 0.686a)
Dysphagia 3 (1.0) 1 (0.3) 4 (0.7) 0.624a)
Xerostomia (at 2 years F/U)c)
Grade 2 30 (11.7) 17 (8.0) 47 (9.9) 0.126a)
Grade 3 2 (0.8) 0 ( 2 (0.4)
Treatment related death 2 (0.7) 8 (2.6) 10 (1.6) 0.056b)
Table 5. Acute and late toxicities according to the HCV in the propensity score-matched cohort
Values are presented as number (%). HCV, hospital case volume; HVI, high volume institutions; LVI, low volume institutions; CN, cranial nerve; F/U, follow-up. a)By Fisher exact test, b)By chi square test, c)Xerostomia at 2 years F/U were assessed in a
ically low-volume accrual centers (HR, 1.91; 95% CI, 1.37 to 2.65). Boero et al. [14] published the results of a retrospective analysis of 6,212 patients with head and neck cancer using the SEER-Medicare database. They found a significant rela-tionship between provider volume and survival only for patients receiving IMRT (HR, 0.79; 95% CI, 0.67 to 0.94), but not for patients receiving conventional non-IMRT [14]. How-ever, it is difficult to compare these results with ours because the two studies included only a small proportion of NPC cases (0%-2%) and the latter study also enrolled 35% patients who underwent surgery prior to RT. Only one other study included patients with NPC; Lee et al. [12] retrospectively analyzed the Taiwan National Health Insurance Research Database data of 1,225 patents treated between 1998 and 2000. They found that patients treated by high-volume physi-cians had a 14% relative improvement in adjusted 10-year survival rate (high-volume vs. low/medium-volume physi-cians, 75% vs. 61%; p < 0.001). However, no information was given about the impact of RT modality on outcome.
Surprisingly, the analysis of the impact of RT modality on outcome showed that there was a significant relationship between institutional volume and survival only for patients receiving 3D-CRT (5-year OS, 78.7% for HVI vs. 58.9% for LVI; p < 0.001) and not for those receiving IMRT (5-year OS, 77.3% vs. 75.5%; p=0.170). In contrast, Boero et al. [14] demonstrated a significant relationship between provider volume and survival only for patients receiving IMRT and not for those receiving conventional RT, including 2D- and 3D-CRT. The reason for this discrepancy is not clear but one potential explanation might be that IMRT was first intro-duced to Korea in 2001. Around this time, many guidelines were published to help target delineation in head and neck cancers. In addition, many educational sessions were pro-vided by the Korean Society for Radiation Oncology to edu-cate society members on how to contour targets and evaluate treatment plans, which was not available for 3D-CRT. These efforts may have had a standardizing effect on practice; thus, no differences were found in outcome between HVI and LVI, as a result of substantial improvement in LVI, approaching that of HVI in the IMRT era. Notably, the 5-year OS rates improved from 58.9% with 3D-CRT to 75.5% with IMRT in the LVI, whereas they were similar at 78.7% for 3D-CRT and 77.3% for IMRT in the HVI. Thus, the standardization of practice by education might have a role for improvement of outcome in LVI.
The experience of a radiation oncologist as indexed by HCV might be one explanation for the survival advantage in patient treated at a HVI, as shown here. RT is a primary treat-ment for NPC, and a loco-regional control rate 90% can be achieved with contemporary IMRT techniques [7,15]. How-ever, NPC treatment is complex. Several confounding factors influence the survival advantage in patients treated at a HVI.
The utilization of advanced imaging studies including MRI and PET scans are helpful for accurate staging and target delineation for RT planning, which might improve treatment outcome. In this study, MRI and PET were performed twice more frequently at HVI than at LVI which might influence the better outcome at HVI. In univariate analysis, the OS and LRPFS were significantly associated with the utilization of PET (yes vs. no) (5-year OS, 78.7% vs. 70.6%; p=0.012; 5-year LRPFS, 82.0% vs. 74.5%; p=0.010, respectively), whereas they were not associated with the utilization of MRI. In multivari-ate analysis, the utilization of PET, however, became insignif-icant. Concurrent chemotherapy is also crucial for locally-advanced NPC based on its survival benefit, as shown in multiple randomized-controlled trials and meta-analyses [16,17]. Given the complexity of the treatment for NPC, a multidisciplinary approach is recommended to improve long term survival and decrease long term toxicity. A HVI is likely to involve a multi-disciplinary team with more experienced radiologists, medical oncologists, radiation oncologists, and other supporting personnel, which might result in better out-comes. Acute toxicities > grade 3 were more frequently reported in LVI and treatment related mortality was also higher in LVI, which could have attributed to lower survival outcome in LVI. However, their impact on survival outcome could not be investigated because of the retrospective nature of the study.
Some limitations of our study should be mentioned. First, the effect of non-RT factors was not fully controlled due to the inherent shortcomings of a retrospective study. Detailed information about the chemotherapy regimen, number of cycles, and use of neo-adjuvant vs. adjuvant chemotherapy were not available in all patients. Nevertheless, most patients were given CCRT (75%) and this proportion was well-bal-anced between HVI and LVI. Given the lack of the informa-tion about socioeconomic status, there was the possibility of selection, in which patients with a higher socioeconomic sta-tus and good overall health may have visited HVI and sought expert opinions, which might have influenced the outcome.
The current study also had strengths. First, we included a large cohort comprised only of patients with NPC. This homogeneity made it easier to specifically interpret the impact of HCV on NPC outcomes. Second, we used a data-base for this retrospective study (KROG 11-06), which con-tained data on all patients who met the inclusion criteria (cT1-4N0-3M0, previously untreated NPC), thus including nearly all patients treated at each institution. In contrast to a national insurance database, these data included detailed information about the clinical status and treatment of each patient.
Our results are unique because the HCV was more influ-ential for patients receiving 3D-CRT than IMRT, which
con-tradicts previous studies [13,14]. More importantly, our data suggest that the difference in outcome between HVI and LVI can be overcome potentially by the standardization of prac-tice.
A significant relationship was observed between HVI and LVI for the clinical outcomes of patients with NPC. However, the difference in outcome becomes insignificant in the IMRT era, probably due to the standardization of practice by edu-cation.
Electronic Supplementary Material
Supplementary materials are available at Cancer Research and Treatment website (https://www.e-crt.org).
Conflicts of Interest
Conflict of interest relevant to this article was not reported.
Acknowledgments
This work was supported by a National Cancer Center Grant (NCC-1610440) and the Korean Radiation Oncology Group 11-06.
Author Details
1Proton Therapy Center, Research Institute and Hospital, National Cancer Center, Goyang, 2Department of Radiation Oncology, Yonsei University College of Medicine, Seoul, 3Department of Radiation Oncology, Seoul St. Mary’s Hospital, College of Medicine, The Catholic University of Korea, Seoul, 4Department of Radiation Oncology, Seoul National University College of Medicine, Seoul, 5Department of Radiation Oncology, Samsung Medical Center, Sungkyunkwan University School of Medicine, Seoul, 6Department of Radiation Oncology, St. Vincent’s Hospital, College of Medicine, The Catholic University of Korea, Suwon, 7Department of Radiation Oncology, Pusan National University Hospital, Busan, 8Department of Radiation Oncology, Ajou University School of Medicine, Suwon, 9Department of Radiation Oncology, School of Medicine, Kyung-pook National University, Daegu, 10Department of Radiation Oncology, Dongsan Medical Center, Keimyung University School of Medicine, Daegu, 11Department of Radiation Oncology, Yeouido St. Mary’s Hospital, College of Medicine, The Catholic University of Korea, Seoul, 12Department of Radiation Oncology, Chungnam National University School of Medicine, Daejeon, 13Department of Radiation Oncology, Incheon St. Mary’s Hospital, College of Medi-cine, The Catholic University of Korea, Incheon, 14Department of Radiation Oncology, Chung-Ang University Hospital, Seoul, Korea
1. Birkmeyer JD, Siewers AE, Finlayson EV, Stukel TA, Lucas FL, Batista I, et al. Hospital volume and surgical mortality in the United States. N Engl J Med. 2002;346:1128-37.
2. Gruen RL, Pitt V, Green S, Parkhill A, Campbell D, Jolley D. The effect of provider case volume on cancer mortality: sys-tematic review and meta-analysis. CA Cancer J Clin. 2009;59: 192-211.
3. Schrag D, Panageas KS, Riedel E, Cramer LD, Guillem JG, Bach PB, et al. Hospital and surgeon procedure volume as pre-dictors of outcome following rectal cancer resection. Ann Surg. 2002;236:583-92.
4. Das IJ, Cheng CW, Chopra KL, Mitra RK, Srivastava SP, Glat-stein E. Intensity-modulated radiation therapy dose prescrip-tion, recording, and delivery: patterns of variability among institutions and treatment planning systems. J Natl Cancer Inst. 2008;100:300-7.
5. Hong TS, Tome WA, Harari PM. Heterogeneity in head and neck IMRT target design and clinical practice. Radiother Oncol. 2012;103:92-8.
6. Nelms BE, Robinson G, Markham J, Velasco K, Boyd S, Narayan S, et al. Variation in external beam treatment plan quality: an inter-institutional study of planners and planning systems. Pract Radiat Oncol. 2012;2:296-305.
7. Moon SH, Cho KH, Lee CG, Keum KC, Kim YS, Wu HG, et al. IMRT vs. 2D-radiotherapy or 3D-conformal radiotherapy of nasopharyngeal carcinoma : Survival outcome in a Korean multi-institutional retrospective study (KROG 11-06). Strah-lenther Onkol. 2016;192:377-85.
8. Sung SY, Kang MK, Kay CS, Keum KC, Kim SH, Kim YS, et al. Patterns of care for patients with nasopharyngeal carci-noma (KROG 11-06) in South Korea. Radiat Oncol J. 2015;33: 188-97.
9. Chen YW, Mahal BA, Muralidhar V, Nezolosky M, Beard CJ, Den RB, et al. Association between treatment at a high-volume facility and improved survival for radiation-treated men with high-risk prostate cancer. Int J Radiat Oncol Biol Phys. 2016;94:683-90.
10. Koshy M, Malik R, Mahmood U, Husain Z, Sher DJ. Stereo-tactic body radiotherapy and treatment at a high volume facility is associated with improved survival in patients with inoperable stage I non-small cell lung cancer. Radiother Oncol. 2015;114:148-54.
11. Wang EH, Rutter CE, Corso CD, Decker RH, Wilson LD, Kim AW, et al. Patients selected for definitive concurrent chemora-diation at high-volume facilities achieve improved survival in stage III non-small-cell lung cancer. J Thorac Oncol. 2015;10:
937-43.
12. Lee CC, Huang TT, Lee MS, Su YC, Chou P, Hsiao SH, et al. Survival rate in nasopharyngeal carcinoma improved by high caseload volume: a nationwide population-based study in Tai-wan. Radiat Oncol. 2011;6:92.
13. Wuthrick EJ, Zhang Q, Machtay M, Rosenthal DI, Nguyen-Tan PF, Fortin A, et al. Institutional clinical trial accrual vol-ume and survival of patients with head and neck cancer. J Clin Oncol. 2015;33:156-64.
14. Boero IJ, Paravati AJ, Xu B, Cohen EE, Mell LK, Le QT, et al. Importance of radiation oncologist experience among patients with head-and-neck cancer treated with intensity-modulated radiation therapy. J Clin Oncol. 2016;34:684-90.
15. Lee N, Xia P, Quivey JM, Sultanem K, Poon I, Akazawa C, et al. Intensity-modulated radiotherapy in the treatment of nasopharyngeal carcinoma: an update of the UCSF experience. Int J Radiat Oncol Biol Phys. 2002;53:12-22.
16. Al-Sarraf M, LeBlanc M, Giri PG, Fu KK, Cooper J, Vuong T, et al. Chemoradiotherapy versus radiotherapy in patients with advanced nasopharyngeal cancer: phase III randomized Inter-group study 0099. J Clin Oncol. 1998;16:1310-7.
17. Langendijk JA, Leemans CR, Buter J, Berkhof J, Slotman BJ. The additional value of chemotherapy to radiotherapy in locally advanced nasopharyngeal carcinoma: a meta-analysis of the published literature. J Clin Oncol. 2004;22:4604-12.