Copyright © 2020 by Asian-Australasian Journal of Animal Sciences
This is an open-access article distributed under the terms of the Creative Commons Attribution License
Asian-Australas J Anim Sci
Vol. 33, No. 12:2021-2030 December 2020 https://doi.org/10.5713/ajas.20.0238 pISSN 1011-2367 eISSN 1976-5517
TATA box binding protein and ribosomal protein 4 are suitable
reference genes for normalization during quantitative polymerase
chain reaction study in bovine mesenchymal stem cells
Si-Jung Jang1,a, Ryoung-Hoon Jeon1,a, Hwan-Deuk Kim2,3, Jong-Chan Hwang2, Hyeon-Jeong Lee1,
Seul-Gi Bae4, Sung-Lim Lee1, Gyu-Jin Rho1, Seung-Joon Kim2, and Won-Jae Lee2,*
Objective: Quantitative polymerase chain reaction (qPCR) has been extensively used in the field of mesenchymal stem cell (MSC) research to elucidate their characteristics and clinical potential by normalization of target genes against reference genes (RGs), which are believed to be stably expressed irrespective of various experimental conditions. However, the expression of RGs is also variable depending on the experimental conditions, which may lead to false or contradictory conclusions upon normalization. Due to the current lack of information for a clear list of stable RGs in bovine MSCs, we conducted this study to identify suitable RGs in bovine MSCs.
Methods: The cycle threshold values of ten traditionally used RGs (18S ribosomal RNA [18S], beta-2-microglobulin [B2M], H2A histone family, member Z [H2A], peptidylprolyl isomerase A [PPIA], ribosomal protein 4 [RPL4], succinate dehydrogenase complex, subunit A [SDHA], beta actin [ACTB], glyceraldehyde-3-phosphate dehydrogenase [GAPDH], TATA box binding protein [TBP], and hypoxanthine phosphoribosyltrasnfrase1 [HPRT1]) in bovine bone marrow-derived MSCs (bBMMSCs) were validated for their stabilities using three types of RG evaluation algorithms (geNorm, Normfinder, and Bestkeeper). The effect of validated RGs was then verified by normalization of lineage-specific genes (fatty acid binding protein 4 [FABP4] and osteonectin [ON]) expressions during differentiations of bBMMSCs or POU class 5 homeobox 1 (OCT4) expression between bBMMSCs and dermal skins.
Results: Based on the results obtained for the three most stable RGs from geNorm (TBP,
RPL4, and H2A), Normfinder (TBP, RPL4, and SDHA), and Bestkeeper (TBP, RPL4, and SDHA), it was comprehensively determined that TBP and RPL4 were the most stable RGs
in bBMMSCs. However, traditional RGs were suggested to be the least stable (18S) or moder-ately stable (GAPDH and ACTB) in bBMMSCs. Normalization of FABP4 or ON against
TBP, RPL4, and 18S presented significant differences during differentiation of bBMMSCs.
However, although significantly low expression of OCT4 was detected in dermal skins com-pared to that in bBMMSCs when TBP and RPL4 were used in normalization, normalization against 18S exhibited no significance.
Conclusion: This study proposes that TBP and RPL4 were suitable as stable RGs for qPCR study in bovine MSCs.
Keywords: Bovine; Mesenchymal Stem Cells; Reference Gene; Normalization; Quantitative Polymerase Chain Reaction
INTRODUCTION
Mesenchymal stem cells (MSCs) have received attention in the fields of cell-based regen-erative medicine and biotechnology, which is due to their advantages such as the need for ethical issues, easy accessibility, self-renewal property, multi-differentiation potentials, and
* Corresponding Author: Won-Jae Lee
Tel: +82-53-950-5965, Fax: +82-53-950-5994, E-mail: [email protected]
1 Department of Veterinary Theriogenology and Biotechnology, College of Veterinary Medicine, Gyeongsang National University, Jinju 52828, Korea 2 Department of Veterinary Theriogenology, College of
Veterinary Medicine, Kyungpook National University, Daegu 41566, Korea
3 Department of Veterinary Research, Daegu Metropolitan City Institute of Health & Environment, Daegu 42183, Korea
4 Department of Veterinary Internal Medicine, College of Veterinary Medicine, Kyungpook National University, Daegu 41566, Korea
a These first authors contributed equally to this work.
ORCID Si-Jung Jang https://orcid.org/0000-0003-3829-6807 Ryoung-Hoon Jeon https://orcid.org/0000-0003-3174-1197 Hwan-Deuk Kim https://orcid.org/0000-0003-0917-9863 Jong-Chan Hwang https://orcid.org/0000-0002-1741-3405 Hyeon-Jeong Lee https://orcid.org/0000-0002-2154-239X Seul-Gi Bae https://orcid.org/0000-0001-9487-5665 Sung-Lim Lee https://orcid.org/0000-0002-1055-8097 Gyu-Jin Rho https://orcid.org/0000-0002-6264-0017 Seung-Joon Kim https://orcid.org/0000-0002-8521-8898 Won-Jae Lee https://orcid.org/0000-0003-1462-7798 Submitted Apr 16, 2020; Revised Jun 2, 2020; Accepted Jul 10, 2020
immunomodulatory capacity [1,2]. Like numerous studies on MSCs in various species, bovine MSCs have also been widely investigated for the past few decades to elucidate their char-acteristics and verify their clinical potential [3-5]. In particular, as large animal models, including cattle, possess a greater similarity to humans than small animals such as rodents, there has been an increase in the number of studies on large ani-mals to more reliably understand the potential of the clinical application of MSCs [3].
Gene expression studies are indispensable in the field of cellular biology research as they enable researchers to identify the gene regulatory network in cells [6]. In this context, quan-titative real-time polymerase chain reaction (qPCR), which has the advantages of convenience, sensitivity, reproducibility, and reliability, has been most commonly used to verify the potential of MSCs and determine the change in the mRNA expression of genes of interest (GOIs) [1,2]. During qPCR, the GOI is normalized against a reference gene (RG), also known as a housekeeping gene, as an internal control for its relative quantification; this step corrects sample-to-sample variations in the context of different experimental conditions, sample quality, operators, and laboratories [1,2,7,8]. Therefore, RGs should be stably expressed in various samples and not be affected by various experimental conditions; in principle, RGs play a pivotal role in the vital functions of cell survival and maintenance [7,9].
However, till date, no single RG has been addressed to be universal and perfectly constant. It is known that the expres-sion of RGs is also variable depending on the experimental conditions and cell types [10]. In particular, the normaliza-tion of GOIs against inadequate or unstable RGs may result in false or contradictory conclusions [1,7,11]. Therefore, vali-dation of RGs for their stability under each experimental condition is an extremely important and prerequisite step for obtaining reliable results during qPCR assay [2,7,8]. Unfortunately, information for a clear list of stable RGs in bovine MSCs is currently lacking, despite the fact that studies on cattle are being widely conducted. Therefore, the primary objective of this study was to identify the most suit-able RGs in bovine MSCs, before conducting further gene expression study by qPCR. After establishing bovine bone marrow-derived MSC lines, we evaluated the stability of a set of ten traditionally used RGs (18S ribosomal RNA [18S], beta-2-microglobulin [B2M], H2A histone family, member Z [H2A], peptidylprolyl isomerase A [PPIA], ribosomal pro-tein 4 [RPL4], succinate dehydrogenase complex, subunit A [SDHA], beta actin [ACTB], glyceraldehyde-3-phosphate dehydrogenase [GAPDH], TATA box binding protein [TBP], and hypoxanthine phosphoribosyltrasnfrase1 [HPRT1]) using the three most well-known algorithms (geNorm, Normfinder, and Bestkeeper). Thereafter, we applied the most and least stable RGs by normalization of GOIs (fatty acid binding
pro-tein 4 [FABP4], osteonectin [ON], and POU class 5 homeobox 1 (OCT4) to verify the importance of selecting suitable RGs in each study.
MATERIALS AND METHODS
Ethics statement
All experimental procedures were approved by the Institu-tional Animal Care Use Committee at Kyungpook NaInstitu-tional University (approval number: 2020-0038).
Chemicals and media
All chemicals and media were purchased from Thermo Fisher Scientific (Waltham, MA, USA), unless otherwise specified.
Sample preparation
The bone marrow extracts and dermal skins from the femurs were obtained from ~3-year-old castrated male bulls (Han-woo, bos taurus coreanae, n = 4) at the local abattoir after slaughtering. Samples from healthy individuals were collect-ed only under veterinarian examination. The bovine bone marrow-derived MSCs (bBMMSCs, n = 4) were isolated and established according to previous reports [1]. In brief, the bone marrow extracts were aspirated using a bone marrow aspiration needle (Jamshidi, BD, Franklin Lakes, NJ, USA) with flushing by Dulbecco’s phosphate-buffered saline and centrifugated by the Ficoll (Ficoll Paque PLUS, GE Health care, Uppsala, Sweden) gradient method at 400 g for 30 min at 4°C. Then, the mononuclear cell fraction was harvested and plated onto culture flasks. Once the adherent cells on the culture flasks were observed, the supernatant was re-moved and changed with fresh culture media. The cells were cultured in advanced Dulbecco’s modified Eagle medium (ADMEM) containing 10% fetal bovine serum (FBS), 1% GlutaMax, 10 ng/mL basic fibroblast growth factor, and 1% penicillin–streptomycin (Pen-Strep) at 38.5°C in a humidified incubator at 5% CO2 in air. When ~80% confluence was
reached, the cells were subcultured until passage 3 for further analysis. Small pieces of dermal skin (1 cm×1 cm, n = 4) at the femurs were collected, immediately preserved by snap-freezing with liquid nitrogen, and stored in a deep freezer until further experiment.
Characterization of bBMMSCs
The morphological characteristics of the ~80% confluent cells at passage 3 were examined to assess whether they exhibited fibroblastic morphologies with dendritic spindle shapes. Then, the cells were harvested, fixed with 4% paraformaldehyde (PFA) at 4°C overnight, and incubated with fluorescein iso-thiocyanate (FITC)-conjugated mouse anti-bovine CD44 (1:10 dilution) and mouse anti-bovine CD45 (1:10 dilution) antibodies at room temperature for 1 h. A total number of
1×10⁴ FITC-labeled cells (%) was counted by flow cytometry
(BD FACS Calibur, BD, USA). As mentioned in a previous report, the cells at passage 3 were differentiated for 3 weeks toward adipocytes or osteoblasts in an adipogenic medium (DMEM supplemented with 10% FBS, 100 mM indomethacin, 10 mM insulin, and 1 mM dexamethasone) or an osteogenic medium (DMEM supplemented with 10% FBS, 200 mM ascorbic acid, 10 mM glycerophosphate, and 0.1 mM dexa-methasone), respectively [12]. The differentiated bBMMSCS were fixed with 4% PFA and stained with 0.5% oil red solu-tion or 5% silver nitrate solusolu-tion (Von Kossa staining) with 0.5% alizarin red solution to assess adipogenesis or osteo-genesis, respectively.
RNA extraction and cDNA synthesis
The qPCR-related procedures were conducted according to previous reports [1,12]. Total RNA was extracted from bBMMSCs, differentiated bBMMSCs toward adipocytes and osteoblasts, and deep-frozen dermal skins using a QIA shredder column and RNeasy mini Kit (Qiagen, Hilden, Germany), including the RNase-free DNase treatment step for 15 min to remove residual genomic DNA, in accordance with the manufacturer’s instructions. The concentration and purity of total RNA samples were quantified by assessing
the A260/A280 ratio using a spectrophotometer (NanoDrop 1000), and only pure total RNA samples within 2±0.2 ratio were selected. First-strand cDNA was synthesized using 1 μg total RNA, 4 units Omniscript Reverse Transcriptase (Qiagen, Germany), 10 units RNase inhibitor, and 1 mM oligo dT primer at 60°C for 1 h using a thermal cycler (Qiagen, Germany).
Primer efficiency and cycle threshold value acquisition
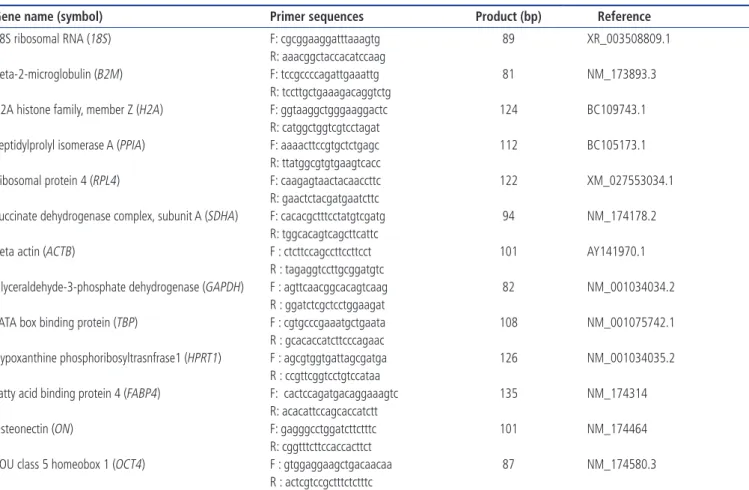
Considering the most common RGs in MSCs from other species, ten types of RGs were selected and designed using the NCBI Primer Designing Tool (http://www.ncbi.nlm.-nih. gov/tools/primer-blast/), resulting in a PCR amplicon with 80 to 130 base pairs at an annealing temperature of 60°C (Table 1) [1,7-9]. The qPCR was conducted using a Rotor Gene Q qPCR machine (Qiagen, Germany) with Rotor-Gene 2× SYBR Green mix (Qiagen, Germany), including 0.1 μg cDNA per reaction and 0.5 mM forward and reverse primers of RGs. The qPCR program designed to obtain the cycle threshold (Ct) values for each RG in bBMMSCs consisted of predenaturation at 95°C for 10 min; 45 PCR cycles at 95°C for 10 s, 60°C for 6 s, and 72°C for 4 s; melting curve from 60°C to 95°C at 1°C/s; and cooling at 40°C for 30 s. Ampli-fication curves, melting curves, and Ct values were analyzed
Table 1. Information of primers used in the present study
Gene name (symbol) Primer sequences Product (bp) Reference
18S ribosomal RNA (18S) F: cgcggaaggatttaaagtg 89 XR_003508809.1
R: aaacggctaccacatccaag
Beta-2-microglobulin (B2M) F: tccgccccagattgaaattg 81 NM_173893.3
R: tccttgctgaaagacaggtctg
H2A histone family, member Z (H2A) F: ggtaaggctgggaaggactc 124 BC109743.1 R: catggctggtcgtcctagat
Peptidylprolyl isomerase A (PPIA) F: aaaacttccgtgctctgagc 112 BC105173.1 R: ttatggcgtgtgaagtcacc
Ribosomal protein 4 (RPL4) F: caagagtaactacaaccttc 122 XM_027553034.1 R: gaactctacgatgaatcttc
Succinate dehydrogenase complex, subunit A (SDHA) F: cacacgctttcctatgtcgatg 94 NM_174178.2 R: tggcacagtcagcttcattc
Beta actin (ACTB) F : ctcttccagccttccttcct 101 AY141970.1
R : tagaggtccttgcggatgtc
Glyceraldehyde-3-phosphate dehydrogenase (GAPDH) F : agttcaacggcacagtcaag 82 NM_001034034.2 R : ggatctcgctcctggaagat
TATA box binding protein (TBP) F : cgtgcccgaaatgctgaata 108 NM_001075742.1 R : gcacaccatcttcccagaac
Hypoxanthine phosphoribosyltrasnfrase1 (HPRT1) F : agcgtggtgattagcgatga 126 NM_001034035.2 R : ccgttcggtcctgtccataa
Fatty acid binding protein 4 (FABP4) F: cactccagatgacaggaaagtc 135 NM_174314 R: acacattccagcaccatctt
Osteonectin (ON) F: gagggcctggatcttctttc 101 NM_174464
R: cggtttcttccaccacttct
POU class 5 homeobox 1 (OCT4) F : gtggaggaagctgacaacaa 87 NM_174580.3 R : actcgtccgctttctctttc
using the Rotor Gene Q Series Software (Qiagen, Germany). In addition, the size and specificity of all amplicons were checked by electrophoresis using 1% agarose gel with 0.1 mg/mL ethidium bromide. These qPCR experiments were repeated in triplicates. To validate the PCR efficiency of each RG in bBMMSCs, a standard curve of each primer of RG was generated from the Ct values using a four-fold serial dilution of cDNA from bBMMSCs under the aforementioned qPCR condition. The values related to PCR efficiency (E) and correlation (R2) were obtained using Excel (Microsoft,
Redmond, WA, USA) as described in a previous report [7].
Determination of stable RGs using geNorm, Normfinder, and Bestkeeper
The obtained Ct values of RGs in bBMMSCs from qPCR were analyzed for their stabilities using the three most well-known algorithms (geNorm, Normfinder, and Bestkeeper). The geNorm program calculates the stability measurement M (M value) for each RG. After a RG with the highest M value, indicating the least stable RG, is excluded from the pool of RGs, a new M value is continuously recalculated using the pool of left out RGs until the last two RGs with the lowest M value remained, implying the most stable RGs. In addition, geNorm calculates the normalization factor (NF) for each RG and proposes the optimal number of RGs for normaliza-tion (optimal normalizanormaliza-tion factor, NFopt) by continuously
calculating the pairwise variation (Vn/n+1) between
consecu-tively ranked NF (NFn and NFn+1) [13]. Normfinder is based
on an analysis of variance-based model to estimate intra- and inter-group variations to estimate the most stable RG. In this analysis, a lower value from the pool of RGs indicates a RG with a higher stability. Moreover, it can suggest the best combination of two RGs for the normalization step [14]. The Bestkeeper algorithm evaluates the standard deviation (SD) and the coefficient of variance of Ct values of RGs using Pearson’s pairwise coefficient correlations of all RGs against each other. In this program, a gene with a SD >1.0 is con-sidered as an unacceptable RG, and a lower value of SD (±Ct) implies a more stable RG [15].
Application of different reference genes to normalization
For the purpose of verifying the effect of stability of RGs, the most and least stable RGs in the present study were applied to the normalization of lineage-specific gene (FABP4 for adi-pogenesis and ON for osteogenesis) expressions in bBMMSCs during differentiation, and OCT4 expression as a pluripotent marker in bBMMSCs and dermal skins. The aforementioned qPCR conditions were applied to obtain the Ct value of RGs and GOIs (FABP4, ON, and OCT4). Thereafter, the Ct values of GOIs were normalized against those of several RGs. De-tails regarding the primer of GOIs are described in Table 1.
Statistical analysis
Pearson’s correlation analysis between NFopt and NF for the
three most stable RGs (NF3) was conducted, and Student’s
t-test was applied to assess the relative GOIs expression using PASW Statistics 18 (SPSS Inc., Chicago, IL, USA). Significant differences were considered at p<0.01.
RESULTS
Characterization of bBMMSCs
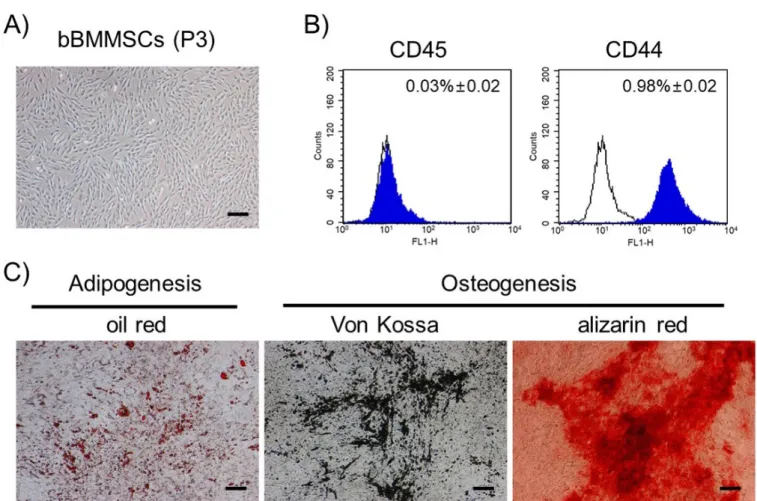
Figure 1 shows the results of characterization of bBMMSCs. The MSCs proliferated as adherent cells in the culture flasks and exhibited fibroblastic morphologies with dendritic spindle shapes (Figure 1A). CD44, a MSC-specific surface molecule, was strongly positive, whereas CD45, a hematopoietic stem cell marker, was negatively expressed in bBMMSCs (Figure 1B). The differentiation potentials into adipocytes or osteo-blasts were determined, which showed the formation of lipid droplets or deposition of minerals, respectively (Figure 1C). Therefore, the homogenous population was confirmed to be pluripotent bBMMSCs and used in the present study.
Examination of primer specificity, amplicon size, and primer efficiency
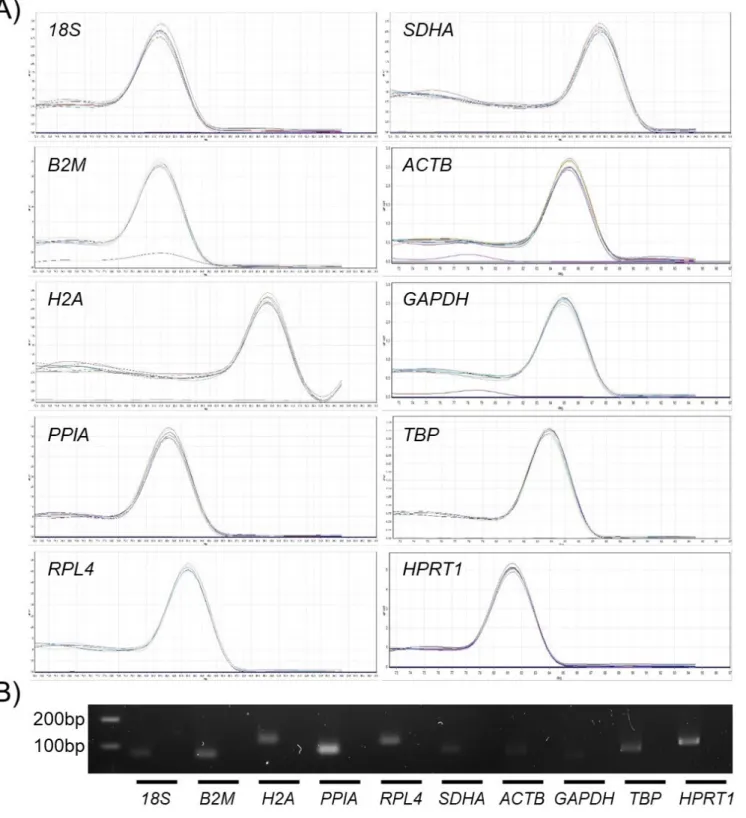
In the melting curve analysis conducted to validate the primer specificity after qPCR, all reactions confirmed a high peak of single products without any nonspecific amplification (Figure 2A). In addition, the gel electrophoresis of the amplicons demonstrated an expected product size without nonspecific amplification such as primer dimers and multiple bands (Figure 2B, Table 1). The standard curve derived from the Ct values using a four-fold serial dilution of cDNA from bBMMSCs produced correlations (R2) of 0.991 to 0.998 and
PCR efficiencies (E) of 0.95 to 1.04, implying that the primer design of the ten RGs in the present study was acceptable for qPCR. The detailed information of Ct values, correlation (R2), and PCR efficiencies (E) of each RG is described in
Table 2.
Analysis of stability of reference genes by geNorm, Normfinder, and Bestkeeper
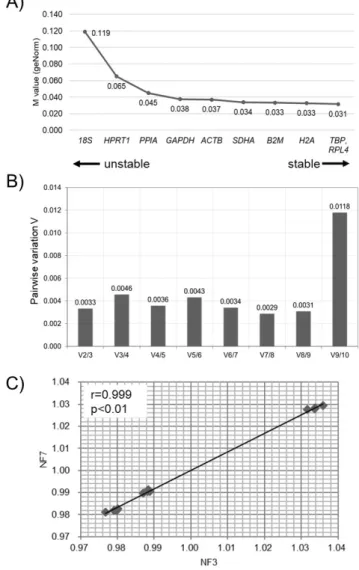
The Ct values of the ten RGs in bBMMSCs were assessed for stability (M values) and NFopt by geNorm (Figure 3). TBP,
RPL4, and H2A were identified as the three most stable RGs
in bBMMSCs, whereas the traditionally used RGs were de-termined as the least stable (18S) or moderately stable (GAPDH and ACTB) (Figure 3A). Furthermore, pairwise variation (Vn/n+1) suggested that the set of seven RGs (V7/8) was
con-sidered as NFopt (Figure 3B). As it was highly excessive to use
the seven RGs in a normalization step in qPCR, we further analyzed the correlation of NF between NF3 and NFopt (NF7)
analy-sis revealed a high correlation (r = 0.999, p<0.01) between NF3 and NFopt, indicating that the three most stable RGs (TBP,
RPL4, and H2A) were sufficient for normalization during
qPCR procedures in bBMMSCs (Figure 3C). Similar to the results of geNorm, TBP, RPL4, and SDHA were determined as the three most stable RGs, and the least stable RG was
18S in bBMMSCs according to Normfinder (Figure 4). In
addition, the Normfinder algorithm suggested that TBP and
RPL4 comprised the most stable combination of two RGs
for normalization. There were no RGs with a SD >1.0 in the Bestkeeper analysis, indicating the credibility of the RG can-didates in the present study. Bestkeeper showed that the three most stable RGs with the three lowest SD (±Ct) values were SDHA, RPL4, and TBP. 18S was also one of the least stable RGs, and GAPDH and ACTB were determined as moderately stable RGs in bBMMSCs (Figure 5). Altogether, based on the results obtained from geNorm, Normfinder, and Bestkeeper, it can be comprehensively concluded that
TBP and RPL4 were the two most stable RGs and the
tradi-tional RGs were the least stable (18S) or moderately stable (GAPDH and ACTB) in bBMMSCs. The small discrepancies,
ranking of stability, from each program may have been possi-bly caused due to the use of different algorithms.
Application of different reference genes to normalization
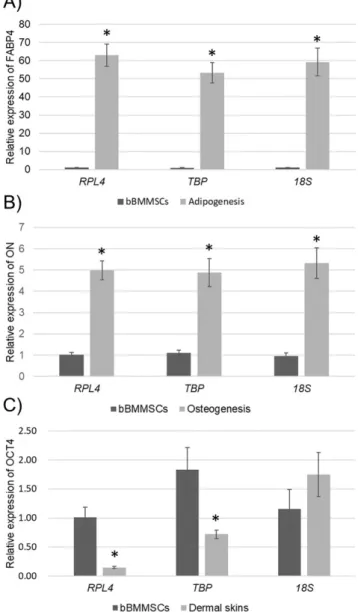
When suitable (TBP and RPL4) and unsuitable (18S) RGs were selected using the three programs, they were used for the normalization of lineage-specific gene (FABP4 and ON) expressions in bBMMSCs during differentiation or OCT4 expression in bBMMSCs and dermal skins to confirm the effect of stability of RGs (Figure 6). It has been well known that differentiation-induced MSCs highly express the relevant lineage-specific markers such as FABP4 and ON. Furthermore, because the dermal skins were considered as a completely differentiated tissues, we believed that the expression of the pluripotent marker (OCT4) could be lower or absent in the dermal skins compared to that in MSCs. As expected, when
TBP, RPL4, and 18S were employed for normalization, the
expression of lineage-specific genes was significantly increased after differentiation inductions of bBMMSCs (Figure 6A, 6B). In addition, a significantly (p<0.01) lower expression of
Figure 1. Characterization of bBMMSCs (magnification: ×40; bars: 100 μm). (A) The bBMMSCs at passage 3 (P3) exhibited fibroblastic morphologies with dendritic
spindle shapes. (B) Positive expression of MSC-specific cell surface molecule (CD44) and absence of hematopoietic cell surface molecule (CD45) were identified in bBMMSCs by flow cytometry. The ratios were presented as mean%±standard error of the mean. (C) The bBMMSCs demonstrated differentiation potentials toward adipocytes (oil red staining) and osteoblasts (Von Kossa and alizarin red staining). bBMMSCs, bovine bone marrow-derived mesenchymal stem cells.
OCT4 was detected in the dermal skins than in bBMMSCs
when TBP and RPL4 were used for normalization. In con-trast, the normalization of OCT4 against 18S exhibited no significance (Figure 6C). These findings implied that inval-idated RG could occasionally produce the unexpected results,
which were derived from unreliable normalization data.
DISCUSSION
Although qPCR has been widely used to elucidate the
char-Figure 2. Examination of primer specificity and amplicon size. (A) A high peak of single products without any nonspecific amplification was identified during melting curve
analysis. (B) Expected product size without nonspecific amplification was confirmed by gel electrophoresis. Lanes show ladder (100 and 200 bp) and respective amplicons (left) and negative controls (right) from each reference gene (RG).
acteristics of bovine MSCs and confirm their clinical potential, information for a clear list of stable RGs in bovine MSCs is currently not available. In the present study, we established bBMMSCs and investigated their Ct values using ten com-monly used RGs. The Ct values were then assessed for stability using the three most well-known algorithms (geNorm, Norm-finder, and Bestkeeper). Consequently, TBP and RPL4 were found to be the two most stable RGs in bBMMSCs, but tradi-tional RGs such as 18S, GAPDH, and ACTB were determined to be less stable. These attempts to validate the suitable RGs in each experimental condition represent a prerequisite for the reliable assessment of gene expression by qPCR, as there is no equally and constantly expressed RG regardless of vari-ous experimental conditions and the usage of an inappropriate RG may lead to false or contradictory results [7,8,11]. In this respect, to the best of our knowledge, the present study is the first to validate stable RGs in bovine MSCs.
Using other bovine specimens, several studies have been conducted to validate the stability of RGs in each experimental condition. Consistent with the present study results depicted in Figure 3 to 5, TBP was stably expressed in several bovine tissues, including the cumulus cell [16], corpus luteum ob-tained from cyclic or pregnant cows [17], and liver and thyroid [18]. RPL15, a ribosomal protein family along with RPL4, was also found to show stable expression in oocytes collected from cattle during winter and summer [19]. In agreement with the results of the present study, the usage of 18S for normalization was not recommended in the bovine mus-cular tissue [20] and corpus luteum [17]. In addition, several experimental conditions with cattle specimens in terms of the mammary gland under different lactation periods [21], polymorphonuclear leukocytes [22], cumulus cell [16],
mus-cular tissue [20], and peripheral lymphocytes [23] were found to be unsuitable to use ACTB and GAPDH for the normal-ization step. On the other hand, using some conditions such as polymorphonuclear leukocytes [22] and embryos produced
in vitro [24,25] in cattle, 18S and GAPDH were validated as
stable RGs, respectively. Altogether, the discrepancies in dif-ferent stabilities of RGs in each report using cattle are believed to be caused due to the differences in experimental condi-tions. Therefore, validation of the stability of RGs under each experimental condition is considered as an essential step before analyzing bovine gene expression by qPCR [2,7,8]. Similar studies have also been conducted in MSCs from
Table 2. Information of Ct values, correlation (R2) and polymerase chain reaction
efficiencies (E) of each reference genes
Gene (mean±SEM)Ct value Correlation (R2) PCR efficiencies (E)
RPL4 29.3 ± 0.2 0.995 0.98 H2A 23.5 ± 0.2 0.998 1.02 PPIA 20.5 ± 0.1 0.995 0.98 S18 10.9 ± 0.2 0.992 0.97 B2M 27.3 ± 0.2 0.991 0.96 SDHA 31.2 ± 0.1 0.997 1.04 ACTB 18.1 ± 0.2 0.997 0.99 GAPDH 17.9 ± 0.1 0.994 0.98 TBP 26.1 ± 0.2 0.995 1.01 HPRT1 23.3 ± 0.3 0.992 0.95
Ct, cycle threshold; PCR, polymerase chain reaction; SEM, standard error of the mean; RPL4, ribosomal protein 4; H2A, H2A histone family, member Z; PPIA, peptidylprolyl isomerase A; S18, 18S ribosomal RNA; B2M, beta-2-microglobulin; SDHA, succinate dehydrogenase complex, subunit A; ACTB, beta actin; GAPDH, glyceraldehyde-3-phosphate dehydrogenase; TBP, TATA box binding protein; HPRT1, hypoxanthine phosphoribosyltrasnfrase1.
Figure 3. Analysis of stable RGs by geNorm. (A) The ranking of stability (M
values) of RGs in bBMMSCs is presented from the least stable RG (left side of the graph) to the most stable RGs (right side of the graph). (B) The optimal number of RGs (NFopt) during normalization in bBMMSCs was recommended as 7 RGs
(NF7) by pairwise variation (V7/8). (C) High correlation (r = 0.999, p<0.01)
between NF3 and NF7 was identified by Pearson’s correlation analysis. RGs,
reference genes; bBMMSCs, bovine bone marrow-derived mesenchymal stem cells; NF, normalization factor; Vn/n+1, pairwise variation between consecutively
ranked NF (NFn and NFn+1); NFopt, NF for optimal number of RGs; NF7, NFopt as 7
other species. Comprehensively, TBP was one among the three most stable RG in human [2] and porcine [1] MSCs regard-less of cell source and differentiation induction, but 18S was the least stable RG. While RPL13A, a ribosomal protein family along with RPL4, was found to be stable in human MSCs derived from adipose tissue [8], bone marrow, and fetal tissue [9], normalization with ACTB was not recommended due to instability.
A survey based on NCBI-PubMed data for the usage of traditional RGs reported that GAPDH (27.24%), ACTB (30.62%), and 18S (12.52%) were the three most widely used RGs in qPCR, semi-qPCR, and northern blotting [26]. GAPDH is ubiquitously expressed in the cell and involved in DNA repair, tRNA export, membrane fusion, and transport, cyto-skeletal dynamics, cell death, oligomerization, posttranslational modification, and subcellular localization [27]. ACTB is an indispensable component of the cytoskeleton in the cell for cell migration, cell division, and regulation of gene expres-sion [28]. 18S is a component of the ribosomal RNA and plays a role in the biogenesis and function of ribosome in the cell [29]. However, its expression level is dependent on the experimental condition, in spite of its vital functions of cell survival and maintenance. In detail, the Ct values of both
GAPDH and ACTB were decreased in in vitro cultured blood
mononuclear cells even without any treatment [30] and altered under differentiation induction [1] and long-term culture [7] in MSCs. In the present study, we demonstrated the effect of the validated RGs during normalization and highlighted the possibility of false or misleading result caused by the usage of traditional RGs without validation (Figure 6). Normal-ization with both the most (TBP and RPL4) and least (18S)
Figure 4. Identification of stable RG by Normfinder. The stability of RGs is
ranked from the least stable RG (left side of the graph) to the most stable RG (right side of the graph). The most stable combination of RGs is presented in bold letters. RGs, reference genes.
Figure 5. Verification of stable RGs by Bestkeeper. The ranking of stability
(SD±Ct) of RGs from the least stable RG (left side of the graph) to the most stable RG (right side of the graph) was assessed. RGs, reference genes; Ct, cycle threshold; SD±Ct, standard deviation of the Ct.
Figure 6. Application of different RGs to normalization. (A and B) Relative
expression levels of lineage-specific genes (FABP4 for adipogenesis and ON for osteogenesis) were normalized against the most stable RGs (TBP and RPL4) and the least stable RG (18S) in bBMMSCs during differentiation. (C) Relative expression level of OCT4 was normalized against TBP, RPL4, and 18S in bBMMSCs and dermal skins to verify the effect of stability of RGs. RGs, reference genes; FABP4, fatty acid binding protein 4; ON, osteonectin; TBP, TATA box binding protein; RPL4, ribosomal protein 4; OCT4, POU class 5 homeobox 1; bBMMSCs, bovine bone marrow-derived mesenchymal stem cells. Significant (p<0.01) differences between bBMMSCs and their counterparts are presented with asterisk.
RGs could generate significant increase of lineage-specific genes in the differentiated bBMMSCs. However, there was no significant difference in OCT4 expression, which is known to be highly expressed in MSCs than in differentiated cells as a pluripotent marker, between bBMMSCs and dermal skins when the unstable RG (18S) was used for normaliza-tion. Similarly, although significant gradual downregulation of OCT4 expression during long-term culture of human MSCs, indicating progressive reduction of pluripotency, after normalization against the most stable RGs was observed, the least stable RG (GAPDH) generated no difference in
OCT4 expression [7]. These findings indicated the
impor-tance of validation of RGs before using even though they are widely used RGs.
An ideal RG should be neither affected nor regulated by each experimental condition. However, as no single RG has till date been addressed to be universal and perfectly constant regardless of the experimental condition, the importance of validation of RGs before normalization cannot be empha-sized enough to avoid generation of false or contradictory conclusions. To summarize, the present study proposes that
TBP and RPL4 were suitable as stable RGs for gene expression
study in bovine MSCs. These results may contribute to the experimental set-up of researchers working on animal MSCs as reference data.
CONFLICT OF INTEREST
We certify that there is no conflict of interest with any financial organization regarding the material discussed in the manu-script.
ACKNOWLEDGMENTS
This work was supported by a grant from the National Re-search Foundation (NRF) of Korea, funded by the government of the Republic of Korea (NRF-2017R1C1B5076029).
REFERENCES
1. Lee WJ, Jeon RH, Jang SJ, et al. Selection of reference genes for quantitative gene expression in porcine mesenchymal stem cells derived from various sources along with differen-tiation into multilineages. Stem Cells Int 2015;2015:235192. https://doi.org/10.1155/2015/235192
2. Ragni E, Viganò M, Rebulla P, Giordano R, Lazzari L. What is beyond a qRT-PCR study on mesenchymal stem cell differ-entiation properties: how to choose the most reliable house-keeping genes. J Cell Mol Med 2013;17:168-80. https://doi. org/10.1111/j.1582-4934.2012.01660.x
3. Bosnakovski D, Mizuno M, Kim G, Takagi S, Okumura M, Fujinaga T. Isolation and multilineage differentiation of bovine
bone marrow mesenchymal stem cells. Cell Tissue Res 2005; 319:243-53. https://doi.org/10.1007/s00441-004-1012-5 4. Huaman O, Bahamonde J, Cahuascanco B, et al.
Immuno-modulatory and immunogenic properties of mesenchymal stem cells derived from bovine fetal bone marrow and adipose tissue. Res Vet Sci 2019;124:212-22. https://doi.org/10.1016/ j.rvsc.2019.03.017
5. Mauck RL, Yuan X, Tuan RS. Chondrogenic differentiation and functional maturation of bovine mesenchymal stem cells in long-term agarose culture. Osteoarthritis Cartilage 2006;14: 179-89. https://doi.org/10.1016/j.joca.2005.09.002
6. Nailis H, Coenye T, Van Nieuwerburgh F, Deforce D, Nelis HJ. Development and evaluation of different normalization strategies for gene expression studies in Candida albicans biofilms by real-time PCR. BMC Mol Biol 2006;7:25. https:// doi.org/10.1186/1471-2199-7-25
7. Jeon RH, Lee WJ, Son YB, et al. PPIA, HPRT1, and YWHAZ genes are suitable for normalization of mRNA expression in long-term expanded human mesenchymal stem cells. Biomed Res Int 2019;2019:3093545. https://doi.org/10.1155/2019/ 3093545
8. Palombella S, Pirrone C, Cherubino M, Valdatta L, Bernardini G, Gornati R. Identification of reference genes for qPCR analy sis during hASC long culture maintenance. PLoS One 2017;12:e0170918. https://doi.org/10.1371/journal.pone.0170 918
9. Li X, Yang Q, Bai J, et al. Identification of optimal reference genes for quantitative PCR studies on human mesenchymal stem cells. Mol Med Rep 2015;11:1304-11. https://doi.org/ 10.3892/mmr.2014.2841
10. Schmittgen TD, Zakrajsek BA. Effect of experimental treat-ment on housekeeping gene expression: validation by real-time, quantitative RT-PCR. J Biochem Biophys Methods 2000; 46:69-81. https://doi.org/10.1016/S0165-022X(00)00129-9 11. Dheda K, Huggett JF, Bustin SA, et al. Validation of
house-keeping genes for normalizing RNA expression in real-time PCR. Biotechniques 2004;37:112-9. https://doi.org/10.2144/ 04371RR03
12. Lee HJ, Park BJ, Jeon RH, et al. Alteration of apoptosis during differentiation in human dental pulp-derived mesenchymal stem cell. J Anim Reprod Biotechnol 2019;34:2-9. https://doi. org/10.12750/JARB.34.1.2
13. Vandesompele J, De Preter K, Pattyn F, et al. Accurate nor-malization of real-time quantitative RT-PCR data by geometric averaging of multiple internal control genes. Genome Biol 2002;3:research0034.1. https://doi.org/10.1186/gb-2002-3- 7-research0034
14. Andersen CL, Jensen JL, Ørntoft TF. Normalization of real-time quantitative reverse transcription-PCR data: a model-based variance estimation approach to identify genes suited for normalization, applied to bladder and colon cancer data sets. Cancer Res 2004;64:5245-50. https://doi.org/10.1158/
0008-5472.CAN-04-0496
15. Pfaffl MW, Tichopad A, Prgomet C, Neuvians TP. Determi-nation of stable housekeeping genes, differentially regulated target genes and sample integrity: BestKeeper-Excel-based tool using pair-wise correlations. Biotechnol Lett 2004;26:509-15. https://doi.org/10.1023/B:BILE.0000019559.84305.47 16. Caetano LC, Miranda-Furtado CL, Batista LA, et al. Validation
of reference genes for gene expression studies in bovine oocytes and cumulus cells derived from in vitro maturation. Anim Reprod 2019;16:290-6. https://doi.org/10.21451/1984-3143- ar2018-0064
17. Rekawiecki R, Rutkowska J, Kotwica J. Identification of optimal housekeeping genes for examination of gene expression in bovine corpus luteum. Reprod Biol 2012;12:362-7. https:// doi.org/10.1016/j.repbio.2012.10.010
18. Lisowski P, Pierzchała M, Gościk J, Pareek CS, Zwierzchowski L. Evaluation of reference genes for studies of gene expression in the bovine liver, kidney, pituitary, and thyroid. J Appl Genet 2008;49:367-72. https://doi.org/10.1007/BF03195635 19. Macabelli CH, Ferreira RM, Gimenes LU, et al. Reference
gene selection for gene expression analysis of oocytes collected from dairy cattle and buffaloes during winter and summer. PLoS One 2014;9:e93287. https://doi.org/10.1371/journal. pone.0093287
20. Pérez R, Tupac-Yupanqui I, Dunner S. Evaluation of suitable reference genes for gene expression studies in bovine muscular tissue. BMC Mol Biol 2008;9:79. https://doi.org/10.1186/1471-2199-9-79
21. Bionaz M, Loor JJ. Identification of reference genes for quan-titative real-time PCR in the bovine mammary gland during the lactation cycle. Physiol Genomics 2007;29:312-9. https:// doi.org/10.1152/physiolgenomics.00223.2006
22. De Ketelaere A, Goossens K, Peelman L, Burvenich C. Techni-cal note: validation of internal control genes for gene expres-sion analysis in bovine polymorphonuclear leukocytes. J Dairy Sci 2006;89:4066-9. https://doi.org/10.3168/jds.S0022-0302(06)72450-X
23. Spalenza V, Girolami F, Bevilacqua C, et al. Identification of internal control genes for quantitative expression analysis by real-time PCR in bovine peripheral lymphocytes. Vet J 2011;189:278-83. https://doi.org/10.1016/j.tvjl.2010.11.017 24. Goossens K, Van Poucke M, Van Soom A, Vandesompele J,
Van Zeveren A, Peelman LJ. Selection of reference genes for quantitative real-time PCR in bovine preimplantation em-bryos. BMC Dev Biol 2005;5:27. https://doi.org/10.1186/1471-213X-5-27
25. Luchsinger C, Arias ME, Vargas T, Paredes M, Sánchez R, Felmer R. Stability of reference genes for normalization of reverse transcription quantitative real-time PCR (RT-qPCR) data in bovine blastocysts produced by IVF, ICSI and SCNT. Zygote 2014;22:505-12. https://doi.org/10.1017/S096719941 3000099
26. Gu YR, Li MZ, Zhang K, et al. Evaluation of endogenous control genes for gene expression studies across multiple tissues and in the specific sets of fat‐ and muscle‐type samples of the pig. J Anim Breed Genet 2011;128:319-25. https://doi. org/10.1111/j.1439-0388.2011.00920.x
27. Tristan C, Shahani N, Sedlak TW, Sawa A. The diverse func-tions of GAPDH: views from different subcellular compart-ments. Cell Signal 2011;23:317-23. https://doi.org/10.1016/ j.cellsig.2010.08.003
28. Bunnell TM, Burbach BJ, Shimizu Y, Ervasti JM. β-Actin specifically controls cell growth, migration, and the G-actin pool. Mol Biol Cell 2011;22:4047-58. https://doi.org/10.1091/ mbc.E11-06-0582
29. Ito S, Akamatsu Y, Noma A, et al. A single acetylation of 18 S rRNA is essential for biogenesis of the small ribosomal subunit in Saccharomyces cerevisiae. J Biol Chem 2014;289:26201-12. https://doi.org/10.1074/jbc.M114.593996
30. Emam M, Thompson-Crispi K, Mallard B. The effect of im-munological status, in-vitro treatment and culture time on expression of eleven candidate reference genes in bovine blood mononuclear cells. BMC Immunol 2015;16:33. https:// doi.org/10.1186/s12865-015-0099-7