INTRODUCTION
Abiotic stress is the primary cause of crop loss worldwide, reducing average yields for most major crop plants by more than 50%. Salinity also causes adverse effects on the growth of plants and the productivity of crops. One third of the irri-gated land in the world is affected by high salinity (Mass and Hoffmann 1977). Salinity affects at least 20% of world’s cultivated land and more than 45% of irrigated land (Rhoades and Loveday 1990). This slat stress is limiting agricultural
expansion in many areas of the world and is the most seri-ous problem in the aspects of crop productivity (Epstein et al. 1980; Yancey et al. 1982). Therefore, understanding the mechanisms of plant tolerance to salt stress and identification of stress responses will provide the breeding of effective strategies leading to greater salt stress tolerance (Bartels et al. 2005).
The analysis of osmotic stress-responsive in plants is an important way to the discovery of genes conferring stress tolerance and their use in breeding programs. A proteomic approach, the level of proteins, is not only a powerful mole-cular tool used at the organelle, cell, organ, and tissue levels (Lee et al. 2007), but it can also compare proteomes affected by different physiological conditions, such as those result-ing from the exposure to abiotic stress includresult-ing salinity. In
─ ─ 129 ──
Protein Prof iles in Response to Salt Stress in Seedling of
Salt Tolerant Rice Mutants
Jae Young Song1,†, Dong Sub Kim*,†, Myung-Chul Lee1, Kyung Jun Lee, Jin-Baek Kim,
Sang Hoon Kim, Bo-Keun Ha, Young-Keun Lee and Si-Yong Kang
Advanced Radiation Technology Institute, Korea Atomic Energy Research Institute, Jeongeup 580-185, Korea
1National Agrobiodiversity Center, National Academy of Agricultural Science, RDA, 88-20, Suwon 441-707, Korea
Abstract -- Proteomic analysis was performed in order to identify proteomic changes by salt stress
between the Japonica cv. Donganbyeo (WT) and two salt-tolerant (ST) mutant lines by using the SDS-PAGE and 2-DE. Two salt tolerant rice mutant lines, ST-87 and ST-301, were selected by in vitro mutagenesis with gamma-ray. Three-week-old seedlings were treated with 171 mM NaCl for 7 days. In the SDS-PAGE, three proteins with molecular weights of 27, 46 and 58 kDa were highly increased under salt treatment. Total proteins from shoots of both WT and ST-lines were separated by two-dimensional gel electrophoresis. In 2-DE, 201, 226, 217 and 213 protein spots were detected in the untreated-or treated-WT and untreated- or treated-ST-87, respectively. Of theses, 17 and 10 protein spots were up- and down-regulated under salt stress in the WT, respectively. While, 16 and 8 protein spots were up- and down-regulated under salt stress in the ST-87, respectively, compared with the untreated plants. High intensity or de novo synthesized proteins were analyzed by MALDI-TOF/MS analysis.
Key words : Gamma-ray, Mutant, Protein, Rice, Salt tolerance
†These authors contributed equally.
* Corresponding author: Dong Sub Kim, Tel. +82-63-570-3311, Fax. +82-63-570-3319, E-mail. [email protected]
widely, a high salt concentration causes cellular dehydration with concomitant osmotic changes including ion imbalance, deficiencies of mineral nutrition and water, oxidative dam-age and reduction of photosynthetic efficiency (Tsai et al. 2004). To defend against abiotic stress, plants use several strategies, one of which is regulation of gene expression at the mRNA level. The transcriptome analyses of gene expres-sion at the mRNA level have contributed greatly to our under-standing of the stress responses (Seki et al. 2002; Rabbani
et al. 2003). These approaches allowed identification of
many salt stress responsive genes in plants. However, the amount of translation, proteins, does not always correlated with the level of transcription, mRNA (Yan et al. 2005; Yan
et al. 2006). Therefore, it is insufficient to predict protein
expression level from quantitative mRNA and is necessary to study the salt stress response at the protein level. During the past several years, the rice proteomic analysis has increas-ed power as a result of improvements in two-dimensional polyacrylamide gel electrophoresis (2-DE) coupled with mass spectrometry (MS).
In our previous study, we isolated 2 ST-lines, ST-87 and ST-301, with salt tolerance by gamma ray in vitro mutagene-sis (Song et al. 2012). These ST-lines showed lower levels than the activity of the enzymatic catalase in the contents of EL and MDA and the higher peroxidase under the salt condi-tion compared with the wild type. The total amino acid con-tents in the seedling leaves of the ST-lines were 2.2 and 1.4-times higher than in the WT. The ratio of K++
/Na++
of the ST-87 (2.7 fold) was significantly higher than that of the WT (1.4 fold). In this study, we analyzed the proteomic com-parisons of the protein changes between the 2 ST-lines and the original variety (WT) through the sodium dodecyl sulp-hate (SDS-PAGE) and two-dimensional polyacrylamide gel electrophoresis (2-DE) after salt stress treatment.
MATERIALS AND METHODS
1. Plant materials and stress conditionsThe 2 ST-lines, ST-87 and ST-301, and WT (Oryza sativa cv. Dongan) plants were imbibed in 171 mM NaCl solution at 28±1�C for 7 days at the 3-week-old seedling stage. After salt treatment, the shoots harvested at the indicated time, frozen in liquid nitrogen and stored at -80�C until protein extraction for sodium dodecyl sulphate (SDS) and
two-dim-ensional polyacrylamide gel electrophoresis (2-DE).
2. SDS-PAGE analysis in the salt tolerant mutant lines
The leaf tissues of each lines were ground under liquid nitrogen and the total crude protein was then extracted in 5 ml of 100 mM Tris-HCl (pH 8.2) containing 20 mM calcium chloride from 100 mg of fresh leaves. The suspension was centrifuged at 13,000 rpm for 30 minutes. Protein content of the clear supernatants was determined by the Bradford method (Bradford 1976).
In the SDS-PAGE, protein (10μg) was added to an equiv-alent amount of 5x SDS-sample buffer [10% w/v sodium dodecyl sulphate (SDS), 50% v/v glycerol, 1.96% v/v b-mer-captoethanol, and 1 M Tris- HCl, pH 6.8]. The samples were held in boiling water for 5 min and then on ice for 5 min, immediately and centrifuged at 13,000 rpm for 5 min. The separation was performed with a 10% separating gel and 5% stacking gel using Bio-Rad Mini-PROTEAN 3 Cell (Bio-Rad, Richmond, CA). Electrophoresis was started at 100 volt until dye reached the end of the gel. The gel was stained with silver nitrate, according to the method of Ceils et al. (2006).
3. 2-DE analysis in the salt tolerant mutant lines Shoots were ground in liquid nitrogen and suspended in ice cold 10% trichloroacetic acid (TCA) in acetone contain-ing 0.07% 2-mercaptoethanol, incubated at -20�C for 1 h and followed by centrifugation at 13,000 rpm for 20 min at 4�C. The pellets were resuspended two times with 0.07% 2-mercaptoethanol in acetone, incubated at -20�C for 1 h and centrifuged at 13,000 rpm for 20 min at 4�C. The pellets were dried under vacuum for 30 min. The resulting powder was resuspended in lysis buffer [9 M urea, 1% CHAPS, 1% am-polytes (pH 4~7), and 1% DTT] followed by sonication on
ice for 30 min and centrifuged at 13,000 rpm for 20 min at 4�C. The supernatant was used in the 2-DE analysis.
For the 2-DE analysis, 150 mg of proteins were loaded onto analytical gels. The IPG strips were rehydrated for 16 h in 340 ml rehydration buffer containing protein samples. The first-dimension isoelectric focusing gel electrophoresis (IEF) was performed using pH 4~7 IPG strips (17 cm, linear)
in a IPGphor apparatus (GE Healthcare, Piscataway, NJ), according to the manufacturer’s recommendations. For the
second dimension, the gel strips were equilibrated for 15 min in 10 ml equilibration buffer [75 mM Tris-HCl buffer, pH 8.8, 6 M urea, 30% glycerol, 2% SDS, 1% DTT, and 0.002% bromophenol blue] and subsequently placed on to 12% polyacrylamide gels prepared. Electrophoresis was also performed according to the manufacturer’s recommenda-tion. The protein spots in analytical gels were visualized by silver staining (Ceils et al. 2006). At least three replicates were performed for each sample.
The gels were scanned by i-MAXTM Gel Image Analysis System (CoreBio, Seoul, KO). Image analysis was accom-plished using PDQuest 7.3 software (Bio-Rad). After auto-mated detection and matching, manual editing was carried out.
4. In-gel digestion and MALDI-TOF/TOF MS analysis
Protein spots were excised from the preparative gels, washed three times with ultrapure water, destained twice with 50 mM NH4HCO3in 50% acetonitrile, reduced with 10 mM DTT in 50 mM NH4HCO3, alkylated with 40 mM iodoacetamide in 50 mM NH4HCO3, dried twice with 100% acetonitrile, and digested overnight at 377�C with sequencing grade modified trypsin (Promega, Madison, WI, USA) in 50 mM NH4HCO3. The peptides were extracted twice with 0.1% TFA in 50% acetonitrile. Extracts were pooled and lyophilized. The resulting lyophilized tryptic peptides were dissolved in 5 mg Ml-1CHCA containing 0.1% TFA and 50% acetonitrile. MS analysis was conducted with a MALDI-TOF/TOF mass spectrometer 4700 Proteomics Analyzer (Applied Biosystems, Framingham, MA, USA). Data were analyzed using GPS Explorer software (Applied Biosystem) and MASCOT software (Matrix Science, London, UK). NCBInr and rice was selected as the database and taxonomy, respectively.
RESULTS
1. SDS-PAGE analysis of 2 ST-lines after salt treatment
In a previous report, we selected 2 ST-lines tolerant to high slat stress in vitro and on reclaimed saline land (Song
et al. 2012). For the investigation of the protein changes in
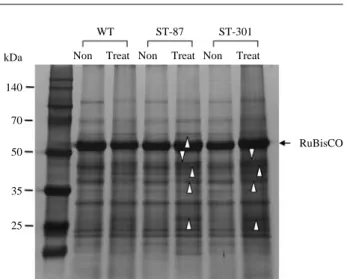
response to the salt stress, the WT and 2 ST-lines were sub-jected in the 171 mM NaCl nutrient solution at the 3-week-old seedling stage. SDS-PAGE analysis was performed to confirm changes in total proteins and to determine the pro-files of proteins separated on the basis on their solubility properties in salt tolerant lines. SDS-PAGE of total proteins revealed few protein profile differences between the WT and 2 ST-lines, ST-87 and ST-301 (Fig. 1). Salt stress cause reductions in the contents of ribulose-1,5-bisphosphate car-boxylase/oxygenase (RuBisCO) as well as enhancement of varied proteins marked by arrowheads, as compared with the WT. The RuBisCO in both ST-lines and WT plant showed almost no difference under normal conditions. However, the RuBisCO content in WT plant was decreased after salt treat-ment, while ST-lines significantly increased at 7 days after the salt treatment. Three proteins with molecular weights of 27, 46 and 58 kDa were highly increased under salt treatment.
2. Two-dimensional gel electrophoresis analysis of total proteins in 2 ST-lines
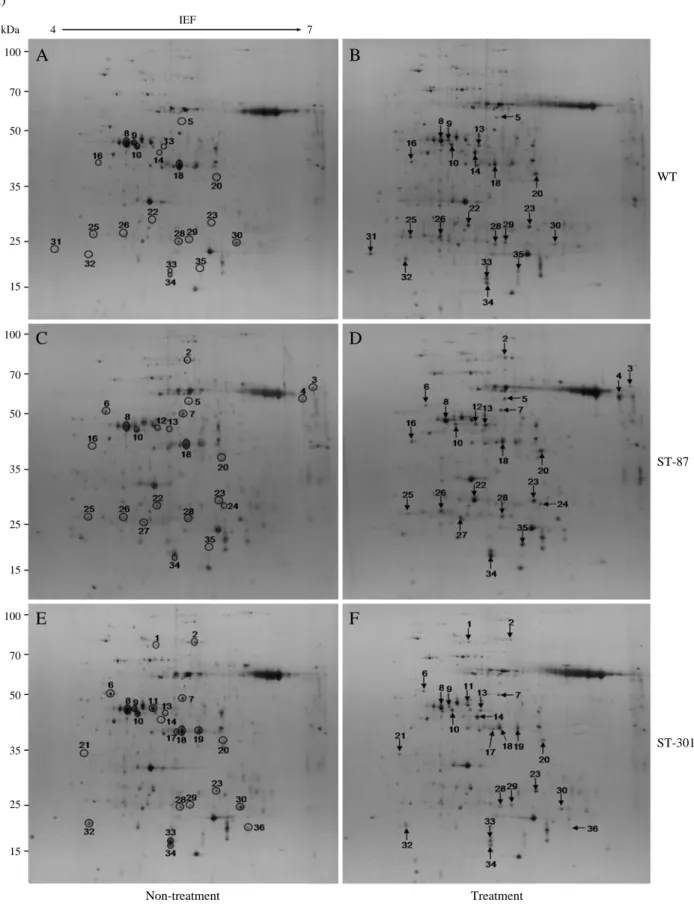
In order to investigate the changes of protein profile in response to salt stress, we carried out 2-DE analysis of total proteins of the WT and 2 ST-lines after slat treatment for 7 days. For each sample, at least triplicate gels were performed, and they showed a high level of reproducibility. The repre-sentative gels are shown in Fig. 2. We have marked only
RuBisCO kDa 140 70 50 35 25 WT ST-87 ST-301
Non Treat Non Treat Non Treat
Fig. 1. SDS-PAGE profiles of total protein in WT, 87, and
ST-301 before and after 171 mM salt treatment for 7 days. The proteins were resolved in a 10% SDS polyacrylamide gel and silver stained. Molecular weights are described on the left of the panel. The white arrowheads indicate the enhanced proteins in 2 ST-lines compared with those of the WT after salt treatment.
Fig. 2. Protein expression patterns in the shoots of the WT and 2 ST-lines exposed to salt stress. Proteins were separated by 2D-PAGE and
stained by silver nitrate. Arrows indicate the positions of proteins changed by salt treatment, and circles mark the position of the same proteins in the non-treatment (a). The relative levels of protein expression were analyzed in the WT and 2 ST-lines by using the PDQest software. The white and black bars show the salt non-treated and treated plants, respectively (b).
kDa 4 IEF 7 Non-treatment Treatment 100 70 50 35 25 15 100 70 50 35 25 15 100 70 50 35 25 15 WT ST-301 ST-87
A
B
C
D
E
F
(A)those major proteins that were most affected by salt treatment and which showed reproducible and obvious differences after salt treatment. In the 2-DE, more than 200 protein spots were detected in the untreated-or treated-WT, ST-87, and ST-301, respectively. Of theses, 36 proteins were differen-tially expressed under salt stress in one or other lines. Among 36 proteins, 21 protein spots were up- and down-regulated under salt stress in the WT. In the ST-87 and ST-301 lines, 22 and 23 protein spots were up- and down-regulated under salt stress, respectively, compared with the non-treated plants (Fig. 2a). Relative intensity of protein spots on the 2D-PAGE gels were analyzed by using the PDQuest software. Shoots of the WT and 2 ST-lines showed no reproducible differ-ences in the expression of proteins between non-treated and salt-treated plants. In the WT, the relative intensity of 15 proteins increased from 1.8 fold (spot 29) to 35.2 fold (spot
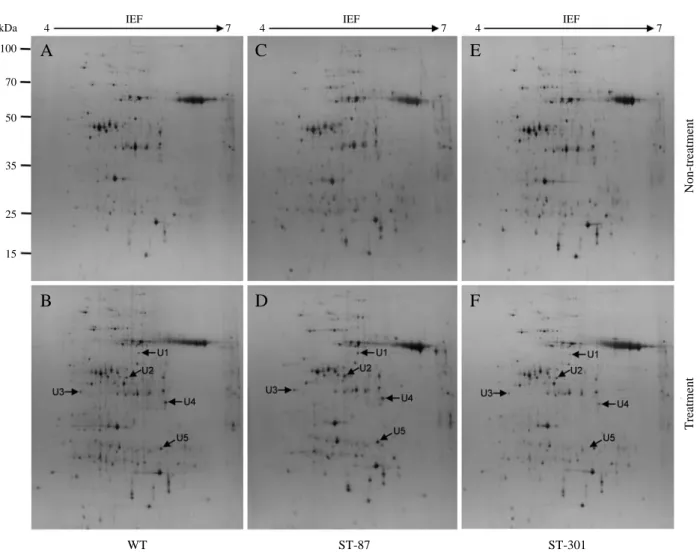
14) and 6 proteins were decreased from 1.2 fold (spot 8) to 3 fold (spot 9) under salt stress condition. In the ST-87, the relative intensities of 15 proteins increased from 2.0 fold (spot 28) to 53.2 fold (spot 22) and decreased from 1.3 fold (spot 25) to 2.3 fold (spot 10) and in the ST-301, increased from 1.1 fold (spot 8) to 61.7 (spot 14) and decreased from 1.1 fold (spot 34) to 2.3 fold (spot 36), compared with the non-treated plants (Fig. 2b). Although most proteins showed quantitative changes, some proteins showed de novo expres-sion. For example, 5 spots [spots 5 (U1), 13 (U2), 16 (U3), 20 (U4), and 23 (U5)] absent in the salt non-treatment were induced after salt treatment (Figs. 2 and 3). They were visible only in the treated samples, suggesting that they were newly synthesized after salt stress treatment or in very low abun-dance without salt stress. The other differentially increased or decreased proteins showed quantitative changes in after
120 100 80 60 40 20 0 120 100 80 60 40 20 0 100 80 60 40 20 0 5 8 9 10 13 14 16 18 20 22 23 25 26 28 29 30 31 32 33 34 35 2 3 4 5 6 7 8 10 12 13 16 18 20 22 1 2 6 7 8 9 10 11 13 14 17 18 19 20 Relative intensity Relative intensity Relative intensity 23 24 25 26 27 28 34 35 36 21 23 28 29 30 32 33 34 36 Wild-type ST-87 ST-301 Fig. 2. Continued (B) Spotnumber
4 IEF 7 4 IEF 7 4 IEF 7 100 70 50 35 25 15 Treatment kDa
Fig. 4. Differentially increased or decreased proteins on the 2-DE gels of the WT and 2 ST-lines proteins. Differentially accumulated protein
spots are indicated by arrows. All marked spots indicated changes between WT and ST-lines in response to salt stress as compared to WT.
B
D
F
WT ST-87 ST-301
4 IEF 7 4 IEF 7 4 IEF 7
100 70 50 35 25 15 Non-treatment Treatment kDa
Fig. 3. Representative de novo proteins on the 2-DE gels of the WT and 2 ST-lines proteins. Newly accumulated protein spots are indicated
by arrows. Five de novo proteins (U1-U5) are shown in response to salt stress as compared with the salt non-treated condition.
A
C
E
B
D
F
salt stress treatment. For example, 13 spots [spots 2 (U6), 4 (U7), 12 (U8), 14 (D1), U9, D2, D3, 25 (D4), 26 (D5), 22 (U10), 30 (U11), 34 (U12), and 35 (U13)] showed quantitative changes between the WT and 2 ST-lines under salt stress treatment (Figs. 2 and 4).
3. Salt stress-responsive proteins identified by MALDI-TOF/TOF MS analysis
The differentially expressed proteins were excised from the preparative gels, in-gel digested by trypsin, and analyzed by a MALDI-TOF/TOF mass spectrometer. Among 36 dif-ferentially accumulated proteins, 18 spots were analyzed by
the MALDI-TOF- TOF MS/MS. Three (U9, D2, and D3) of them had no MS and MS/MS data. Fifteen protein spots representing 8 different proteins were identified with high probability (Table 1). The MS/MS result of spot U13 is shown in Fig. 5 as an example. The proteins were identified as atpB gene product (spots U1 and U2), rubisco activase (spots U4, U7, and D1) as the same protein, putative chloroplast phos-phor-glycerate kinase (spot U3), fructose-bisphosphate aldo-lase, chloroplast precursor, putative, expressed (spot U10), and ribulose bisphosphate carboxylase large chain precursor, putative (spot U13). Spots U5 and 11 were identified as un-known proteins, Os06g0608700 and Os07g0570700, respec-tively (Fig. 4).
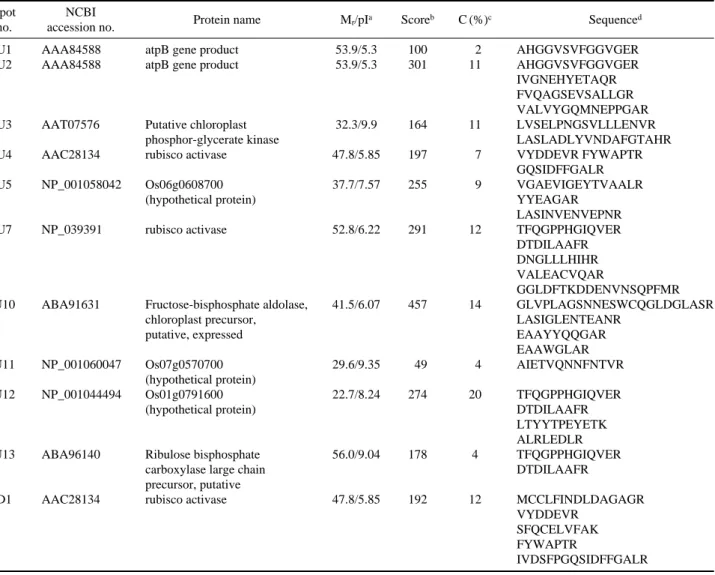
Table 1. Differentially expressed proteins in the WT (D1) and ST-87 (U1-U13) seedlings under salt stress
Spot NCBI
Protein name Mr/pIa Scoreb C (%)c Sequenced
no. accession no.
U1 AAA84588 atpB gene product 53.9/5.3 100 2 AHGGVSVFGGVGER U2 AAA84588 atpB gene product 53.9/5.3 301 11 AHGGVSVFGGVGER
IVGNEHYETAQR FVQAGSEVSALLGR VALVYGQMNEPPGAR U3 AAT07576 Putative chloroplast 32.3/9.9 164 11 LVSELPNGSVLLLENVR
phosphor-glycerate kinase LASLADLYVNDAFGTAHR U4 AAC28134 rubisco activase 47.8/5.85 197 7 VYDDEVR FYWAPTR
GQSIDFFGALR U5 NP_001058042 Os06g0608700 37.7/7.57 255 9 VGAEVIGEYTVAALR
(hypothetical protein) YYEAGAR LASINVENVEPNR U7 NP_039391 rubisco activase 52.8/6.22 291 12 TFQGPPHGIQVER
DTDILAAFR DNGLLLHIHR VALEACVQAR
GGLDFTKDDENVNSQPFMR U10 ABA91631 Fructose-bisphosphate aldolase, 41.5/6.07 457 14 GLVPLAGSNNESWCQGLDGLASR
chloroplast precursor, LASIGLENTEANR putative, expressed EAAYYQQGAR
EAAWGLAR U11 NP_001060047 Os07g0570700 29.6/9.35 49 4 AIETVQNNFNTVR
(hypothetical protein)
U12 NP_001044494 Os01g0791600 22.7/8.24 274 20 TFQGPPHGIQVER (hypothetical protein) DTDILAAFR
LTYYTPEYETK ALRLEDLR U13 ABA96140 Ribulose bisphosphate 56.0/9.04 178 4 TFQGPPHGIQVER
carboxylase large chain DTDILAAFR precursor, putative
D1 AAC28134 rubisco activase 47.8/5.85 192 12 MCCLFINDLDAGAGR VYDDEVR
SFQCELVFAK FYWAPTR
IVDSFPGQSIDFFGALR
aMolecular weight and isoelectric point.
bProbability-based molecular weight search (Mowse) score.
cSequence coverage of matched peptides.
DISCUSSION
In an attempt to understand the molecular basis of salt tol-erance, proteomics using a combination of SDS-PAGE and 2-DE was used to identify proteins involved in salt stress response for the selection of the salt tolerant mutant lines. The protein profiles in salt non-treated and treated shoots in the WT and 2 ST-lines using the SDS-PAGE revealed signi-ficant changes in the expression pattern of proteins. It was
found that three protein bands with molecular weights of 27, 46 and 58 kDa were highly increased and clearly observed in the ST-87 and ST-301 than that of the WT after salt treat-ment (Fig. 1). These results revealed that these proteins were expressed in specific regions of rice plants adapted to salt stress and suggested that the decrease of the protein content was attributed to the decrease rate of protein synthesis, the decreased availability of amino acids, or the denaturation of the enzymes involved in amino acid and protein synthesis (Dubey 1994). Salinity is a major factor in reducing the
Fig. 5. MS analysis of spot U13. The protein excised from gels was digested with trypsin and the resulting peptides were analyzed using a
4700 Proteomics Analyzer. A. MALDI-TOF MS analysis. The spectral peaks show the intensities of different peptides. The 1465.74 m/z ion (marked with an asterisk) was further analyzed by MS/MS. B, MALDI-TOF MS/MS analysis of the 1465.74 m/z ion. The protein was identified as the Ribulose bisphosphate carboxylase large chain precursor (NCBI accession number ABA96140) after database searching. 100 90 80 70 60 50 40 30 20 10 0 100 90 80 70 60 50 40 30 20 10 0 (A) (B) 799.0 1441.8 2084.6 2727.4 3370.2 4013.0 Mass (mg) 69.0 364.6 660.2 955.8 1251.4 1547.0 Mass (mg) % intensity % intensity 25E++4 99E++3
growth and productivity of plants. The reduction in plant dry matter might have been due to inhibition of sis as a result of direct effects of salinity on the photosynthe-tic apparatus (Dubey 1994).
The synthesis, accumulation, and degradation of protein in plants are highly regulated in response to environmental changes. Proteomic analysis of this study revealed that pro-teins associated with photosynthesis were differentially expressed upon salt stress. Rubiscos are the most prevalent enzymes in the plant. They form about 30~50% of the total soluble protein content of the chloroplast. Oxidative stress may lead to small-subunit degradation, subsequently leading to translational arrest of the large subunit. In the present study, the RuBisCO large subunit in both ST-lines and WT plant showed almost no difference under normal growth conditions. However, after salt treatment, the WT plant was significantly decreased in the amount of the RuBisCO, while, the ST-87 and ST-301 plants enhanced greater than that of the tolerant lines under non-treatment (Fig. 1). Also, in the 2-DE analysis, RuBisCO activase (spots U4 and U7) showed a significant increase after 7 days salt-treatment. Increased activity of RuBisCO subunits in maize and rice under salt stress has also been demonstrated (Kim
et al. 2005). Spots U1 and U2 were highly abundant proteins
on 2-DE gels in the saline condition compare to the WT (Fig. 4). These proteins were identified as a rice atpB gene pro-duct of chloroplast ATP synthase (Table 1). The atpB gene encodes β subunit of chloroplast ATP synthase and is co-transcribed in plant species (Westhoff et al. 1981). Chlorop-last ATP synthase plays an important role in biological energy metabolism in plant cells (Botha et al. 2006). In addi-tion, the atpB gene encodes the β-subunit of ATP synthase complex, which has a highly conserved structure that couples proton translocation across membranes with the synthesis of ATP (Gatenbey et al. 1989). The decrease in the level of atpB protein indicates that the ATP-synthesis system in the photosynthesis process in the WT plant is seriously affected by salt stress. Spot U3 was identified as putative chloroplast phosphorglycerate kinase. Phosphoglycerate kinase (PGK) is a monomeric enzyme, which catalyzes the transfer of the high-energy phosphate group of 1,3-bisphosphoglycerate to ADP, forming ATP and 3-phosphoglycerate. In this study, the molecular responses to salt stress were investigated at the protein level in rice. Thirty-six differentially expressed proteins were revealed, and 15 of them were further identified
by the MS/MS analysis. These proteins were involved in several processes that might work under salt stress. These results provides not only understands into salt stress responses but also a good starting point for further dissection of their functions using genetic and other approaches.
CONCLUSION
In the SDS-PAGE, three proteins with molecular weights of 27, 46 and 58 kDa were highly increased under salt treat-ment. Total proteins from shoots of both WT and ST-lines were separated by two-dimensional gel electrophoresis. In 2-DE analysis, more than 200 protein spots were detected in the untreated-or treated-WT, ST-87 and ST-301, respec-tively. Of theses, 36 proteins were differentially expressed under salt stress in one or other lines. Of 36 proteins, 21 pro-tein spots were up- and down-regulated under salt stress in the WT. In the ST-87 and ST-301 lines, 23 and 23 protein spots were up- and down-regulated under salt stress, respec-tively, compared with the untreated plants. Among 36 dif-ferentially accumulated proteins, 18 spots were analyzed by MALDI-TOF/TOF MS/MS. The proteins were identified as atpB gene product (spots U1 and U2), rubisco activase (spots U4, U7, and D1) as the same protein, putative chloroplast phosphor-glycerate kinase (spot U3), fructose-bisphosphate aldolase, chloroplast precursor, putative, expressed (spot U10), and ribulose bisphosphate carboxylase large chain precursor, putative (spot U13). Spots U5 and U11 were identified as un-known proteins, Os06g0608700 and Os07g0570700, respectively. High intensity or de novo synthesized proteins were analyzed by MALDI-TOF MS/MS analysis.
ACKNOWLEDGEMENTS
This work was supported by a grant from Agricultural R&D Promotion Center, Ministry for Food, Agriculture, Forestry & Fisheries and by grants from Korea Atomic Energy Research Institute (KAERI) and Ministry of Educa-tion, Science and Technology (MEST), Republic of Korea.
REFERENCES
Bartels D and Sunkar R. 2005. Drought and salt tolerance in plants. Crit. Rev. Plant Sci. 24:23-58.
Botha AM, Lacock L, van Niekerk C, Matsioloko MT, du Preez FB, Loots S, Venter E, Kunert KJ and Cullis CA. 2006. Is photosynthetic transcriptional regulation in Triticum aestivum L. cv. ‘TugelaDN’ a contributing factor for tolerance to Diuraphis noxia (Homoptera: Aphididae)? Plant Cell Rep.
25:41-54.
Bradford M. 1976. A rapid and sensitive method for the quanti-tation of microgramquantities of protein utilizing the prin-ciple of protein dye binding. Anal. Biochem. 72:248-254. Ceils JE, Carter N, Hunter T, Simons K, Small JV and Shotton
D. 2006. Protein Detection in Gels by Silver Staining: A Procedure Compatible with Mass-Spectrometry. In: Cell Biology: A Laboratory Handbook. 3 rd Edition. V4. Elsevier. Academic Press.
Dubey RS. 1994. Protein synthesis by plants under stressful conditions. pp. 277-299. In: Pessarakli M (ed.), Handbook of plant and crop stress, Macel Dekker, Inc, New York. Epstein E, Norlyn JD, Rush DW, Kingsbury RW, Kelly DB,
Cunningham GA and Wrona AF. 1980. Saline culture of crops: a genetic approach. Science 210:399-404.
Gatenbey AA, Rothstein SJ and Nomuraii M. 1989. Transla-tional coupling of the maize chloroplast atpB and atpE genes. Biochemistry 86:4066-4070.
Kim DW, Rakwal R, Agrawal GK, Jung YH, Shibato J, Jwa NS, et al. 2005. A hydroponic rice seedling culture model system for investigating proteome of salt stress in rice leaf.
Electrophoresis 26:4521-4539.
Lee DG, Ahsan N, Lee SH, Kang KY, Bahk JD, Lee IJ and Lee BH. 2007. A proteomic approach in analyzing heat-responsive proteins in rice leaves. Proteomics 7:3369-3383. Mass EV and Hoffmann GJ. 1977. Crop salt tolerance-current
assessment. J. Irrig. Drainage Div. ASCE. 103:115-134. Rabbani MA, Maruyama K, Abe H, Khan MA, Katsura K, Ito
Y, Yoshiwara K, Seki M, Shinozaki K and Yamaguchi-Shinozaki K. 2003. Monitoring expression profiles of rice genes under cold, drought, and high-salinity stresses and
abscisic acid application using cDNA microarray and RNA get-blot analyses. Plant Physiol. 133:1755-1767.
Rhoades J and Loveday J. 1990. Salinity in irrigated agricul-ture. Am. Soc. Civ. Eng. Irrigation Agric. Crops 30:1089-1142.
Seki M, Narusaka M, Ishida J, Nanjo T, Fujita M, Oono Y, Kamiya A, Nakajima M, Enju A, Sakurai T, Satou M, Akiyama K, Taji T, Yamaguchi-Shinozaki K, Carninci P, Kawai J, Hayashizaki Y and Shinozaki K. 2002. Monitor-ing the expression profiles of 7000 Arabidopsis genes under drought, cold and high-salinity stresses using a full-length cDNA microarray. Plant J. 31:279-292.
Song JY, Kim DS, Lee M-C, Lee KJ, Kim J-B, Kim SH, Ha B-K, Yun SJ and Kang S-Y. 2012. Physiological characterization of gamma-ray induced salt tolerant rice mutants. Aust. J.
Crop Sci. 6(3):421-429.
Tsai YC, Hong CY, Liu LF and Kao CH. 2004. Relative impor-tance of Na++and Cl-in NaCl induced antioxidant system
in roots of rice seedling. Physiol. Plant. 122:86-94. Westhoff P, Nelson N, Bünemann H and Herrmann RG. 1981.
Localization of genes for coupling factor subunits on the spinach plastid chromosome. Curr. Genet. 4:109-120 Yan S, Tang Z, Su W and Sun W. 2005. Proteomic analysis of
salt stress-responsive proteins in rice root. Proteomics 5:235-244.
Yan SP, Zhang QY, Tang JC, Su WA and Sun WN. 2006. Com-parative proteomic analysis provides new insights into chill-ing stress responses in rice. Molecular & Cellular
Proteo-mics 5:484-496.
Yancey PH, Clark ME, Hand SC, Bowlus RD and Somero GN. 1982. Living with water stress: evolution of osmlyte system. Science 217:1214-1222.
Manuscript Received: March 20, 2012 Revised: April 5, 2012 Revision Accepted: April 22, 2012