Application of MARS-GCR to the Pebble Bed Micro Model
Simulating a Three Shafts Power Conversion Unit
Chang Hyun KIM, Sung Won BAE, Young Jin LEE and Won Jae LEEKorea Atomic Energy Research Institute, 150, Dukjin-Dong, Yusung-Gu, Teajeon, Korea, 305-353
[email protected], [email protected], [email protected], [email protected]
1. Introduction
The utilization of a closed recuperative Brayton power conversion cycle is one of the viable options for the power conversion unit (PCU) of the next generation power plant (NGNP). Therefore, it is important for the safety analysis code to predict accurately the behavior of PCU. In an effort to develop a safety analysis code for Gas-Cooled Reactors (GCRs), the MARS code that was primarily developed for thermal-hydraulic (TH) analysis of water reactor systems has been extended for application to GCRs [1]. In this study, the developed MARS-GCR code is applied to the pebble bed micro model (PBMM) [2] simulating a three shafts power conversion unit to show its capability to the prediction of the dynamic behavior of three shafts power conversion system.
2. Methods and Results
The PBMM is a test facility with the purpose of better understanding the dynamic behavior of the PBMR power conversion unit. Although the design of PBMM closely resembles that of PBMR, the main difference is that the PBMM uses nitrogen instead of helium as the working fluid [2].
Fig.1 Schematic layout of the PBMM.
A schematic layout of the PBMM power conversion cycle is shown in Fig.1. Starting at (1), nitrogen at a relatively low pressure and temperature is compressed by a low-pressure compressor (LPC) to an intermediate pressure (2) after which it is cooled in an intercooler to state (3). A high-pressure compressor (HPC) then compresses the nitrogen to state (4). From (5) to (6) the nitrogen is preheated in the recuperator before entering
the heater, which heats the nitrogen to state (8). After the reactor the hot high-pressure nitrogen is expanded in a high-pressure turbine (HPT) to state (9) after which it is further expanded in a low-pressure turbine (LPT) to state (11). The high-pressure turbine drives the high pressure compressor while the low-pressure turbine is drives the low-pressure compressor. After the low pressure turbine the nitrogen is further expanded in the power turbine to pressure (13). From (13) to (14) the still hot nitrogen is cooled in the recuperator after which it is further cooled in the pre-cooler to state (1). This completes the cycle.
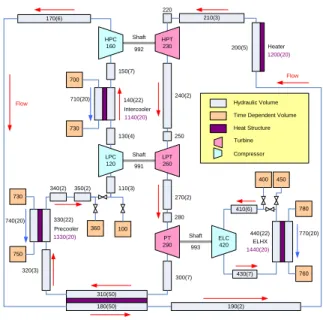
170(6) 310(50) 210(3) 180(50) 410(6) 430(7) 730 700 730 750 780 760 LPC 120 HPC 160 LPT 260 HPT 230 PT 290 ELC 420 100 360 190(2) 110(3) 130(4) 140(22) 150(7) 200(5) 220 240(2) 250 270(2) 280 300(7) 320(3) 330(22) 340(2) 350(2) 710(20) 740(20) 770(20) 440(22) Flow Flow Recuperator1180(20) Intercooler 1140(20) Heater 1200(20) ELHX 1440(20) Shaft 992 Shaft 991 Shaft 993 Precooler 1330(20) 450 400 Hydraulic Volume Time Dependent Volume Heat Structure Turbine Compressor
Fig. 2 MARS-GCR steady-state model for PBMM. MARS-GCR model for the steady-state analysis for PBMM is shown in Fig.2. Among the recent code implementations of MARS-GCR for the application to the GCRs[1], the following features are implemented for the present study: (i) coolant properties of nitrogen as well as helium and CO2 as the working fluid; (ii)
circulator/compressor model by extending existing “PUMP” model.
The gas property tables cover the range from the triple point to supercritical states with fine data intervals near the critical state. State-of-the-art models for the transport properties are incorporated in functional forms. The improved version was verified validated by comparing the calculated results with the NIST database and code-to-code benchmark for various steady and transient problems [1, 3].
Transactions of the Korean Nuclear Society Autumn Meeting Busan, Korea, October 27-28, 2005
Table 1. Summaries of MARS-GCR steady-state results
Inlet pressure = 1.0bar Inlet pressure = 2.5bar
Components ΔP [bar] ΔT [°C] RPM flowrate ΔP [bar] ΔT [°C] RPM flowrate
Low pressure compressor Low pressure turbine High pressure compressor High pressure turbine Load ejection compressor Load ejection turbine
1.06 -0.98 1.89 -1.39 0.48 -0.45 90.6 -91.1 81.4 -88.9 50.2 -63.5 72071 72071 70003 70003 39070 39070 0.573 0.573 0.573 0.573 0.668 0.668 2.6 -2.46 4.62 -3.41 1.16 -1.11 90.3 -91.4 81.5 -88.6 48.6 -62.4 71793 71793 69836 69836 38689 38689 1.408 1.408 1.408 1.408 1.649 1.649
Gas compressor performance is calculated by the pressure ratio of inlet to outlet pressure and the efficiency which are tabulated from its rotational speed and mass flowrate. Using Eq.(1), the compressor head (Δh) is calculated by using pressure ratio (PR), which comes from the interpolation of the tabulated data. The compressor torque (τ) is calculated by Eq.(2) using the interpolated efficiency (η).
(
)
g PR P h m ρ 1 1 − = ∆ (1)(
)
m PR P m ωηρ τ= & 1 −1 (2) 20 10 P PR P = (3)where, P10 and P20 is inlet and outlet total (or stagnant)
pressure, ω is the compressor rotational speed, m& is mass flow rate, and ρm is the average density of inlet
and outlet of compressor. The compressor/circulator model is verified and validated using for single and double circulator loop [4].
Two steady-state calculations are performed using MARS-GCR with the pressure boundaries at the inlet of LPC of 1.0bar and 2.5bar. Heater power is controlled using “control variable” to maintain the exit temperature as 700°C. The secondary sides of the heat exchangers are as follows: (i) intercooler and pre-cooler with inlet temperature of 20°C (water) and mass flowrate of 5kg/s; (ii) load ejection heat exchanger with inlet temperature of 20°C (water) and mass flowrate of 2kg/s. Pressure boundaries are applied at the inlet of LPC and ELC using “time dependent volume”. When the steady-sate is reached, the pressure boundaries are removed and the further steady-state calculation for the closed loop condition is performed using “restart” option.
The two steady-state results are summarized in Table 1. The MARS-GCR’s capability for the steady-state analysis of three shafts PCU is acceptable. The validation of the results will be performed through the comparison with the experimental data as soon as the data are available. The operating points of each steady-state result are plotted in T-S diagram as shown in Fig.3. The shape of the graphs is really the same and just shifted left as the operating pressure increases.
6.5 7.0 7.5 8.0 0 200 400 600 800 T e m p er a tur e [ oC] Entropy [kJ/kg-K] Pinlet = 1.0bar Pinlet = 2.5bar
Fig.3 Operating points of PBMM in T-S diagram. 3. Conclusions
The incorporation of nitrogen as the main working fluid and the compressor model are implemented to MARS-GCR to predict the behavior of the three shafts power conversion system. A preliminary evaluation of the steady-state performance of PBMM is performed and its capability to the three shafts PCU is acceptable.
ACKNOWLEDGEMENT
This work has been carried out under the nuclear R&D program of Ministry of Science and Technology (MOST) of Korea
REFERENCES
[1] W.J. Lee et al., Development of MARS-GCR/V1 and its Application to Thermo-Fluid Safety Analysis of Gas-Cooled Reactors, ICAPP’05 Paper 5231, Seoul, Korea, 2005.
[2] IAEA, Evaluation of High Temperature Gas Cooled Reactor Performance, IAEA-TECDOC-TBD, 2004.
[3] NIST Standard Reference Database 12, NIST Thermodynamics and Transport Properties of Pure Fluids – NIST Pure Fluids, Version 5.0, 2000.
[4] S.W. Bae et al., Development of Circulator Component in MARS-GCR for Gas Cooled Reactor System, Proc. KNS Autumn meeting, 2005.