A Spatial Data Mining and Geographical Customer Relationship Management System
Sang Moon Lee * , Jeong Min Seo **
공간 데이터마이닝을 이용한 고객 관리시스템
1)
이 상 문 * , 서 정 민 **
Abstract
Spatial data mining has been developed to support spatial association knowledge between spatial features or its non-spatial attributes for an application areas. At the present time, a number of researchers attempt to the data mining techniques apply to the several analysis areas, for examples, civil engineering, environmental, agricultural areas. Despite the efforts that, until such time as not existed practical systems for the gCRMDMs. gCRMDMs is merged with very large spatial database and CRM information system.
Also, it is discovery the association rule for the predictions of customer's shopping pattern informations in a huge database consisted with spatial and non-spatial dataset. For this goal, gCRMDMs need spatial data mining techniques. But, nowadays, in a most case not exist utilizable model for the gCRMDMs. Therefore, in this paper, we proposed a practical gCRMDMs model to support a customer, store, street, building and geographical suited to the trade area.
요 약
최근 마케팅이나 기업전략 분야에서 고객관리 및 점포관리 등의 업무를 위하여 GIS 기법을 적용한 다양한 응용시 스템이 개발되고 있다. 그러나 기존의 시스템들은 대부분 개별점포나 고객 담당자의 경험치를 이용하여 이루어져 왔으 며, 특정업종이나 특정 고객들에 대한 객관적인 분석시스템이 제시되지 않았다. 따라서 본 연구에서는 GIS 기법뿐만 아니라 시공간 데이터마이닝 기법을 적용한 gCRMs을 개발하였다. 본 시스템은 상권추출을 위한 새로운 시공간 데이 터마이닝 기법을 개발하여 다양한 GIS 응용 S/W의 개발이 가능하며, 상권에서 추출된 특성정보와 상권에서 발생하는 매출 등을 정성적, 정량적으로 평가할 수 있으며, 더 많은 다양한 지역에 적용하기 위한 일반화 기술의 원천기술을 획 득하여 향후 기술을 이용한 각종 마케팅이 가능하다. 또한 도지시역의 변화를 예측하는 것과 같은 시계열분석 등의 모델링 툴을 개발하는 기초적인 기술을 제공할 수 있다.
▸Keyword : CRM(
고객관리), Spatial(
공간), gCRMDMs, GIS, Data Mining(
데이터 마이닝)∙제1저자 : 이상문 교신저자 : 서정민
∙투고일 : 2010. 03. 31, 심사일 : 2010. 04. 02, 게재확정일 : 2010. 05. 04.
* The research was supported by a grant from the Academic Research Program of Chungju National University in 2009
Ⅰ. Introduction
Management information systems and store positioning systems, or CRM database using Geographic Information Systems (GIS) in the application field has been increasing. However, the simplicity of the cumulative data analysis using existing systems in the past, the methodology and statistical data based on people experience to analyze large amounts of data that are unsuitable gCRMDMs. The various of customer information and large scale and materials used in conjunction with spatial data analysis, so the complexity of the process include the human brain is impossible to analysis. How to solve this problem, the city is a spatial data mining technology. spatial data mining is find method that large databases and customer information, time and space from the database portion of interest or the relationship between the association and attribute data using the automated system. For example, 'In the past 2 years, Chungju -si Seongseo-dong chaeopneun-street demographic information to analyze the flow over time quite a few of the most fast-food stores are currently estimated', the quality of competition around the store's impact on information and revenue a floating population of the age, time-phased data analysis should be together. The statistical data analysis must be preceded with a spatial methods include that is impossible. But, if use spatial data mining to geographical factors and social data for the floating population is becoming more three dimensional analysis is possible. In addition to traditional text-oriented analysis of the readability of the outstanding 3-D graphs and multimedia formats in that it can pass on to analyzing the existing system could be established with is discrimination. In this paper, we propose, spatial gCRMDMs features useful for geographical customer relationship management data mining model. This paper presents the model of the spatial data mining gCRMDMs combining the
further development of the CRM system can be expected.
This paper consists of the following. Section 2 in the current international development of spatial related research in data mining are introduced.
Chapter 3 features gCRMDMs spatial around with data mining techniques can be applied in part to the technology. Chapter 4 of the CRM system with existing gCRMDMs functional elements of the system components and design and implement a prototype. Finally, Chapter 6 Conclusions and future challenges are discussed.
Ⅱ. Case Study
2.1 spatial Data Mining
Table 1. shows to a briefly about representative spatial data mining techniques[1, 2, 3]. Spatial clustering technique is method to find interested structure or cluster justly from data that unuse some background knowledges such as conceptional hierarchical structure informations.
Methods Examples
Clustering DBSCAN[4], PAM[5],
CLARANS[6, 5]
Description Neighbors[6, 1]
Classification Spatial decision tree[6, 4]
Detection Pseudo code[4], global trend, local trend[6]
Generalization Hierarchical structure[5]
Association <g_close_to, highway17>[4], X → Y(80%)[5]
Table 1. Spatial data mining techniques
The representative spatial clustering techniques
that k-medoid clustering[6, 5] such as CLARANS,
single scan clustering to search neighborhood of all
spatial features in a spatial database and, density
base clustering[4]. Spatial characterization is
method to find concise delineation or description
about selected subset of database[6, 1]. Spatial classification technique is method to allocate one feature in one class from set of given class based on attribute value of feature[6, 4]. Spatial trend detection technique is method that defined by regular change of one or many non-spatial attributes [6, 4]. [5] is introducing about techniques that investigate connection knowledge discovery of generalization, clustering and spatial association rule base. Techniques to discovered spatial association is much concerned with spatial character descript techniques. In concern with, [5] is presenting status relation, distance relation and direction relation by basic three types of spatial relations. And defined six extended operations using by these three types.
[4, 5, 7, 8] and [9] reify involved neighborship, and define and presenting “Neighborhood index” to avoid that approach space object confidence. Also, presenting “Cost model” to predict expense that
“Neighbors” operation by existence and nonexistence of “Neighborhood index”.
2.2 gCRMDMs
Lately, take advantage of GIS technology to CRM that supply information of simplicity textual information, competition store analysis, research about gCRMDMs that support multi-dimensional analysis and so on that use customer position information are consisting abuzz[10]. [11] is various spatial data mining technique and some relation such as connection spatial clustering, spatial character delineation, spatial classification, spatial direction retrieval, generalization, spatial operations on a gCRMDMs’s function. [12, 16, 17] proposed MAP/CRM system to support CRM. MAP/CRM used OMEGA [13] that is OOSDBMS to store and manages map information and customer information to marketing aided. MAP/CRM has client/server structure and added spatial analysis function to existing CRM of text center like data warehouse.
[14, 15] use decision-making tree analysis that is one of data mining techniques, gCRMDMs shows
customer specification class and test examples. For this, that system using NeedEye company’s Marzer tool that concord to fit customer information and customer’s administrative division, area customer ranges connecting customer information and map that do grouping and geographical changes and supply information about customer that is atomized visually presents gCRMDMs’s logical modeling with the financial world as the central figure and investigated about the practical use[15]. Those proposed Modeling is collected from corporation’s interior data and outside data, spatial data transform by data that application is possible in GIS through mapping. And, store to spatial data warehouse and that is G-TOOL using visualization functions to user variously viewpoint.
Ⅲ. Analysis Supporting System
3.1 System Architecture and Functions
Propose system is consisted of three portions greatly as appear in subsequent figure 1. gCRMDMs using spatial feature manager to supporting user interface of proposed system that function of map’s customer position information output and search, area population size, subway flow population size, area selection, position search, map registration etc.
And, support GIS concerned functions that spatial data mining, commerce area analysis, spatial analysis of location selection. spatial feature manager is divided by six kind of module that manages data that need to spatial analysis, and support spatial analysis function.
Finally, database of most important in the
gCRMDMs consisted by enterprise database, external
database, spatial database. Enterprise database
manages customer information, store information,
corporation’s interior data such as transaction
information. External database stores data such as
necessary statistics of population information, life
style information in customer management. spatial database manages feature based map as like spatial data
Fig. 1. Architecture of gCRMDSs
3.2 Exploratory Data Analysis
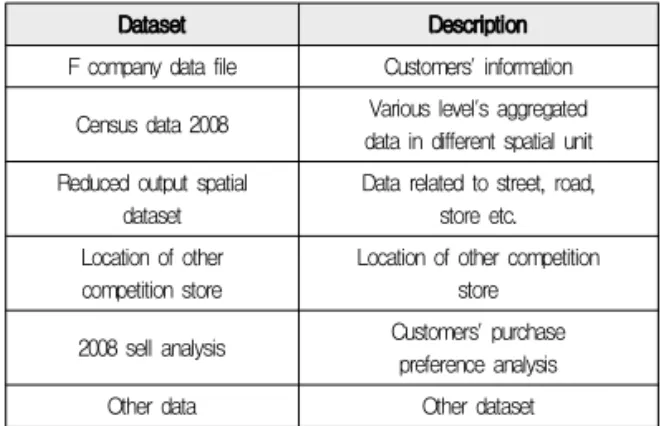
There are massive amounts of data stored in databases related to potential customer, their shopping preferences and purchase. Our task is to mine valuable information from such data. Those data come from different sources and are found in different formats. Table 1 lists the data which are used in our system.
Dataset Description
F company data file Customers' information Census data 2008 Various level's aggregated
data in different spatial unit Reduced output spatial
dataset Data related to street, road, store etc.
Location of other competition store
Location of other competition store 2008 sell analysis Customers' purchase
preference analysis
Other data Other dataset
Table 2. List of data sets and their attribute
After careful consultation with company marketing
staffs, a set of variable were selected, which included customers' flow and purchase pattern and their background.
Those data were then classified to potential customers' accessibility to age, sex and other dataset.
Figure 2 shows the method used to classify relevant attribute items, based on different levels of abstraction and different threshold. The process for each variable is iterative.
Fig. 2 Map and attribute data manager
3.3 Iterative Process
Following is the suede code for defining the algorithm and carrying out the process.
k is threshold value Open customer dataset
Match coordinates to each customer's record breakdown based on variable1(within district)
set user defined k if greater then k extract calculate summary statistics
map over house number area and other spatial unit
map over hourly floating population ages For extracted dataset
open dataset(variable 2)
set user defined time and age and k extract records
calculate summary statistics
map over different spatial unit map over different temporal unit accept/reject extract based on k loop until statisfied
rule(pattern) defined...
repeated above process for each variable...
result in a set of rule(pattern)
display those rules and define the area on the map
IV. System Implement And Experiment
4.1 System Experiment Environment
Apply proposed spatial analysis support system that we stored enterprise data, internal data, and spatial data in F company in an experiment system.
This system has various functions for customer management and business support by windows based business application that has Web-based architecture.
Enterprise data uses F company’s database. F company’s DBMS uses MSSQL Server 2003, and server is Windows2003 environment. spatial data constructs by proposed system’s map data manager that use digital map and managed by Seoul city’s DXF typed digital maps.
H/W
CPU Intel Core2 2.4GHz
RAM 3582MB
HDD 500GB
S/W
OS MS Vista Home Premium Ko
DB MSSQL 2003, db4object
Tool Visual Studio.Net 2005
P/L C# 2.0
Table 3. Experiment environment
4.2 System Experiment
Proposed system, support that the location of the region and the distribution of existing stores, store information, staff, sales patterns, and demographic information, and the floating population, the population of a particular territory, competitors, and provides location information. Store by city analysis,
the analysis can be divided by region. City analysis provides a visual feature that the number of stores in each region and to determine demographic information about the distribution of the entire store. Also, you can see the information of store, for example regional analysis of the exact location of the store location and competition, the floating population, the territory of the commercial district the number of customers.
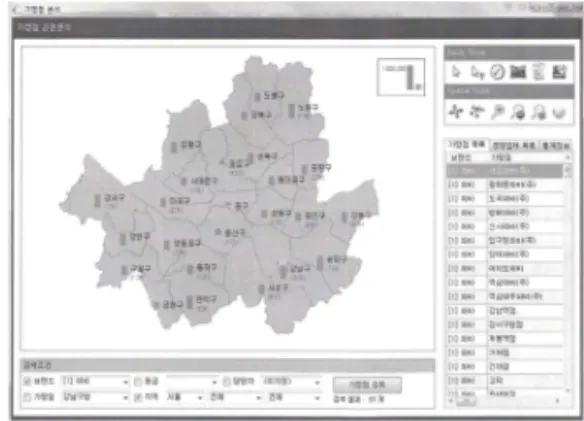
Fig. 3. Administrative regions of stores and demographic
Figure 3 shows in Seoul about the administrative regions of store and the population distribution status. Results 57 shops and many stores in Gangnam-gu. In addition, the local population of one million people, based on the percentage of the population is represented by a graph.
Figure 4 shows that Gangnam-gu for the store as a result viewed in regional demographic information and the number of stores.
Fig. 4. Store in Gangnam-gu, and population distribution
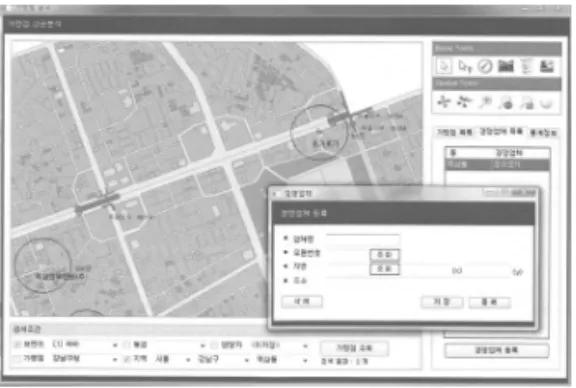
Figure 5 is located in Yeoksam-dong, Seocho-dong and shops are analyzed. Stores are located in areas within 500 meters radius of the store displays and contains the number of customers is key to show the location of the floating population. Figure 5 is located in Yeoksam-dong, Seocho and stores are analyzed. Stores are located in the store display area, and with radius of 500 meters in the number of customers and show the floating population of important point.
Fig. 5. Seocho-gu store distribution and number of customers
Figure 6 shows the registration screen competitors competing users can be registered using the address of the search area corresponding to the position of competitors and the commercial district can be seen.
Fig. 6. Yeoksam-dong competitor
Fig. 7. Yeoksam-dong commercial district area, selection and analysis
Figure 7 shows the user select a specific area by selecting the territory of the hourly number of customers is to identify the screen. In addition, using tools with your mouse on a particular area to create the desired shape to retrieve data.
V. Conclusion
We, in this paper, design and implemented spatial analysis support system for gCRMDMs. Proposed system has following characteristics. First, spatial feature and attribute data can manage integration used spatial data manager. Second, can get various result because offering various spatial analysis operations that need to gCRMDMs.
But, the result of experiment used our system, sources of customers tend to be located in particular spatial area and geographical settings. These locations(hot spots) are not static. So, to predict the movement of such hot spots, many factors need to be considered, including the economic growth of the regions, trend of customers' thinking fashion, etc.
And, there are a very large number of ways to define a set of area units for the collection or reporting of statistics. The choice can have important consequences for the later analysis of the data. Significantly different spatial patterns may be emerged as the level of spatial analysis is shifted. Defining spatial analysis units becomes the critical research task.
Also, there are many spatial statistical techniques
that need to be explored for spatial modeling. Those techniques include local spatial association, spatial autocorrelation, spatial regression and spatial cluster analysis. In addition, finally, for tools which assist the non-spatial and statistics specialists in the handling and analysis of spatial data, a range of graphical and numerical facilities need to be carefully designed and integrated to enhance the application of staffs special knowledge of the customers and stores.
References
[1] Ester M. et al., "Algorithms for Characteriza- tion and Trend Detection in Spatial Databases”, Proc. 4th Int’l. Conf. on Knowledge Discovery and Data Mining, pp. 44-50, 1998.
[2] J. M. Seo., "A Conceptual Feature-based Spatial Data Modeling Based on Groundwater Metadata and Attributes", Hankyong Nat’l Univ. Doctor Thesis, Ansung, Korea, 2006.
[3] J. M. Seo., et al., "A Spatial Analysis Supporting System Based on CRM”, Proc. MITA2008, Int.
Conf. on MITA, Chiang Mai, Thailand, pp.
37-40, 2008.
[4] Ester M. et al., "Spatial Data Mining: A Database Approach”, Proc. 5th Int’l. Symp. on Large spatial Databases, pp. 47-66, 1997.
[5] Koperski K. et al., "Spatial Data Mining:
Progress Challenges", TR 96-08, Univ. of British Columbia, Vancouver, Canada, 1996.
[6] Ester M. et al., "Spatial Data Mining:Database Primitives, Algorithms and Efficient DBMS Support”, In Data Mining and Knowledge Discovery, Vol.4, pp. 193-216, 2000.
[7] Ester M. et al., "Database Primitives for Spatial Data Mining”, Proc. Int. Conf. on Databases in Office, Engineering and Science, Freiburg, Germany, pp. 23-26, 1999.
[8] "GeoMiner: A Knowledge Discovery System for Spatial Databases and Geographic Information System.”,
http://db.cs.sfu.ca/ GeoMiner/[9] "GeoVRML Visualization: A Tool for Spatial Data Mining”,
http://www.geog.psu.edu/ica/ icavis/[10] S. Y. Jin, "G_CRM, The Keyword of CRM Solutions", Management & Computer, Seoul, Korea, 2002.
[11] K. J. Lee, et al, "gCRM and Spatial Data Mining”, KISS, Proc.. Spring Conf., Vol.29, No.1, pp.38-44, 2002.
[12 ] J. W, Jeong et al., “Map/CRM: GIS based CRM Used by Customer’s Geographic Information”, KSIGDB, Vol.17, No.1, pp. 85-92, 2001.
[13] H. K. Kang. et al., "Design And Implementa- tion of OMEGA Spatial Feature Management System”, KSIGDB, Winter Conf. Vol.14-1, pp.
197-202, 1998.
[14] S. S. Lee. et al., "gCRM Used Customer Information”, JKSS, Conf., Vol.18-3, pp.
567-581, 2005.
[15] Y. H. Jeong., 'A Study of CRM, G_CRM Used by GIS", Kookmin Univ. Master Thesis, Seoul, Korea, 2002.
[16] Cho. Y. H., et al., "Time-Series Data Prediction using Hidden Markov Model and Similarity Search for CRM", Journal of the Korea Society of Computer and Information, v.14, no.5, pp.19-28, 2009. 5.
[17] J. H. Jeon., et al., " A Modeling Methodology for Analysis of Dynamic Systems Using Heuristic Search and Design of Interface for CRM", Journal of the Korea Society of Computer and Information, v.14, no.4, pp.179-187, 2009. 4.
[18] Jong-Soo Yoon, "An Empirical Study on the
Relationships between System Characteristics
and Performance of Customer Relationship
Management", Journal of the Korea Society of
Computer and Information, v.12, no.2,
pp.315-324, 2007. 5.
저 자 소 개
Sang Moon Lee[email protected]
He received the B.S and Ph.D.
degree in Computer Science from Hongik University, Korea, in 1980, and 1993. And M.S. degree in Computer Science from Yonsei University, Korea, in 1984. He is currently a professor at the Dept. of Computer Science from Chungju National University, Korea since 1985. His interested research is Ubiquitous DB, Multimedia System and Spatial System.
Jeong Min Seo
![Table 1. shows to a briefly about representative spatial data mining techniques[1, 2, 3]](https://thumb-ap.123doks.com/thumbv2/123dokinfo/5324594.388293/2.892.458.792.752.950/table-shows-briefly-representative-spatial-data-mining-techniques.webp)