DOI : http://dx.doi.org/10.5394/KINPR.2011.35.9.701
Detection algorithm of ionospheric delay anomaly based on multi-reference stations for ionospheric scintillation
†Yunja Yoo, Deuk-Jae Cho*, Sang-Hyun Park**, Mi-Young Shin***
†, *,**,*** Marine Safety & Pollution Research Department, Korea Ocean Research & Development, Daejeon 305-343, Republic of Korea
Abstract : Radio waves including GPS signals, various TV communications, and radio broadcasting can be disturbed by a strong solar storm, which may occur due to solar flares and produce an ionospheric delay anomaly in the ionosphere according to the change of total electron content. Electron density irregularities can cause deep signal fading, frequently known as ionospheric scintillation, which can result in the positioning error using GPS signal. This paper proposes a detection algorithm for the ionosphere delay anomaly during a solar storm by using multi-reference stations. Different TEC grid which has irregular electron density was applied above one reference station. Then the ionospheric delay in zenith direction applied different TEC will show comparatively large ionospheric zenith delay due to the electron irregularity. The ionospheric slant delay applied an elevation angle at reference station was analyzed to detect the ionospheric delay anomaly that can result in positioning error. A simulation test was implemented and a proposed detection algorithm using data logged by four reference stations was applied to detect the ionospheric delay anomaly compared to a criterion.
Key words : GPS anomaly, solar storm, ionospheric delay anomaly, integrity monitoring
†Corresponding Author, [email protected] 042)866-3661 * [email protected] 042)866-3683
** [email protected] 042)866-3681
*** [email protected] 042)866-3668
Note) This paper was presented on the subject of "GPS anomalies detection based on multi-reference stations during solar storms for safety navigation"
in 2011 Asian Navigation Conference proceedings(Wuhan University of Technology, 10th Nov-3rd November, 2011, pp.220-227).
1. Introduction
GPS (Global Positioning System) is essential not only in land transportation but also in the maritime field for safe navigation. GPS satellites may deteriorate with age due to old satellite clocks, etc. Thus, a GPS signal is not always reliable for accurate positioning. Maritime, air and land transportation services can be interrupted by a GNSS (Global Navigation Satellite System) outage, which can lead to economic losses and loss of lives. Therefore, IM (Integrity Monitoring) needs to be implemented during GNSS service to users. A GPS anomaly can occur due to satellite clock error, ephemeris error, multipath, navigation data error, atmospheric anomaly such as tropospheric delay anomaly and ionospheric delay anomaly, etc. Solar storms affect TEC (Total Electron Content) changes, which can cause ionospheric delay (Dehel, 2005) (Mannucci, 2005).
Solar flares, which have an 11-year cycle, release CMEs (Coronal Mass Ejections) that can cause a solar storm.
NOAA (National Ocean and Atmospheric Administration) predicted maximum solar activity from 2013-2014 (NOAA, 2011). A strong solar storm can disturb radio waves, including GPS signals, making them fluctuate rapidly as they pass through the ionosphere which has an electron
density irregularities. This phenomenon is known as ionospheric scintillation and can result in degradation of signal strength and loss of phase lock (Seo, 2007). It also can cause the ionospheric delay anomaly that can result in precise positioning errors (Yoo, 2011). The code-carrier divergence test is one way to detect unusual divergences in the ionosphere, but it uses a single reference station that has less positioning accuracy than network RTK (Real Time Kinematic) approach (Luo, 2002) (Pullen, 2002) (Vollath, 2002).
This paper proposes an algorithm that monitors the ionospheric delay anomaly of the GPS signal based on multi-reference stations because of the scintillation patches inside ionosphere. In this paper the ionospheric delay anomaly is defined that has comparatively large ionospheric delay at some reference station due to a different TEC grid effects on multi-reference stations environment. The algorithm for the system monitoring the ionospheric delay anomaly of the GPS signal uses data logged by four reference stations, which can be affected by different TEC environments. The monitoring station collects information on the ionospheric delay from the four stations and estimates the ionospheric zenith delay of the ionospheric slant from common satellites at each station. The
ionospheric zenith delays will have similar values, if there were no solar storms when the GPS signal was passing through the ionosphere. However, the ionospheric delay anomaly will occur under a solar storm in the zenith direction when the ionosphere environments differ from that of each station. The difference of the ionospheric delay in the zenith direction between reference stations, which can be denoted as delta ionospheric zenith delay, is compared to a requirement performance, which can be a criterion of the GPS signal anomaly in the ionosphere.
Simulation tests permitting different TEC at only one reference station gave a larger delta ionospheric delay than the requirement performance, which is considered as an ionospheric delay anomaly by the network RTK approach.
The proposed algorithm detected an anomalous GPS signal passing the solar storm grid in the ionosphere.
2. Detection algorithm for the ionospheric delay anomaly
The spatial distance between two reference stations can result in different ionospheric delays. Each reference station that has a different elevation angle at an IPP (ionosphere pierce point) receives the ionosphere delay Iρd (code), Iφd (carrier phase), as follows (Kaplan and Hegarty, 2006).
2
40.3 ( )
d d I
I I TEC OF
ρ = −φ = f × ς
(1) Here, TEC is the total electron content [electrons/m2], f is L1 or L2 frequency, and the ionospheric obliquity factor
I( )
OF ς for zenith angle ς is as follows.
2 1/2
( ) 1 Esin
I
E I
OF R
R h
ς ς
⎡ ⎛ ⎞ ⎤−
⎢ ⎥
= − ⎜⎢⎣ ⎝ + ⎟⎠ ⎥⎦
Here, R is the mean radius of the earth [m], E h is I ionosphere height [m], and ς is zenith angle (90°-e, which e is the elevation angle at a reference station) [deg]. In Eq. (1), the ionospheric delay can vary due to the different elevation angles at IPP1 and IPP2 in Fig.1. The ionospheric delay varies with L1 and L2 frequency, and the dual frequency receiver can estimate the accurate ionospheric delay of L1 signal by using pseudo-range measurements of L1, L2 signals expressed by the following equation (Misra and Enge, 2006).
(2)
Here, IL1 is the ionospheric delay of L1 [m], f is L1 and L2 frequency [Hz], is pseudo-range measurement of L1, L2 signal [m].
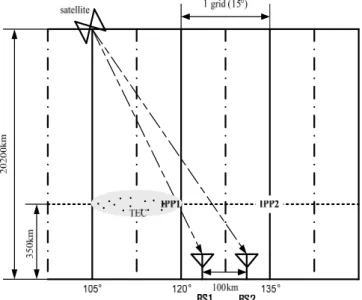
Fig. 1 shows the ionospheric delay difference due to the spatial distance between reference for different elevation angles at IPP1 and IPP2. The TEC grid between 105° and 120° (longitude) affects only reference station 1 (RS1), and the ionospheric zenith delay (or the ionospheric zenith total delay) of the ionospheric slant delay from the same satellite can cause the difference of ionospheric delay due to the different TEC influence. With four reference stations, the number of cases of the delta ionosphere zenith delay from common satellites between two reference stations becomes a combination 4C2 selecting two out of four (i.e. 6).
Fig.2 shows the basic concept of the delta ionospheric zenith delay from common satellite j between reference stations for six cases: ΔIztdj 1~ΔIztdj 6. It is possible to find the maximum delta ionospheric zenith delay maxΔIztdj between reference stations from the six delta ionospheric zenith delays and minimum elevation angle eminj at the reference stations of the common satellitej. Then, the delta ionospheric slant delay ΔIsdj of the maximum delta ionospheric zenith delay maxΔIztdj from common satellite j can be estimated. The vector of delta ionospheric zenith delay Aj becomes the number of cases of ΔIztdj for n number of reference stations that is a combination of nC2 selecting 2 out of n, and the elevation angle vector ej of common satellite j at each reference station can be expressed as follows.
1, 2, ,
j j j j
ztd ztd ztd
I I I n
⎡ ⎤
= Δ⎣ Δ ⋅⋅⋅ Δ ⎦
A
1, 2, ,
n
j j j j
RS RS RS
e e e
⎡ ⎤
=⎣ ⋅⋅⋅ ⎦
e
The representative value of the maximum delta ionosphere zenith delay maxΔIztdj of common satellite j, and the minimum elevation eminj of common satellite j is as follows.
maxΔIztdj =max(Aj)
minj min( )j
e = e
And the delta ionospheric slant delay ΔIsdj of common satellite j is estimated as follows.
max
min
1 sin
sd ztd
I I
Δ = Δ × e
(3)
i f ∆
or
∆≤
(4)
Here, the requirement performance is set to ±16cm when alert limit is 1.5m (half lane of highway with 3m) having 20% designed performance margin, considering the land transportation environment when DOP (Dilution Of Precision) is 3, and the mask angle is set to 10° (IMO, 2002).
±1.5 [m] / 2.5 / 3 80 [%] = ±0.16 [m] (5)
The delta ionospheric slant delay ΔIsd , which applied the minimum elevation angle emin to the maximum delta ionospheric zenith delay maxΔIztd among six delta
ionospheric delays, has flag 1 or flag 0 according to the criterion of whether or not it is larger than the requirement performance, respectively.
Fig.3 is the flow chart of the detection algorithm of the ionospheric delay anomaly in a multi-reference stations environment. Each reference station collects the ionospheric delay
Fig. 1 Ionospheric delay difference due to the spatial distance between reference stations
Fig. 2 Delta ionospheric zenith delay from common satellites between reference stations
Fig. 3 Flow chart for the detection algorithm of ionospheric delay anomaly in multi-reference stations environment
Id input data of common satellites, and estimates the ionosphere zenith delay Iztd and calculates the combination
4C2 of delta ionospheric zenith delay between reference stations. The maximum delta ionospheric zenith delay
maxΔIztd is selected from the six delta ionospheric zenith delays and the delta ionospheric slant delay Δ is Isd estimated applied to the minimum elevation angle emin at the four reference stations of common satellites. If the delta ionosphere slant delay Δ applied to the minimum Isd elevation angle of common satellite is larger than the requirement performance that the user sets, flag 1 is sent with the anomalous satellite’s PRN number; otherwise, flag 0 is sent.
3. Results and Discussion
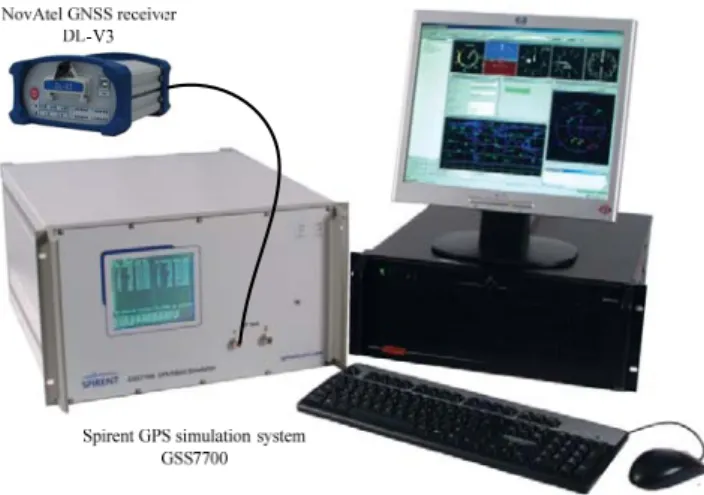
The detection algorithm for the ionospheric delay anomaly in a multi-reference stations environment proposed in Section 2 is applied in a simulation test using the Spirent GPS simulation system GSS 7700 in Fig.4 (bottom). The ionospheric delays from reference stations of common satellites were collected by the NovAtel GNSS receiver DL-V3 model in Fig.4 (top) ,which supports dual frequency measurements of L1 and L2 GPS signals. Four results of the simulation test at different reference station positions were used to estimate the delta ionosphere slant delay applied to different TECs at reference station 1, and the other three reference stations were applied with the same TEC. The distance between reference stations was about 100 km, and the logged data by NovAtel DL-V3 receiver at four reference stations were analyzed according to the procedure in Fig.3.
Simulation conditions are shown in Table 1. Spatial distance between RSs (reference stations) was about 100km, and TEC 10 was permitted on RS2~RS4. Different TEC of 10.25 was permitted on RS1 considering there was scintillation patch above RS1 only. Total simulation was 600 seconds and TEC was permitted from the start with scenario.
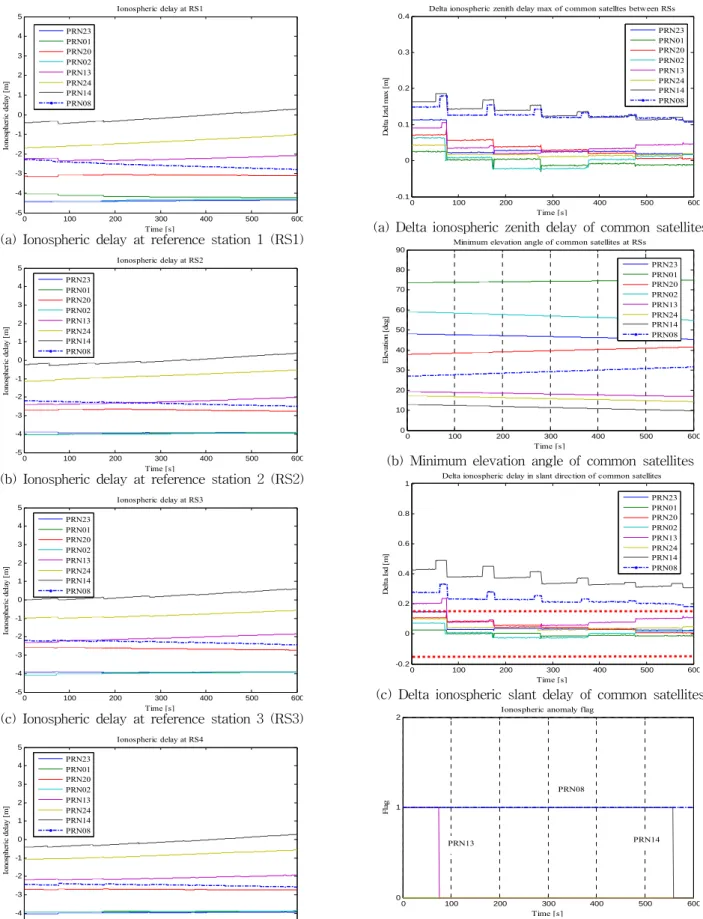
Fig.5 shows the ionospheric delay of common satellites at reference station 1 (a) ~ reference station 4 (d). PRN14 shows the smallest ionospheric delay at all reference stations, and there is a little difference within 50 cm
between reference stations of PRN14. The ionospheric delay has a trend based on the time progress due to the elevation changes of the satellites.
Fig.6 (a) is the maximum delta ionospheric zenith delay of eight common satellites from six cases between reference stations. PRN08 and PRN14 show larger values of the delta ionospheric delay in the zenith direction than the other satellites. Fig.6 (b) shows the minimum elevation angle of common satellites at the four reference stations.
PRN14 has the lowest elevation angle under the mask angle 10° between 500~600 [s]. Fig.6 (c) shows the delta ionospheric slant delay of common satellites applied to the minimum elevation angle of Fig.6 (b) to the maximum delta ionospheric zenith delay of Fig.6 (a). Three satellites’ delta ionospheric slant delays, which are PRN13, PRN08, PRN14, exceed the requirement performance plotted as a bold red line in Fig.6 (c). Fig.6 (d) is the ionospheric flag results applied to the proposed detection algorithm of the ionospheric delay anomaly based on multi-reference stations. PRN13, PRN08, PRN14 show flag 1, but PRN14 has flag 0 from about 550 [s], because the elevation angle is under the mask angle.
Fig. 4 Simulation environment (bottom) and receiver model (top)
Table 1. Simulation conditions
Spatial distance between RSs ≈ 100km Permitted TEC value
RS1 RS2 RS3 RS4
10.25 10 10 10
0 100 200 300 400 500 600 -5
-4 -3 -2 -1 0 1 2 3 4 5
Time [s]
Ionospheric delay [m]
Ionospheric delay at RS1 PRN23
PRN01 PRN20 PRN02 PRN13 PRN24 PRN14 PRN08
(a) Ionospheric delay at reference station 1 (RS1)
0 100 200 300 400 500 600
-5 -4 -3 -2 -1 0 1 2 3 4 5
Time [s]
Ionospheric delay [m]
Ionospheric delay at RS2
PRN23 PRN01 PRN20 PRN02 PRN13 PRN24 PRN14 PRN08
(b) Ionospheric delay at reference station 2 (RS2)
0 100 200 300 400 500 600
-5 -4 -3 -2 -1 0 1 2 3 4 5
Time [s]
Ionospheric delay [m]
Ionospheric delay at RS3
PRN23 PRN01 PRN20 PRN02 PRN13 PRN24 PRN14 PRN08
(c) Ionospheric delay at reference station 3 (RS3)
0 100 200 300 400 500 600
-5 -4 -3 -2 -1 0 1 2 3 4 5
Time [s]
Ionospheric delay [m]
Ionospheric delay at RS4
PRN23 PRN01 PRN20 PRN02 PRN13 PRN24 PRN14 PRN08
(d) Ionospheric delay at reference station 4 (RS4) Fig. 5 Ionospheric delay of common satellites at reference
station 1(a) ~ reference station 4(d)
0 100 200 300 400 500 600
-0.1 0 0.1 0.2 0.3 0.4
Time [s]
Delta Iztd max [m]
Delta ionospheric zenith delay max of common satelltes between RSs
PRN23 PRN01 PRN20 PRN02 PRN13 PRN24 PRN14 PRN08
(a) Delta ionospheric zenith delay of common satellites
0 100 200 300 400 500 600
0 10 20 30 40 50 60 70 80 90
Time [s]
Elevation [deg]
Minimum elevation angle of common satellites at RSs
PRN23 PRN01 PRN20 PRN02 PRN13 PRN24 PRN14 PRN08
(b) Minimum elevation angle of common satellites
0 100 200 300 400 500 600
-0.2 0 0.2 0.4 0.6 0.8 1
Time [s]
Delta Isd [m]
Delta ionospheric delay in slant direction of common satellites
PRN23 PRN01 PRN20 PRN02 PRN13 PRN24 PRN14 PRN08
(c) Delta ionospheric slant delay of common satellites
0 100 200 300 400 500 600
0 1 2
Time [s]
Flag
Ionospheric anomaly flag
PRN13
PRN08
PRN14
(d) Ionospheric anomaly flag results
Fig. 6 Delta ionospheric zenith delay (a), minimum elevation angle (b), delta ionospheric slant delay (c) of common satellites at four reference stations, and ionospheric anomaly flag results (d)
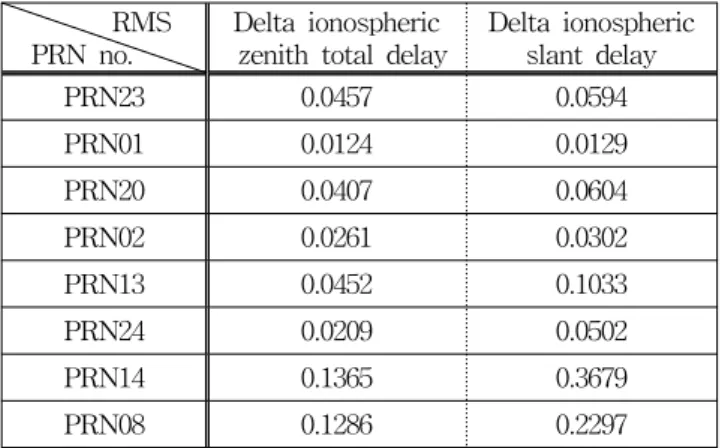
Table 2. RMS results of delta ionospheric zenith total delay and delta ionospheric slant delay of common satellites at four reference stations
RMS PRN no.
Delta ionospheric zenith total delay
Delta ionospheric slant delay
PRN23 0.0457 0.0594
PRN01 0.0124 0.0129
PRN20 0.0407 0.0604
PRN02 0.0261 0.0302
PRN13 0.0452 0.1033
PRN24 0.0209 0.0502
PRN14 0.1365 0.3679
PRN08 0.1286 0.2297
Table 2 shows the RMS (Root Mean Square) results of maximum delta ionospheric zenith delay in Fig.6 (a), and delta ionospheric slant delay in Fig.6 (c) of common satellites. PRN14 has the largest RMS result of 0.3679 [m], and then PRN08 has the second largest RMS result of 0.2297 [m], both of which are larger than the requirement performance for the delta ionospheric slant delay results.
PRN01 has the lowest RMS result of 0.0129 [m] for the delta ionospheric slant delay, which has the highest elevation angle in Fig.6 (b) above 70 degrees.
Conclusion
The ionospheric delay anomaly has comparatively large ionospheric delay above some reference station due to a scintillation patch that can influence on multi-reference stations environment with different TEC grid effects. Then it is needed to implement a system monitoring for the ionospheric delay anomaly of GPS signal under the multi-reference stations environment.
This paper proposed a detection algorithm of the ionospheric delay anomaly based on multi-reference stations. Simulation results applying different TEC at one reference station showed that the delta ionosphere slant delay exceeded the requirement performance. The proposed algorithm detected anomalous satellites designated with a PRN number and sent ionospheric anomaly flags. However, further study is needed to set a more appropriate threshold based on live tests.
Acknowledgements
This work was supported by the Ministry of Land,
Transport, and Maritime Affairs (MLTM) (06-A03;
PMS2410).
References
[1] Dehel, T.F. (2005): Observations of Ionospheric Walls of TEC During Geomagnetic Storms, Proceedings, ION (Institute Of Navigation) 61st annual meetings, 27-29 June
[2] IMO (International Maritime Organization) (2002):
Revised maritime policy and requirements for a future global navigation satellite system (GNSS), Resolution A.915(22)
[3] Kaplan, E.D., Hegarty, C.J. (2006): Understanding GPS –Principles and Applications-
[4] Luo, M., Pullen, S., Akos, D., Xie, G., Datta-Barua, S., Walter, T., Enge, Per. (2002): Assessment of Ionospheric impact on LAAS using WAAS supertruth data, Proceedings, ION (Institute Of Navigation) 58th annual meetings, 24-26 June, Albuquerque
[5] Misra, P. and Enge, P. (2006): Global Positioning System –Signal, Measurement, and Performance- [6] NOAA (National Oceanic and Atmospheric
Administration) (2011): http://www.swpc.noaa.gov/, Space Weather Prediction Center website of the US National Oceanic and Atmospheric Administration [7] Pullen, S., Luo, M., Xie, G., Lee, J., Phelts, R.E., Akos,
D., Enge, P. (2002): LAAS ground facility design improvements to meet proposed requirements for category II/III operations, Proceedings, ION (Institute Of Navigation), 24-27 September, Portland
[8] Seo, J., Walter, T., Chiou, T.Y., Enge, P. (2007):
Ionospheric scintillation effects on GPS receivers during solar minimum and maximum, International Beacon Satellite Symposium, 11-15 June, Boston [9] Vollath, U., Landau, H., Chen, X., Doucet, K., Pagels,
C. (2002): Network RTK versus single base RTK – Understanding the error characteristics, Proceedings, ION (Institute Of Navigation), 24-27 Sept., Portland [10] Yoo, Y., Shin, M.Y., Cho, D.J., Park, S.H. (2011): How
sun spot activity affects on positioning accuracy?:
Case study of solar storm, Int. J. Navigation and Port Research 35 (6), pp.477-482
Received 9 November 2011 Revised 22 December 2011 Accepted 23 December 2011